Tis the Season for the most powerful seasonality trade of the year!

Seasonal ETF Trading Strategies
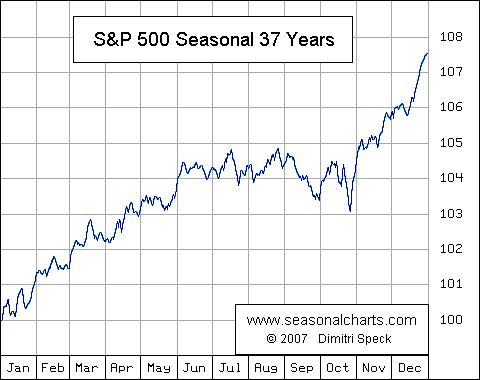
With the stock market up big in 2013 and most participants are speculating on a pullback in the next week or two, I have to say I am on the other side of that bet. Being a technical trader I focus on patterns, statistics and probabilities to power my ETF trading strategies. So with 37 years of stats the seasonality chart of the S&P 500 index paints a clear picture of what is likely to happen in December.

If you do not know how to read a seasonality chart, I will explain as its very simple. The simply shows what the index has done on average through each month over the past 37 years. December typically has the strongest up trend and probability of happening any other time of the year.


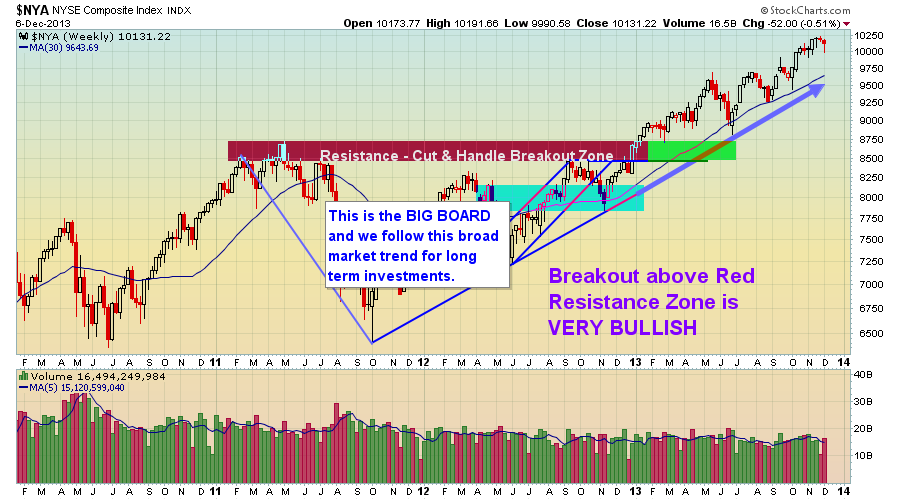
The Big Board – NYSE

The NYSE also referred to as the Big Board, is an index with the largest brand name companies. Most individuals do not follow this, but to me its as close to the holy grail of trading than anything else I know. I use many different data points from this index (momentum, order flow, trend) for my ETF trading strategies.

You must follow the trend of this index if you want to be on the right side of the market. While I follow and track the New York Stock Exchange closely and it has its own fund NYC but it’s an ETF trade I do not use. These big stocks are what really move the market (S&P 500) I think so I always trade with this index trend in mind.

NYSE ETF Trade


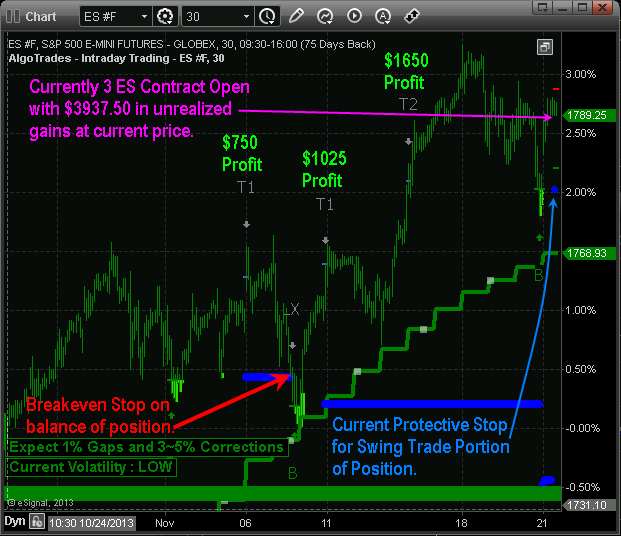
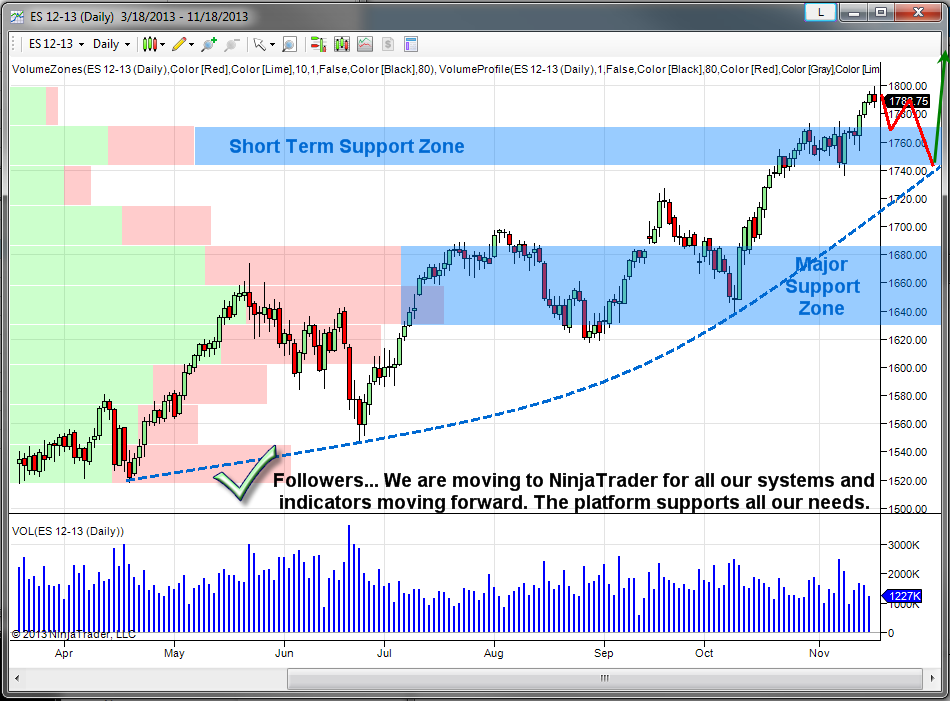
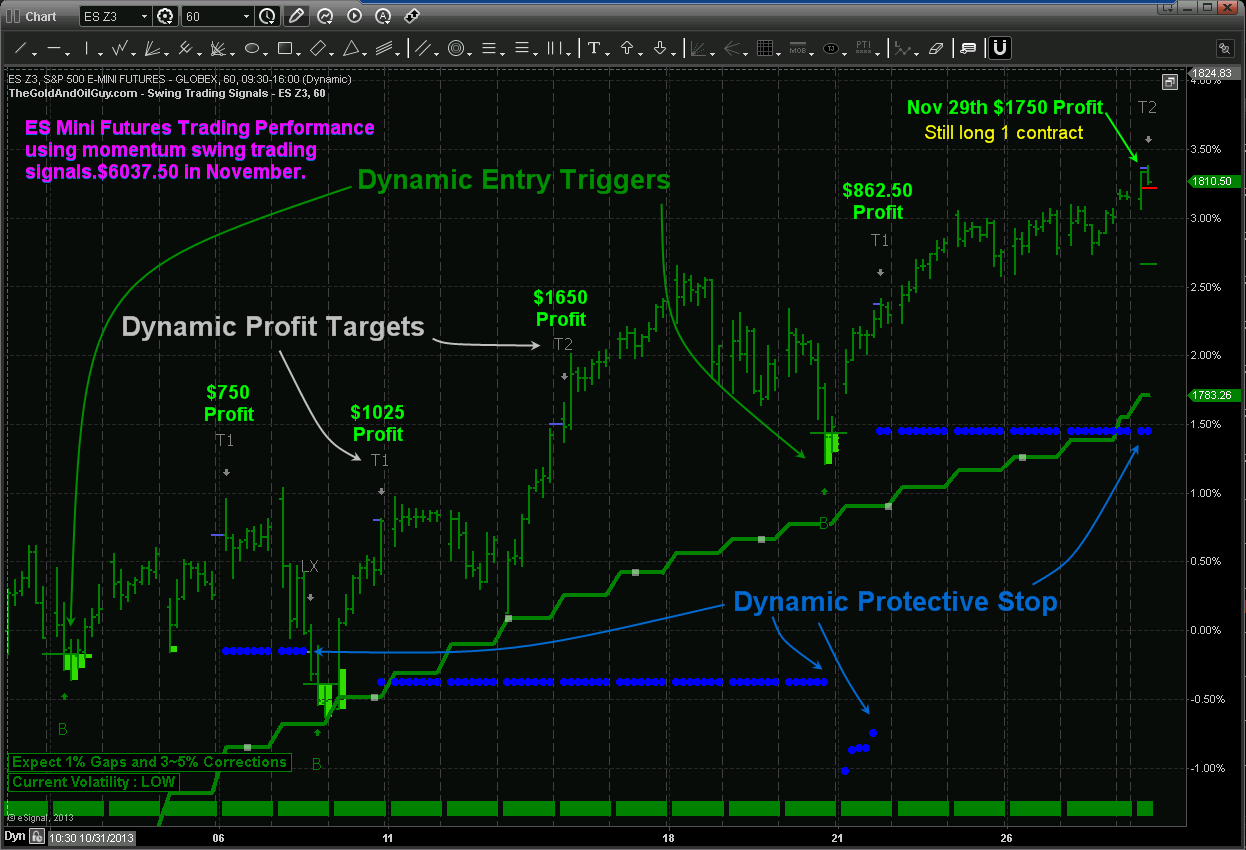
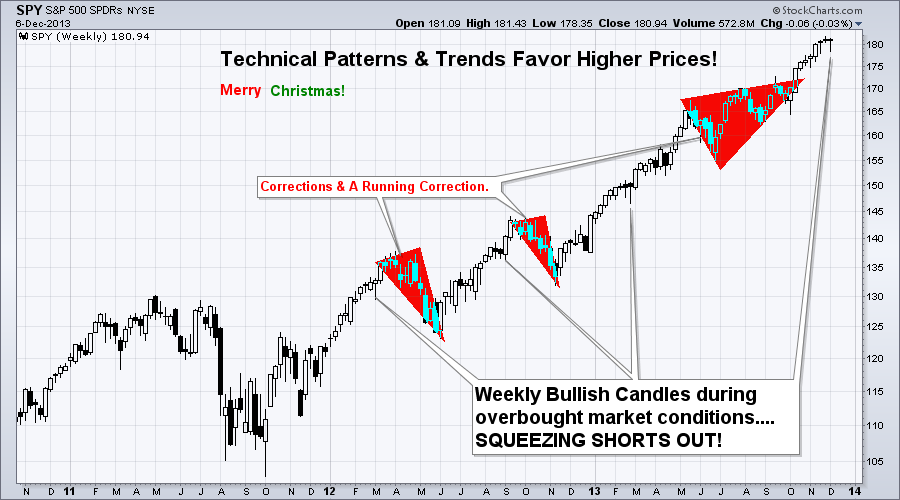
S&P 500 Weekly ETF Trading Strategy – Bullish

The chart below is self-explanatory I think… But let me recap.

The overall trend is up, so your ETF trades should be to the long side buying on the dips. The chart below goes back three years so the candles are a little condensed and small, but what you need to know are these two points:

1. After a correction within a trend, probability says that price is more likely to continue rising than it is to reverse. Notice the market just had a running correction through the summer months.

2. A reversal candle on the weekly chart (bullish reversal candle) generally indicates a 2-3 week rally is likely to happen.

Conclusion: Seasonality says higher prices, weekly chart below shows bullish reversal candle… Oya!

ETF Trader


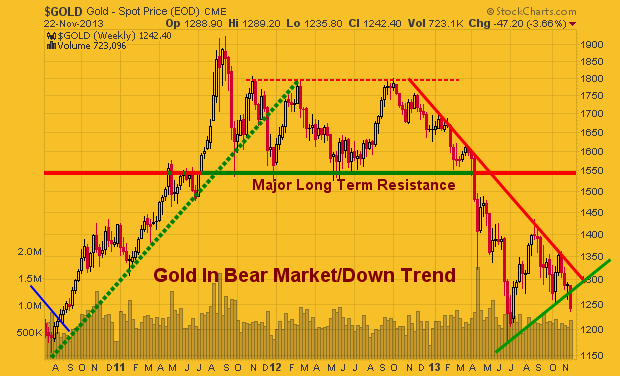
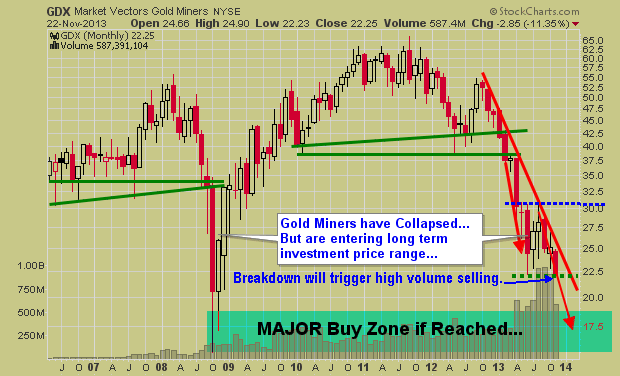
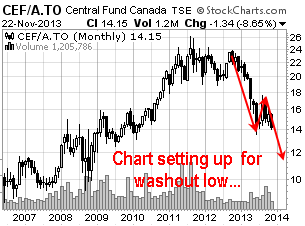
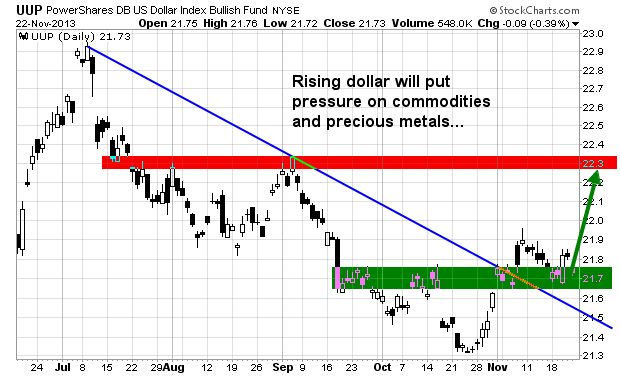
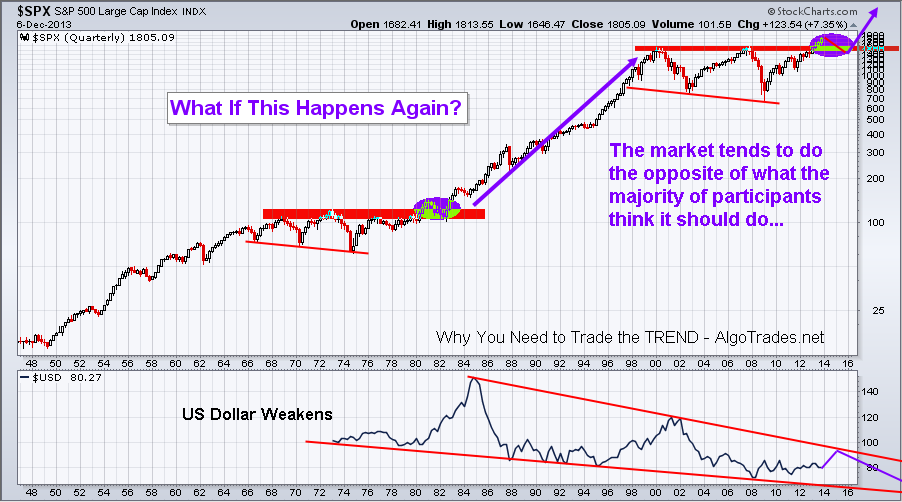
The Bigger Picture: 3 -6 Months Out…

This is a quarterly chart and BIG picture outlook. Over the next 3-6 months we could see the stock market start to become choppy and rollover into a minor bear market for a couple years. That is the best case scenario I think… The other scenario is a major crash back down to the 700-1000 level on the SP500 which would cripple the baby boomer’s from retiring and getting a job would be impossible for almost everyone – full blown recession way worse that what everyone is saying we are in now.

Things are going to be really interesting over the next few years and things for south you better be prepared to make a killing during the next bear market or life will not be fun. The nice thing is that you can take advantage of these moves without ever having to lift a finger with my automated trading system.

ETF Trading Strategies


ETF Trading Strategies Holiday Conclusion:

In short, I think we have a couple good weeks ahead of us. Holiday season, quality family time and a rising stock market paints a nice picture in my mind.

Anyway, I hope this report was helpful and somewhat educational. I always appreciate feedback and things you would like me to write about how I interpret, trade or analyze things. I am here to help and new topics to write about are always welcome!

JOIN MY FREE ETF TRADING NEWSLETTER!

downarrow


Cheers,
Chris Vermeulen
ETF Trading Strategies Newsletter

Algorithmic trading is not something I ever thought I would be doing and it did not really exist 15+ years ago with I started investing. Fast forwarding to today all we seem to hear about is “HFT” high frequency trading, automated, black box trading, and algorithmic trading and how they are making people a boat load of money or almost bankrupting companies overnight like Knight Capital…

Since 2001 I have been sharing my technical analysis, knowledge, and trades with fellow traders online. And over the years through one-on-one coaching, or through financial newsletter it became very clear that emotions and human tendencies will never change when it comes to emotions (fear & greed) along with ones commitment to stick with a plan/strategy without deviating off course no matter how boring or slow it may be.

“The financial industry wants you to think investing is complex,
but the truth is: investing is and must be kept simple
and the best way is through algorithmic trading!”

After five years of personal coaching and newsletter writing for swing and day traders trying to help with their habits, techniques of what I knew worked very well for me, was not something most clients could not succeed at even when they had every step/rule identical to what I was doing to make money. This problem led to me thinking outside the box to figure out why and how I could get others to mimic what I do best so they too could enjoy the freedom and peace of mind knowing they are in control of their life.

Algorithmic Trading Idea Diagram

After several few months communicating with clients, professional traders and educators across the globe and covering many different topics on education I found what I was looking for. The problem lies with us being human. You see, people are very emotional and during heightened times of excitement or fear they tend to react from instinct rather than to follow a set of rules.

People have the tendency to stop doing a task over time that is repetitive in nature, even if it’s making money for them. And it was this conclusion that triggered my thinking to build a system that will trade my strategies using my rules and execute trades automatically without myself or clients having to do anything. This is when my focus on algorithmic trading became my new passion and the driving force of my automatic investing system for individuals.

What is My Simple Automated Algorithmic Trading System?

In short, an algorithmic Trading System is a set of rules and formulas programmed into a trading platform. The algorithmic system places trades automatically according to the sets of rules we create. These rules are built to allow investors to have increased income potential that a properly traded strategy can provide without the need to watch the computer screen all day and manually enter and exit positions when you think the time is correct.

With the use of technology we can now benefit from our strategies by converting them into computer formulas and optimize them for specific investments and make complete automated algorithms. My S&P 500 algorithms were designed and built so I could have more free time while still making the same amount of money if not more and to trade without my emotions getting in the way. This strategy has worked extremely well over the year and I now want to make it available to a select group of individual investors to get the full benefits of what my system provides me with.

Investors BIGGEST Problem and How to Avoid It With Algorithmic Trading

In short, the problem we all have as traders is the fact that we are human. Riddled with bad investing habits, and responding to market fluctuations emotionally rather than logically is why we have trouble making money consistently over the long run.

Here is a recent screen shot of my trading systems intraday algorithmic trading strategy used during an uptrend. Trading the ES mini futures this algorithm pulled $3,425 in two weeks when most traders were getting shaken out of trades. No keep in mind this is one strategy out of the twelve that are traded with my complete algorithmic trading system. Other strategies are based on the various time frames, trends and volatility to be sure we have all types of market fluctuations covered.

Algorithmic Trading Live Example


The rich do what’s hard;
that’s why their life is easy.

The poor do what’s easy;
that’s why their life is hard.

Next I want to show you how to trade like an emotionless robot, how it works, why, what to trade, and how much capital is required to have this algorithmic trading automatically traded in your brokerage account to make a decent living trading the S&P 500 index which is the least volatile and most liquid investment available to traders and investors. A really exciting part about it is that you do not need to learn or installed anything. It is a truly 100% hands free investing system that provides annual results that will make your financial advisor envious!

Stay Tuned For Part II Of How & Why You Should Be Algo Trading…

Chris Vermeulen


When it comes to becoming a successful investor or your, automated trading system development process for that matter, there are some big picture things that you must have figured out. Here are some tips that will help you get started in becoming a long term consistent and profitable trader, investor or automated trading system developer.

Having A Master Plan

I’m not talking about a detailed trading plan, but a plan on what strategy or automated system you want to develop over the next 3-6 months. For example, you might have a goal to develop two trading strategies over the next 6 months. One strategy for uptrends and the other for downtrends.

Making money in both market conditions is crucial for long term success and these two strategies you should be focus. All your strategy development should be focused on reaching these two primary goals.

This master plan does not necessarily need to be detailed. It is simply your reminder to keep you focused and on the right path. You should probably review your master plan on a weekly bases. For more information on why having a master plan and treating trading as a business is important see Brian’s course which I took myself also… Trading As Your Business. 

The Trading System Development Step-By-Step Process 

If you’re like most people you are developing your trading strategies and automated trading systems without following a well-defined process and understand the steps and order things need to be executed for trading system mastery. If this is you, then you need to focus and figure this process out before doing anything else. You are probably missing trading opportunities, wasting time and spinning your wheels wondering why you are not seeing progress. I’m going to give you a recommendation that can really boost your effectiveness as a strategy or automated system developer.

tradingsystemdevelopmentYou must create a process on how you build and test your trading strategy. Your system development process should explain how to test and what to test. It should describe the order and flow of your development process along with check-lists on what types of orders should be used for stops, targets and exits.

Using a documented system development process will provide structure and discipline so you can get your trading system built, tested and making your money in a much shorter period with less frustration.

In short, it will do wonders for your system development process. “Trading System Mastery – by Brian McAboy” is a fantastic starting point on building your own trading strategies and automated trading systems. I took his course a few years ago to help refine my trading goals, rules, and automated trading system blue prints for my programmers. Brian and I now talk weekly and are good friends.

I’m also working on explaining this development process in more detail. When I finish I will send you an update.

Don’t Get Distracted, Have Laser Beam Focus

Distractions and procrastination is a big problem for many of us. We get distracted from what we are doing very easily. Anytime you find yourself starting to wander from your task of building, testing and running your first system, ask yourself if what you are doing is getting you closer to your goal.

Don’t start chasing every new trading idea, concept or indicator you read about, I know… It’s easy to do and exciting but DON’T! Do what I do, make a detailed note with all the thoughts you have on that idea so you know that when you finish with your first system, you can go back, review your notes and look deeper into that idea you had. Trust me, this will do wonders to your progress and mind frame.

There is no better feeling than seeing progress on a trading system and knowing you have 5 -10 other great ideas on paper to work on next… The sky is the limit, but focus on one idea/strategy at a time.

There Is No Get Rich Quick Trading System – Not many…

We all know there is no consistent get rich quick trading system, but there are some that can make you wealthy within a year if the stars align and you are extremely aggressive. What I am referring to are the futures compounding strategies some of the lucky traders were blessed with.

Yes there are some traders out there who actually turned $10K or $50K into $1, $2, or $4,000,000 within a 12 or 18 months. But they are few and far between. This type of trading requires 100% risk capital and you more or less win huge or lose it all, although I am working on a very exciting project now on how to do this with very little downside risk using one of my intraday futures trading systems. I will update on this in a few weeks once I have more solid numbers.

Anyway, back to NOT getting rich quick…

You need to expect the journey to financial freedom to be painful at times but if you follow your proven systems your success can be consistent and that is what is important. You will make mistakes and the markets will humble you at times. There are no free lunches and you will work for a strong return on your investment.

Money Management – Manage it or Lose

Once you have a solid performing trading system, you will need to start learning and testing out the best way to manage positions. This is also known as money management. Doing so can really leverage your system or simply be the difference between it making money or not. I recommend read a book or watching videos on money management on how to scale in and out of positions as that is the key to success I think.

Don’t Wait Until It’s Perfect

Perfection does not exist with any trading system. The financial markets are always evolving and you will have losing streaks and winning streaks. Just make sure the system is working correctly. Test it in simulation mode and start trading it with small amounts of money. You are system will never be perfect and it does not need to be perfect in order to make money.

Do Not Ever Fool Yourself – Fudging the Numbers is a NO NO

Do not attempt to fudge numbers while testing your trading system. Be honest in your backtesting reports and manually review all backtested trades for completeness and accuracy. General rule of thumb… double your commission costs, and factor in 25% slippage. This may sound crazy but you will be amazed at just how accurate these numbers will be with your real-time results with real money.

If your automated trading system does not post gains with commission fees and a 25% slippage, then continue to improve your trading strategies. Set Goals, Reach, Repeat… and nothing less…

Talk soon,
Chris Vermeulen

P.S. Join My Free Ideas & Education Newsletter!

downarrow


My trading partner JW and I had a great talk the other day which spurred to the creation of this interesting and educational gold futures trading article we wanted to share with you.

Throughout most of 2013, gold futures have been under major selling pressure. Gold opened the year trading around $1,675 per ounce. As of the 12/02/13 close, gold futures were trading around $1,220 per ounce which would mean that thus far in 2013, gold futures have lost more than 27% of their value.

Looking back to September of 2011, gold’s all time high came in around $1,923 per ounce. In a little more than 2 years, gold prices have dropped around $700 per ounce representing a total loss of more than 36% based on the 12/02/13 closing price. I would say most analysts would agree that gold has been in a bear market over the past two years.

Before we begin looking at a few ways to use the gold etf GLD option structures to take advantage of higher future prices in the yellow metal, I thought I would focus readers’ attention on some bullish fundamental data for gold. Let us begin with a chart of the Federal Reserve’s Total Assets which is shown below.

Chart1 (4)

The data shown above comes directly from the Federal Reserve’s public database itself. Essentially, this is the Fed’s balance sheet and its obvious that the money printing has gone parabolic. The Federal Reserve prints money to purchase Treasuries and mortgage backed securities which end up on the Federal Reserve’s balance sheet.

Interestingly enough, the chart above illustrates the amount of money the Federal Reserve has been printing since the beginning of 2011. The chart below illustrates the price of gold futures during the same period.

Chart2 (3)

Gold futures have moved lower in price while the Federal Reserve has printed an unprecedented amount of money through the quantitative easing program. It has been pointed out that the flow of liquidity is more important than the total money stock, but these two charts when viewed together are rather odd at the very least. However, we must all continue to remind ourselves that there is no manipulation of any kind going on . . .

Another odd situation has developed regarding the gold miners and the price of gold relative to production costs. The gold spot price has essentially moved down below the average 2013 cash cost of $1,250 – $1,300 per ounce. Price action in gold futures is rapidly approaching the marginal cost to produce gold which is around $1,125. The chart of the various gold production costs is shown below.

Chart3 (1)
Chart Courtesy of zerohedge.com

Gold prices closed on 12/02/2013 at $1,218 per ounce. Based on the closing price, gold futures are less than $100 per ounce away from the marginal cost to produce gold. If the yellow metal’s price moves below the cash and marginal cost of production gold mining volumes world wide will begin to decline.

The gold miners have likely already started lowering their production levels at current prices. The production slow down would only accelerate should prices move down below the marginal cost of production. I believe that these production costs will help put a floor underneath gold prices in the longer-term.

It is widely known that there is strong current demand for physical gold coming from Russia, India, and China. If the gold miners began to slow production levels considerably it is likely that physical gold prices could explode to the upside.

Should production levels decline while demand remains at the same level all of the manipulation in the world could not stop gold prices from arriving at their natural market based price. I think most readers and analysts would agree that the natural market based price is higher, not lower from the marginal and cash costs of production.

As many readers know, my primary focus as a trader is in the world of options where I focus primarily on implied volatility and probabilities to formulate new positions. Unfortunately options on gold futures are fairly limited and are not actively traded. However, the options on the gold ETF GLD are very liquid.

With the longer term fundamentals intact, I thought I would post a few possible trading ideas using GLD options to get long GLD while giving the trader some duration to allow for the time needed for the trade to work.

A fairly cheap way to construct a longer-term bullish position in GLD would be to look at a June 2014 Call Debit Spread or a June 2014 Broken-Wing Call Butterfly Spread.

These trade structures use multi-legged constructions and would essentially allow traders to get long GLD.

Due to the inherent leverage built into options, these positions would not require near as much capital as buying an equity stake in GLD or being long gold futures. The trade structures mentioned above would also mitigate Theta risk, also known as time decay so the passage of time would not have a significant impact on the trade’s overall profitability.

In fact, both of these trade structures would actually benefit from the passage of time in terms of profitability down the road. There are a variety of other trade structures that could be used to benefit from higher prices in GLD while simultaneously capitalizing on the passage of time as a profitability engine. Each trade construction carries a variety of different potential risks as well as required capital outlay or margin encumbrance.

I want to be clear in stating that these trade structures are purely for educational purposes and should not be considered a solicitation or investment advice. Whether we are discussing gold futures, GLD, or GLD options these are all paper investments and they should not be viewed as a substitute for physical gold holdings. Physical gold would likely benefit the most from any supply shock in the future.

In closing, I believe that the fundamental picture for gold is improving by the day. While more downside is likely in the near-term, the longer-term picture for higher gold prices in 2014 and beyond seems quite likely.

In a world where central banks are printing fiat currency at record rates, at some point in the future physical gold prices will no longer be able to be held back from true price discovery.

To learn more about probability based option trading, consider becoming a member of www.OptionsTradingSignals.com for a totally different view of the markets and how to trade options for consistent profitability over the longer-term.

By: JW Jones & Chris Vermeulen


This material should not be considered investment advice. J.W. Jones is not a registered investment advisor. Under no circumstances should any content from this article or the OptionsTradingSignals.com website be used or interpreted as a recommendation to buy or sell any type of security or commodity contract. This material is not a solicitation for a trading approach to financial markets. Any investment decisions must in all cases be made by the reader or by his or her registered investment advisor. This information is for educational purposes only. 

Good Morning,

I just want to touch on two things… the market and my new charting with NinjaTrader

Today’s video covers the SP500 in a little more detail along with natural gas and precious metals.

It is a big day for the financial sector (banking stocks) and if they turn around and rally expect the SP500 to post some solid gains.

Precious metals may keep selling off. Trend is still firmly down.

Natural Gas is looking lofty… I am starting to drool over a short play or inverse ETF play for that. I am keeping my eye on it.

Financials are on fire this morning, they did gap lower but have posted some big gains this morning. Anyone who got long in the past three days with me should be at breakeven or in the money now. Let’s hop this is a key pivot low and prices rally/grind higher into the holiday season/year end.

Below is a daily chart of the SP500 index using the NinjaTrader platform. Over the last few months as you likely know, we have been completing our fully automated SP500 trading system so that it will be available to our followers. Over the next month we will be phasing all our charting analysis, tools, indicators and systems to run on the NinjaTrader platform. Reason? because NinjaTrader Rocks! and supports all our custom indicators and automated trading systems much better than what we are using now.

Anyways, back to the chart below… As you can see there is potential for the SP500 to pullback several percentage points. As long as it stays above our blue support line and short term high volume zone we will remain long the market adding on dips.

NinjaTrader Platform for Automated Trading Systems & Charting

Talk soon,

Chris Vermeulen
NinjaTrader Partner


If you are a paid stockcharts.com user be sure to FOLLOW and VOTE here: https://stockcharts.com/public/1992897/

Follow My Stock & ETF Charts FREE Here: https://stockcharts.com/public/1992897/

Chris Vermeulen

How to turn your trading into a simple automated trading strategy: you know the difference among a winning and losing trade – we have all experienced both and know the excitement and the frustration associated with it.

The brutal honest truth is a tough pill to swallow. The fact that most of the time it’s not the strategy that has failed; it’s you (the trader) which is why you need a simple trading strategy drawn out on paper with detailed rules for you to follow.

In today’s report I am going to talk about how you can stop losing money and become a successful trader. We all know that before you even enter a position, you must know where you place your stop-loss order. If you don’t know where you stops are to be placed then you are trading with a major disadvantage.

Your position entry is not complete without having a stop price figured out. It blows my mind why so few investors use stop-losses. If you are guilty of not using stops, you need this information. It might be the difference between retiring on time with a big nest egg or retiring later and still just churning your account.

If you plan and place stops you are planning to win, but prepare to take losses because you will get stopped out and you will have to get back up, brush yourself off and trade another day. So with that said we need to look at the psychology around taking losses because it’s not easy to manage, and is the main reason individuals do not use stops. Being proved you were wrong flat out SUCKS!

Successful traders understand they must know where they are going to be stopped out before they enter a position. They have to know ahead of time what a wrong trade looks like so they can exit it quickly. This is a rudimentary fundamental that EVERY trader knows the answer for.

Do You Have A Trading Strategy That You Can Trade Like a Robot?

Can You Answer The Following Questions?

1. How do you know when to sit tight or cut your losses?

2. Do you have rules to tell you when to sell a losing position?

3. Do you have rules of when to move your stop to breakeven?

If you cannot answer these questions properly, you are not alone. And what it means is that you need to establish some rules for yourself. All the trading rules in the world are meaningless if you do not use them. That is why I am telling about what’s really going on with you when you refuse to manage your risk in a proactive and professional way.


Most traders refuse to take a loss for two basic reasons:

1. They cannot admit they are wrong.

For most traders, this is just too painful to admit. It’s interpreted as failure or feeds a persistent, negative self-image which none of us enjoy feeling.

Humans by nature prefer to remain in denial instead of acknowledging their losses are causing them pain. This type of trader often has to lose it all before he begins to change (or gives up trading). I know this very well. I lost it all twice when learning to trade. It was not until the second time that I hit rock bottom (financially and emotionally) that I embraced trading rules and hired a mentor to help keep me inline with my trades.

2. The loss is too big relative to their overall portfolio size so they can’t afford take the loss. 

Know this, there’s no such thing as just a paper loss. The investment (stocks, etf, options or futures contract) is worth what it’s quoted whether you realize it or not by closing the position.

Both of these examples are a form of self-delusion that millions of investors, both large and small, suffer from.

If what I am saying here is making you uncomfortable or bringing up feelings of anger or powerlessness, then that is a good sign. It means you have enough common sense and self-awareness to change what you are doing.

Example of How You Can Make Your Trading Strategy To Be More Automated:

TGAOG

A successful trader uses a different strategy from that of a losing trader (you) by looking at the pain from the loss in an impersonal way. They know the loss as a sign that something went wrong with their approach, or their execution, but NOT that something is wrong with them.

Winning traders separate who they are from what they do. They learn and know, that their trading losses lie in their approach to trading the market and not a reflection of whom they are as a person. The pain they feel is quickly transmuted into motivation, which fuels their desire and determination to become a better trader through refining their trading strategies to better navigate the financial market place.

Both are learned responses and within your control. The opportunity for growth from the pain of our losses are the same. It’s what we do with this emotional pain of a loss that matters, not the loss itself.

Stick with my proven Simple Automated Trading System
Make winning a habit.


Learn About AlgoTrades & Get Free Monthly Investor Reports

See How My System Crushed The S&P 500 By 14.35%
In November With A 100% Success
Rate On Its Trades.


“Make 2014 the year to remember with some extra
trades from my new index trading system!”
 

Despite the insanity of recent market rally and overseas financial issues, my followers and I are enjoying continued success with my TheGoldAndOilGuy program. Those who trade futures could be earning a robust 82% average annual return in 2014 with the new implementation of my automated trading systems for the SP500 index.

Are you making money as the market continues to make new highs? If not, then you are likely trading from the gut and have a bias as to which way you want the market to move instead of following the major trends at play. November has been another highly profitable month for the system and subscribers pocketed more profits yet again today on our SP500 trade. 
 
AWESOME CHART/RESULTS FOR NOVEMBER: Based on $50K Account

Automated Trading Systems

TGAOG
If you’re ready to discover how to trade successfully in the shortest time possible, Then you need to get in on this special one-time deal being offered today…

LOOK AT WHAT SUBSCRIBERS SAYING!
 

Dude you are so awesome. Learning so much. Can’t thank you enough for the education and guidance you provide. -Luke Connel 


Hi Chris,
Thanks for the tip. I just sold the 10 weekly calls purchased shortly after you called this SDS play for .50 cents – they hit 1.01 yesterday while I had an appointment – today I sold for .94 – risked $500 made $440. Appreciate your updates and high profit trades! Regards, – Jim Thompson, North Caolina

Fantastic advise……..I’ve never seen anybody give the advise on time based on current market movements consistently like this.Great work Chris and please keep it up! Cheers !! – Michael I., Toronto, Canada

Hi Chirs,

I just wanted to say thanks for putting out the Morning Pre-Market Wrap Up videos.

Personally, I am so addicted to your morning videos that I feel like my morning pre-market routine is not complete until I view it. You have helped me progress in my market knowledge and trading so much I can’t imagine not having that resource each day.

If you ever putting out an educational DVD set containing all of your market knowledge, and maybe sharing how you obtained your trading skills. I for one would be very interested in getting it.

Thanks again for all you do, and the service just keeps getting better and better!
Sincerely, – Doug Givens


Hi Chris, I really admire your discipline, which in turn is helping develop mine – I am more than happy to sit on the sidelines and wait for the more probable setups, which inevitably come.
Keep up the stellar work..! Cheers, – Bry

Chris,
I like the way you keep us out of dangerous markets and prepare us for an upcoming, low risk, tradable trend. Glad you do not buckle under pressure from subscribers to make a fast but dangerous buck.
I am learning a lot about how to trade with you and appreciate the time you take to educate us. The last video about the oil futures market was eye-opening. Take care, – Lars


If you give me some time to prove myself in 2014 you should not only make money but learn to trade at the same time. 

If you think my automated trading system is just another internet marketing trading scam, I applaud your skepticism.

I come from a world where only results backed by cold, hard numbers have value, NOT empty words and hollow promises. So there’s no need for me to forgive you if you think my system which I have traded since 2006 and is automated to alert you only when the highest probability trades are available, is too good to be true.

In this day and age, you SHOULD be skeptical. But the results for my system have been explosive and it continues to outperform the SP500 index.

Basically, it’s beat the vast majority of hedge funds, pro-traders and money-managers!

Join today and get ready to make 2014 the most exciting year for trading yet.

TheGoldAndOilGuy newsletter will now incorporate some of this automated trading systems trades so we can benefit even more from the market.

 
Warning: There is a risk of loss in trading. It is the nature of commodity and securities trading that where there is the opportunity for profit, there is also the risk of loss. Securities trading involves a certain degree of risk, and may not be suitable for all investors. Derivative transactions, including futures and forex, are complex and carry the risk of substantial losses. Past performance is not necessarily indicative of future results. It is important you understand all the risks involved with trading, and you should only trade with risk capital. This information is for educational purposes only.

Precious Metals ETF Trading: It’s been a week since my last gold & silver report which I took a lot of heat because of my bearish outlook. Friday’s closing price has this sector trading precariously close to a major sell off if it’s not already started.

On a percentage bases I feel precious metals mining stocks as whole will be selling at a sharp discount in another week or three. ETF funds like the GDX, GDXJ and SIL have the most downside potential. The amount of emails I received from followers of those who have been buying more precious metals and gold stocks as price continues to fall was mind blowing.

If precious metals continue to fall on Monday and Tuesday of this week selling volume should spike as protective stops will be getting run and the individuals who are underwater with a large percentage of their portfolio in the precious metals sector could start getting margin calls and cause another washout, spike low similar to what we saw in 2008.

ETF Trading Charts:

Below are updated with Friday’s closing prices showing technical breakdowns across the board..

ETF Trading Strategies ETF Trades ETF Trade


Sweet & Sour ETF Trading Analysis:

Just to make things a little more interesting I would like to point out a couple other types of analysis.

cefSweet:  Through analysis of the CEF Central Fund of Canada Ltd. chart and evaluation it is clear precious metals are falling out of favor at an increased rate. This fund owns physical gold and silver bullion and investors are fleeing the fund so fast that it is now trading at a 7% discount of its asset value. While this may not seem good for metals I see it as a positive.

When everyone is running for one door after an extended moves has already taken place it tends to act as a contrarian indicator. Knowing that some of the largest percent moves in a trend takes place before reversing, I see this information as an early warning that a bottom will soon be put in place.


Sour: While the USD index has not been much help compared to 2012, I feel as though a rising dollar is likely to unfold for a couple weeks which may lend a hand to pulling the precious metals sector down.

ETF Trading Chart


Precious Metals ETF Trading Conclusion:

While I am starting to get bullish for a long term investment in precious metals I know that a bottom has likely not yet been made. But even if it has been, it is better to buy during a basing pattern or breakout to the upside from a basing pattern than to be underwater with a position for an extended period of time along with all the other negatives that come along with it.

I do like the idea of CEF as a long term investment when I feel the time is right. I have invested and traded it many times in the past. The key to trading the fund is to be sure you are buying it at fair value or a discount from the net asset value. You do not want to be buying it when it is trading at a 5-7% premium. The fund owns both gold and silver making it a simple diversified precious metals play.

Get More Free ETF Trading Ideas & Analysis at: www.GoldAndOilGuy.com

Chris Vermeulen


Pre Algorithmic Trading System Analysis: This week has been a little wild as stocks pulled back due to headline news. The two big drops which took place on heavy volume sent market participants into an emotional state liquidating their long positions on fear of a collapse. Even though the stock market shows no sign of the trend reversing down, traders are jumpy and quick to lock in gains with any negative new. Sounds like a “Wall Of Worry” to me.

Taking a look at the ES mini futures chart below which is a ten minute intraday chart. It is clear the recent pop in price is testing high volume resistance as seen on the chart with the blue horizontal bars.

Also the previous pivot highs and consolidations on the chart highlighted in red also confirms there is price resistance at this level. Thursday’s rally is likely ready for a little pullback or sideways consolidation at this point based on this information.

Algorithmic Trading Price Chart


If we take a look at the Barchart Market Momentum index which is something I follow closely because it tells me when stocks have moved to far too fast in either direction. In simple terms, the market is either overbought or oversold when this chart reaches either extreme.

When the market closes with this indicator in the overbought or oversold zone, you should expect a pause or 1-3 day reversal in the opposite direction.

But keep in mind, when the trend is up, the only high probability zone to focus on is the oversold. We want to buy dips within an uptrend, and take partial profits or tighten our stops when the stock market is over extended to the upside. This is exactly what members and myself did today, locked in some profits and tightened our stops, well my Algorithmic Trading System told us to do it…

Momentum of Algorithm Trading

Logical Market Analysis Combined with Automated Algorithmic Trading System

Reviewing the charts for high volume resistance levels, previous pivot highs and lows, and a close eye on the Barchart momentum index like we just did in this report is only the tip of the iceberg when it comes to complete market analysis.

There are many other things one should analyze for precision market timing of the broad market. The stock market has several different forces at play which move price and using a type of analysis which I call INNER-Market Analysis allows us to capture all the market moving forces within one indicator. This February when my book is published on INNER-Market Analysis and algorithmic trading systems all this information will be available if you would like to learn more.

Some other areas of the market which must be analyzed are trends, active cycles, volatility, volume flows, and market sentiment to name a few.

Over the years I have been converting the way I analyze the market into an algorithmic trading system that catches each overbought and oversold market condition on specific chart timeframes. I have also implemented position and money management rules for the algorithm to trade in my brokerage account completely hands free which I must admit is the coolest feeling thing to experience.

What is an algorithmic trading system?
Trading Algorithms Flow ChartA trading algorithm is nothing more than a bunch of rules which you create (your trading strategy) converted into a computer language so a financial charting platform can run your trading strategy automatically. Everything is done for you including the trading. The only thing the system creator needs to do is monitor the algorithmic trading system for technical issues and possible tweaks here and there.

Take a look at the 30 minute algorithmic trading results

Since Oct 30th the S&P500 index has been chopping around and shaking traders out of their long and short positions with intraday price whipsaws (nominal new highs and lows which runs the stops of the average market participant). The index is only risen by 1.2% in the last 23 days while my algorithmic trading system which trades the S&P 500 index futures (ES Mini) and/or (3x Leveraged ETFs UPRO & SPXU) has been pulling money out of the market at an incredible rate.

Algorithmic Trading System

Remember these trades in the example chart above are just two types for algorithms trading within my system. There are 12 algo trading strategies covering all market conditions automatically managed in one complete solution.


Conclusion About Using an Algorithmic Trading System:

Trading or investing for that matter is no easy task. And I know firsthand that even if one has a proven winning strategy it’s almost impossible follow the rules and catch every trade setup generated. I do not know how many times I see perfect setups about to unfold and then miss them because I was reviewing other charts, sending an email, going to the washroom or grabbing a bite to eat.

These missed opportunities along with a few other reasons I will explain in my next post, is what got me started programming my trading strategies to do exactly what I showed you here.

I will admit, it has been a major learning process, ridiculously expensive to create and I can safely say that I now know several of the main stream programmers available. I also know who can make miracles happen and who cannot.

This post is to share with you some new and exciting things unfolding based around my index trading strategy. Over the next week I will share my story of how algorithmic trading became my focus, passion and automated income stream and how you can do it also.

Chris Vermeulen