Since we started sharing the new and improved algorithmic trading systems (S10 and D30) a few weeks ago we have received a lot of great feedback and demand.
We do have more good and some not so good news…
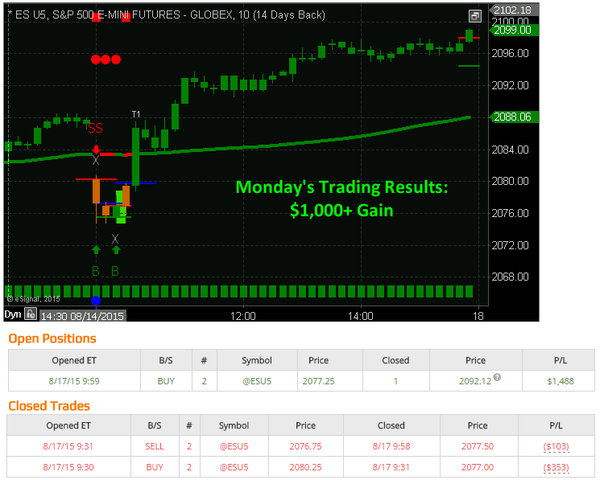
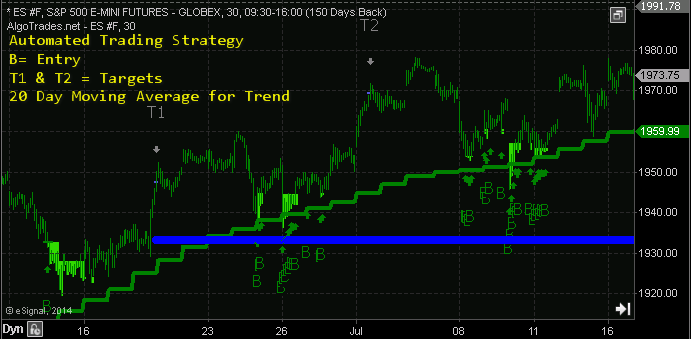
The good news is that the system kick started the week once again with positive trading results within the first hour of the week. The index opened lower and it caused the market the flip and flop a little between and up and down trend. But once the intraday trend took hold the systems both reached their T1 (first target) less than an hour after the opening bell to lock in $400 profit. The systems are still long 1 contract and deep in the money as you can see below.
Also, one of our improvements to the systems was our improved Risk Containment and Equity Protection features. This improvement will be explain in more detail in another email/video but in short this reduces the amount of potential gain we give back when the market rolls over and starts moving against our second contract. For example in the past we would see our positions up $800 – $1500 but when the trade was closed we only realized $150 – $400. The improved systems now lock in more profits $450 – $950 in these similar trade situations.
Now for the Not So Good News. To be honest this news isn’t all that bad but we want to be sure you know what is going on. In the past week the emails and phone calls have been rolling in faster than we can take them. The list of phone messages we need to listen to and call traders back is crazy long.
The solution, I know many of you want to speak with us before subscribing and want to join before the 30 day pre-live trading special offer is gone forever so this is what you should do and expect:
Emails are the best and quickest way for us to respond, but if you would like to speak with someone PLEASE leave a phone message and we will return your call within a day or two.
These new and improved systems will be going live for users on Sept 1st (TEN DAYS). Fastest way to get setup is to subscribe now to reserve your seat and take advantage of the special offer, then visit our broker’s page and click on a link to open a trading account and get it funded. We have direct broker support phone numbers to help you fast track the process: Open Account: http://www.algotrades.net/automated-trading-systems/
Hope you had a great weekend!
Talk soon
Chris Vermeulen
https://thegoldandoilguy.com/wp-content/uploads/2014/03/good-etf-newsletter.png388488adminhttp://www.thegoldandoilguy.com/wp-content/uploads/2014/11/tgaoglogo.pngadmin2015-08-18 17:20:442015-08-18 17:20:44Some good news and not so good news…
The S&P 500 stock market has been under strong rotation since mid-2014. Rotation in the stock market is when the trend changes direction from an uptrend to a downtrend or vice versa. But the really exciting part is that after strong rotations in the market similar to what we are experiencing now, the stock market always makes massive moves to profit from shortly after.
Depending how the price moves during market rotations individual traders, CTAs, hendgefunds and even algorithmic trading systems can generate large profits. But price action must be favorable to meet every ones risk/reward rules.
Unfortunately during the second half of 2014 the stock market rotation moved in a way that did not generate many trades. But no trades are better than losing trades so it’s not the end of the world, and the good news is there will always be more trades.
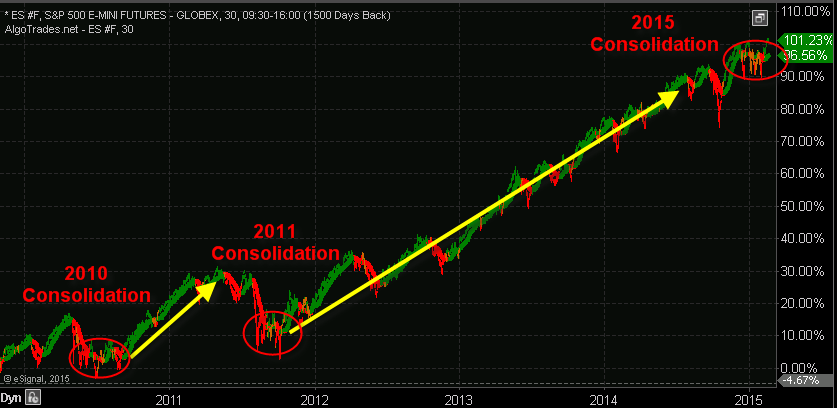
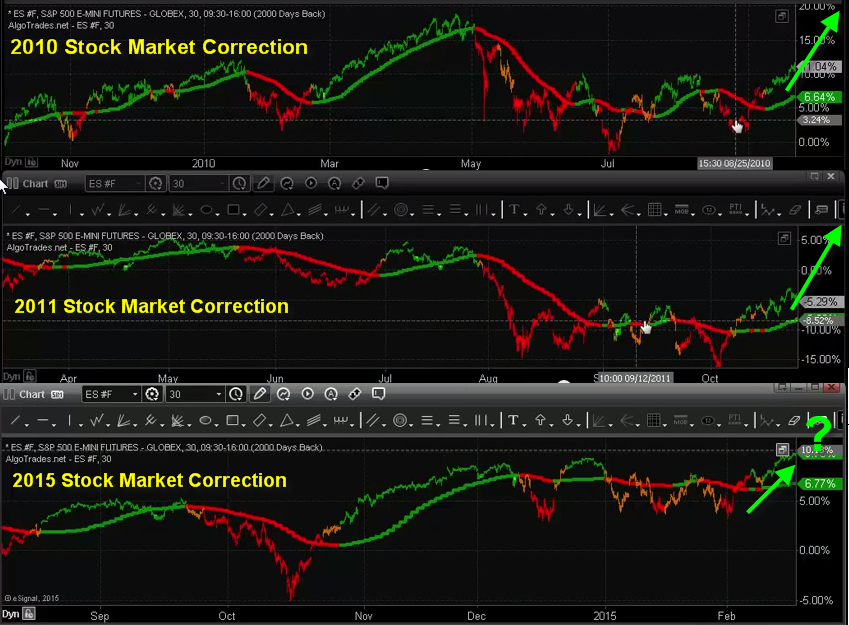
But what I want to show you here is how the current price action of the stock market we are experiencing is identical to what we saw in 2010 and again in 2011. Also keep in mind that if equities are going to have a another big move it will generate other opportunities in precious metals, energy sector, and commodities. ETF’s are what I use to take advantage of these large moves with my ETF trading newsletter.
2015 is going to be a BIG year for traders
and algorithmic trading systems!
These consolidations (pauses) in the stock market have led to substantial rallies in the stock market of 30+% gains over a six-month period and its looks like it will happen again.
My algorithmic trading system has struggled during the strong rotation of recent but so have most CTA’s and other money managers. There is not doubt that it has been hard to profit with these swings in the market because of how they formed.
When this phase of the market completes and a new trend emerges traders and algorithmic trading systems will excel and be highly active again just like they were in the first half of 2014.
https://thegoldandoilguy.com/wp-content/uploads/2015/02/corrections.png625849adminhttp://www.thegoldandoilguy.com/wp-content/uploads/2014/11/tgaoglogo.pngadmin2015-02-18 20:55:512015-02-19 18:24:452015 Stock Market Forecast And Your Trading Plan
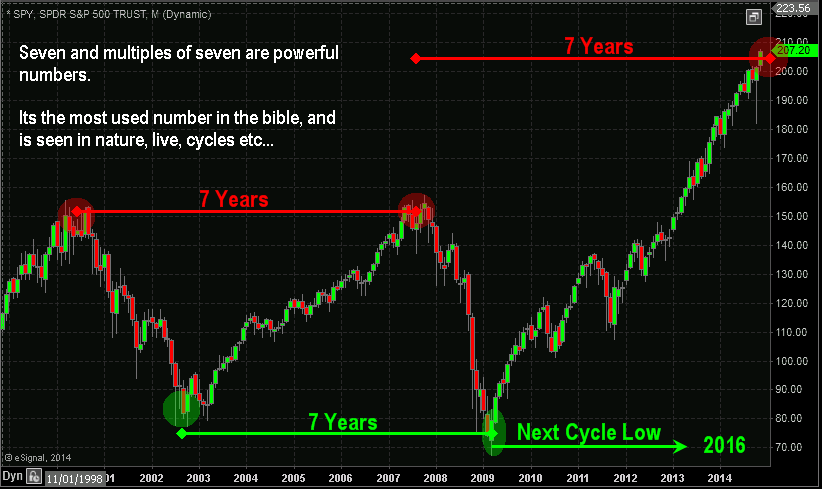
Investors and traders around the world continually search to find or increase their edge in the financial markets to boost profits. The next few months are going to be critical for investors because the number seven is now in play for the stock market.
What does this mean?
In magical lore seven is a magical number., While all numbers are ascribed certain properties and energies, seven is a number of power, a lucky number, a number of psychic and mystical powers, of secrecy and the search for truth.
Seven is used 735 times in the bible and if you total up all words including “sevenfold” and “seventh” there is a total of 860 references.
The origin of seven’s power lies in the lunar cycle. The moon has four phases lasts about seven days. The Sumerians gave the week seven days. Life cycles on earth also have phases demarcated by seven, and there are seven years to each stage of human growth, seven colors to the rainbow, seven notes in the musical scale, seven petitions in the Lord’s Prayer, and seven deadly sins.
More importantly for investors the number seven and multiples of seven have a powerful influence on money. The US stock market is now trading in the seventh year window and it should not be taken lightly.
While I could go into a lot more detail about how I use seven in my algorithmic trading strategy to swing trade the S&P 500 index. This article focuses on the investing outlook.
I am fortunate enough that I have been trading since 1997 and have seen the how the stock market cycles affect human behavior and businesses specifically the financial newsletter industry which I have been involved in since the first day my trading career.
The stock market appears to be nearing a critical turning point that will change the lives and behaviors of investors for years to come.
The good news is that I have experienced four of these turning points and human behavior shifts in my career before and we currently entering the fifth turning point. I feel obligated to share this valuable insight with those of you who read my work. The next major market move could have a dramatic impact on your wealth and retirement years.
Insight on Investor Behavior and Business
Being heavily involved in the financial newsletter industry I have not only seen but survived several of these major cycles which forced many newsletters to go out of business. The cycles at play here are the market trend and the behavior of traders and investors.
The combined forces of these two cycles are what cleanse the newsletter industry of poor quality services. It becomes almost impossible to obtain new clients without word of mouth/referrals from happy users and if the quality of the newsletter is poor, eventually they lack enough users to make it feasible to operate. Unfortunately it’s the brutal truth, and over the last couple years I am seeing newsletters and even to top trading magazines that have been around for decades closing their doors.
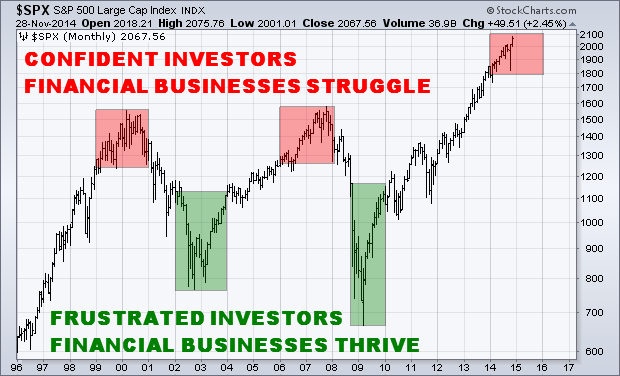
The business cycle can easily be explained by observing the chart below of the SP500 index. In short, when the stock market has been rising for six or more months investors start to become confident in that they can make money on their own. And in fact they can if they buy and hold during a bull market.
But what happens as the market continues to rise for many years is that more and more investors and traders realize they can make money on their own. The longer the uptrend remains intact the less will need the help of a trading and investing newsletter making it difficult to get new customers in this highly competitive industry.
Currently investors are behaving almost identical to what I saw during 1999 – 2001, from 2006 – 2007, and now 2014 – 2015 market tops.
Did you notice anything with those market tops? They are 7 years apart…
Let’s now take a look at the best times in the business cycle where traders and investors are in desperate need of help and start subscribing to multiple paid financial newsletter services. The strongest times for business took place during 2002 – 2003, and again in 2008 – 2010. This is when investor not only lost most of their wealth, but their faith in how they invest, who they invest with, and the stock market as a whole.
Did you notice any there also? They are 7 years apart also…
Investors 7 Year Financial Outlook
Those of you who follow me know that I do not pick market tops or bottoms. Rather I focus on identifying trends and cycles in the market and only trade and invest with the active confirmed trend.
You also know that trying to pick market tops and bottoms is a suckers game and a sure fire way to lose a lot of money and build a serious complex that the market is manipulated, not tradable, and that it may be time for you to give up on trading all together.
Well, I am here to say that the market is tradable, and can generate traders and investors a boat load of money once you understand how and why it moves. Most importantly you need to understand money/position management and be patient for consistent long term gains.
Take a look at the chart below for a clear visual of 7 year cycle highs and lows at play.
While I do not invest based on this major seven year cycle I do actively trade a smaller market cycle which provides roughly 35 – 65 trades per year. This strategy allows me to profit during these major bull markets and also during the multi-year bear markets when the majority of investors are losing boat loads of their hard earned money.
The reason I do not invest in the seven year cycle is because the market can still have 30+% price swings within bull and bear markets and that type of volatility is beyond what I am comfortable with. Also because I can actively invest with my automated trading system so I don’t need to lift a finger or watch the stock market each day, week or month.
I hope you found this report useful in some way, and I ask that you share it with others.
https://thegoldandoilguy.com/wp-content/uploads/2014/11/seven1.png230349adminhttp://www.thegoldandoilguy.com/wp-content/uploads/2014/11/tgaoglogo.pngadmin2014-11-29 19:09:382015-06-01 16:14:32Investors That Do Not Understand The Power Of Seven Will Lose Money in 2015
LOOKING FOR AN ALGORITHMIC TRADING SYSTEM THAT DOES ALL THE WORK FOR YOU IN CANADA?
Algorithmic Trading Canada
If you are an investor or trader who lives or works in within Canada and you are interested in algorithmic trading Canada, automatic investing Canada, and automated trading Canada, then look no further. AlgoTrades Systems is a Canadian company located in Ontario, just north of Toronto.
If you live in one of these Canadian provinces you can use their algorithmic trading system: Ontario, Quebec, Alberta, Nova Scotia, Saskatchewan, Manitoba, New Brunswick, Newfoundland and Labrador, Prince Edward Island (PEI), and even the North West Territories, and Nunavut.
Unfortunately if you are interested in algorithmic trading and live in British Columbia, you are out of luck. British Columbia is the only location in the world that does not allow algorithmic trading (automated trading systems) for their residents. So much for a free country…
Research shows that the United States (USA) is number one for people searching algorithmic trading systems, with India being second, and Canada third. I was blown away that Canada was #3 for algorithmic trading.
ALGOTRADES ALLOWS YOU TO FREE YOURSELF – WE DO THE HEAVY LIFTING FOR YOU
Say goodbye to searching for hot stocks, figuring out technical patterns, or even reading market opinions. AlgoTrades does all the searching, timing and investing for you using our advanced algorithmic trading systems.
You only have to hook up your trading account – it is very simple and only takes a few minutes – and then you can finally relax while we let sophisticated algorithms take profits out of the market for you.
The number of algorithmic traders in some of Canada’s largest cities are vast within these top cities: Vancouver, Calgary, Edmonton, Ottawa, Toronto, Montreal, Winnipeg, Hamilton, Kitchener, Camebridge, Waterloo, St. Catharines, Oshawa, Whitby, Carlington, Victoria, Windsor, Saskatoon, Regina, St. Johns, Sherbrooke, Barrie, Kelowna, and Halifax.
http://www.thegoldandoilguy.com/wp-content/uploads/2014/11/tgaoglogo.png00adminhttp://www.thegoldandoilguy.com/wp-content/uploads/2014/11/tgaoglogo.pngadmin2014-08-06 13:55:212014-08-06 13:55:21Algorithmic Trading Canada: Algo Trading Firm Located In Canada
Algorithmic trading which is also known as automated trading has changed the way I trade and invest dramatically. As you know trading is extremely difficult to be consistently profitable in. The #1 reason individuals fail is because they struggle with their emotions and end up trading with the general market sentiment. While the herd mentality/feeling can and most of the time feels like the proper (logical) way to look at the market, trading with the “herd mentality” is the silent killer.
I am going to teach you how to read market sentiment so you can swing trade and profit consistently from emotional traders to earn 1% – 3% per month trading the SP500 index. If you want to make money, you need to trade against the herd (masses) at key support and resistance levels in the market. Plus you should have a robot (algorithmic trading system) execute these trades for you. Because, you need to completely remove your emotions from the game, and because it’s not rocket science to identify key levels where you should be entering and exiting the market with your money.
You start by looking at the market completely backwards. Focus on buying positions during heavy volume sell-offs (panic) and sell your positions during heavy volume rallies (greed). This was a very tough transition for me and I still get nervous and emotional during these times when my system enters and exits positions. This strategy feels completely wrong at the beginning but the profits speak for themselves!
One Of My Algorithmic Trading Strategies
This trading strategy is my favorite because I know the masses are panicking out of positions, sweating, and having heart burn, while my automated trading system is entering a high probability position against them. This analysis may seem basic at first glance, and that is because it is, but when you combine the analysis of each indicator explained below, you end up with a highly effective trading strategy. I took things on step further and converted into an automated trading strategy. This is one of nine automated trading strategies I use.
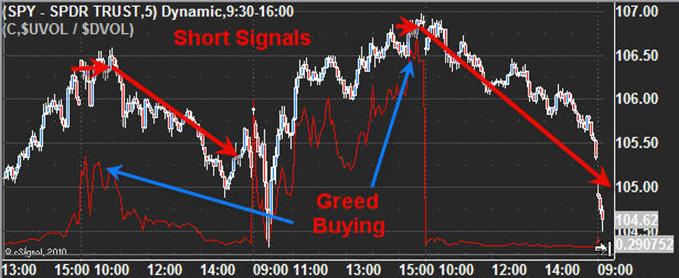
This SP500 chart shows where a high probability short trade should be executed based on the algorithm trading indicator. It is important to know that over the past 6 years the SP500 has provided a 1.25% profit on average each time one of these extreme sentiment readings occur on the charts. While that may not sound like much of a return, know this happens several times each month and better yet, if you trade the ES mini futures, you get a lot more leverage. ES trading turns a 1.25% index gain into roughly a 10% gain based on futures margin requirements for one contract.
Anyways, the red indicator on the chart is a simple volume based indicator which measures fear and greed in the market. It is very accurate at picking market tops and bottoms. And I calculate it by taking the NYSE up volume and dividing it by the down volume. When you see this indicator start to rise it tells us the majority of traders (the herd) are buying (greedy) and we should start looking for a short entry.
Let me show you how to find the trade using the market sentiment…
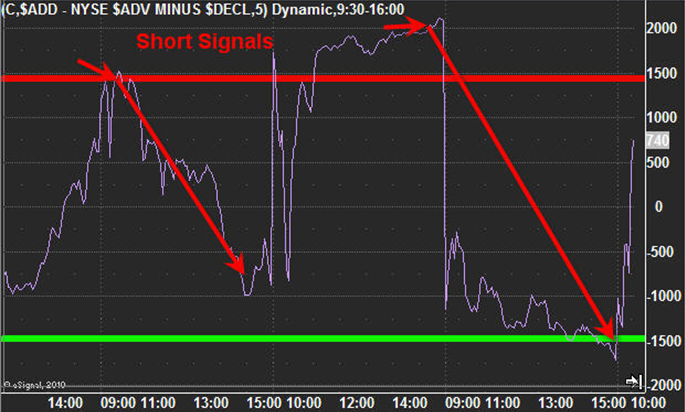
The NYSE advance/ decline line Algorithm Trading Strategy #2
How to use the NYSE advance decline indicator. It’s simple really, when there are 1500+ stocks trading up on the day then the market is getting overbought. Meaning too many stocks have moved up in a short period of time and traders will most likely start taking profits. When the other two indicators talked about in this article are confirming a short sell signal the odds highly favor a selloff in the stock market that should last 1-3 days.
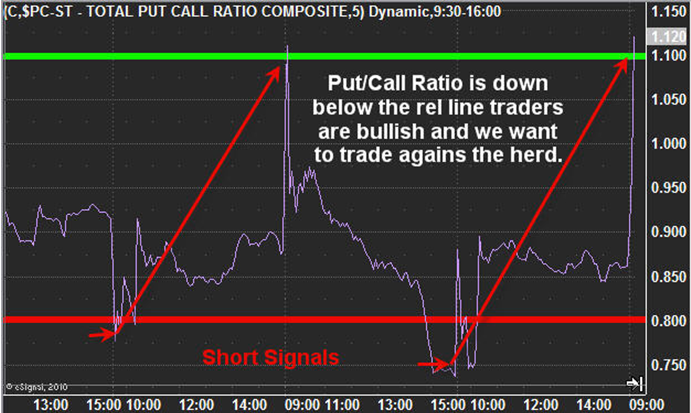
Last algorithmic trading strategy #3 is the put/call ratio
The put call trading algorithm can be a little tougher to use at times because when the market is trending down the ratio tends to fluctuate near the top. It stays near the bottom of the chart when the market is trending up but it is just the extreme spikes we are looking for.
When the broad market bounces and we see the put/call ratio drop into the lower band it’s telling me the majority of traders have finally become bullish. This tends to happen once a previous high is broken as it triggers short covering and breakout traders start to buy within a false rally during a down trending market.
Algorithmic Trading Strategies Conclusion:
If all you do is use these three indicators, focus on the 5 or 10 minute charts, trade only with trend of the daily charts 20 day moving average, and take partial profits at 1%, again at 2%, while keeping a small position open as a trend trade, you will become a more consistent trader and be able to profit from a falling stock market.
My proven algorithmic trading strategy running live but this is in a rising market… $3200 in profits made quickly, with low stress and 100% hands-free, what else can you ask for…?
It is critical that once you take partial profits at a 1% gain, you start moving your protective stop into the money to lock in a profit for the balance of the position. All three indicators need to reach the extreme levels at the same time for a trade to be triggered. Know that I have seen the market continue a trend during extremely oversold market conditions which lasted for months at times. Do not try to bet against the market just because you think its oversold and should not be shorted, just ride the trend for all its worth. Eventually your last trade will lose as the trend reverses, but wait for it, and expect to lose a trade from time to time,
Final thoughts, this strategy works just as well during a bull market. There are some minor changes required on each of the indicators which I will cover in another automated trading strategy article soon, so stay tuned for more logical trading tips.
Have My Bull & Bear Market Strategies Automatically Traded For You: www.AlgoTrades.net
Chris Vermeulen
https://thegoldandoilguy.com/wp-content/uploads/2014/07/algorithmic-trading-strategies-5.jpg207244adminhttp://www.thegoldandoilguy.com/wp-content/uploads/2014/11/tgaoglogo.pngadmin2014-07-23 21:12:122014-07-23 22:14:43Algorithmic Trading Strategies with Market Sentiment
As you likely know I have been working on automating my long term SP500 investing strategy which I call AlgoTrades. I would like to mention that we are taking on new clients to our AlgoTrades automated investing system.
We are very excited to tell you that the doors are currently open for you to become a part of this new way of investing.
To ensure peak performance from our automated trading system and trading results for our clients. We have a limited number of seats available to ensure this. As with any good system, once there are too many clients the profitable edge in the market will no longer exist. As we are trading the system with our own investment capital, we are going to monitor and protect our system.
This system is very exclusive as it can only handle a limited group of clients. Be sure to join today, before we are over subscribed. Reserve your seat to have our system trading a portion of your investment capital.
https://thegoldandoilguy.com/wp-content/uploads/2014/02/images3.jpg5359adminhttp://www.thegoldandoilguy.com/wp-content/uploads/2014/11/tgaoglogo.pngadmin2014-02-27 09:40:042014-03-04 03:18:48AlgoTrades system is now available for automated investing
Recent price action in the stock market has many traders on edge. With the market closing below our key support trend line last week, the market has now technically starting a down trend.
While trend lines are a great tool for identifying a weakening trend and reversals in the market, I do not put a lot of my analysis weighting on them.
Most of my timing and trading is based around what I call INNER-Market Analysis (Market Stages, Cycles, Momentum and Sentiment). Using these data we can diagnose the overall health of the market. Knowing the strength of the market we can then forecast short term trend reversals before they happen with a high degree of accuracy.
In this report I keep things clean and simple using just trend lines. During the last three weeks we have seen the price of stocks pullback. And because 2013 was such a strong year for stocks most participants are expecting a sharp market correction to take place anytime now.
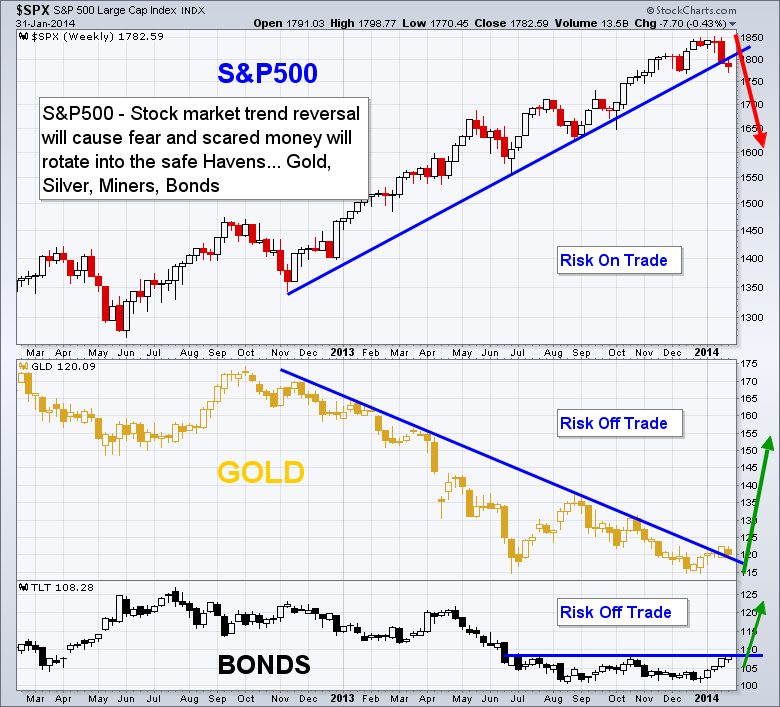
So with the recent price correction fear is starting to enter the market and money is rotating out of stocks and into the Risk-Off assets like gold and bonds.
Stocks tend to fall in times of economic uncertainty or fear. These same factors push investors towards the safety trades (Risk-Off) high quality bonds and precious metals. As more money goes from risk-on to risk-off, stocks will continue to fall and the safety trades will rise. The move by investors to select the safety of gold and bonds compared to the volatility of stocks will result in these risk plays to moving in opposite directions.
Let’s take a look at the chart below for a visual of what looks to be unfolding…
How to Trade These Markets:
While these markets look to be starting to reverse trends, it is critical that we understand how the market moves during reversals and understand position/money management.
Getting short stocks and long precious metals in the long run could work out very well, but if you understand the price action that typically happens during reversals you know that the stock market will become choppy and we could see the recent highs tested or possibly even a new high made before price actually starts a down trend. And the opposite situation for gold and bonds. Drawdowns can be huge when investing and why I don’t just change position directions when the first sign of a trend change shows up on the chart.
Price reversals are a process, not an event. So it is important to follow along using a short term time frame like the daily chart and play the intermediate trends that last 4-12 weeks in length. By doing this, you are trading in the direction of the most active cycle in the stock market and positioned properly as new a trend starts.
What I am looking for in the next week or two:
1. Stocks to trade sideways or drift higher for 3-6 days, then I will be looking to get short. Again, cycle, sentiment, and momentum analysis must remain down for me to short the market. If they turn back up I will remain in cash until a setup for another short or long entry forms.
2. Gold remains in a down trend but is starting to breakout to the upside. I do have concerns with the daily chart patterns for both gold and silver, so next week will be critical for them. We will be using some ETF Trading Strategies to take advantage of these moves.
3. Bond prices (not yields) look to be forming a bottom “W” pattern. They have had a big run in the last few weeks and are now testing resistance. I think a long bond position is slowly starting to unfold but if we look at the futures price charts for both bonds and gold, they have not yet broken to the upside and have more work to do. As mentioned before ETFs are not really the best tool for charting but I show them because they what the masses follow and trade.
https://thegoldandoilguy.com/wp-content/uploads/2014/01/Gold-Stocks.png530700adminhttp://www.thegoldandoilguy.com/wp-content/uploads/2014/11/tgaoglogo.pngadmin2014-02-02 12:24:142014-03-03 13:37:43Is February a Risk-On or Risk-Off Trade: Equities or Gold & Bonds
I apologize now for the Christmas colored charts below… Its a lot of red and green but these are the most understood colors for knowing what ranges means (bullish or bearish).
This was a very emotion week for traders. The strong selling Thursday and Friday has traders and investors running for the door and panicking out of positions. While I did close out our long SP500 swing trading on Thursday to lock in a profitable trade, I do feel as though we can re-enter next week a better price.
The only ones feeling pain today are those who do not have enough self-discipline to create rules and trade by them. Again this is talked about in GREAT DETAIL in my new book. If this is you, I recommend buying my book and reading it this weekend as it’s a quick and simple read. There is a paperback version or instant PDF download available: Get Book.
Without self-discipline no amount of courses are trading services will make you a successful trader.
Let’s get technical and jump into the charts…
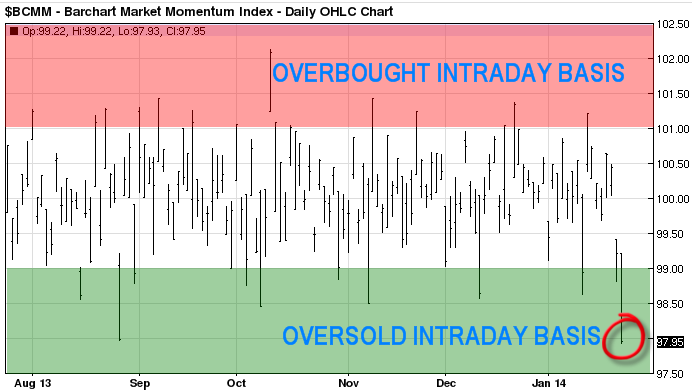
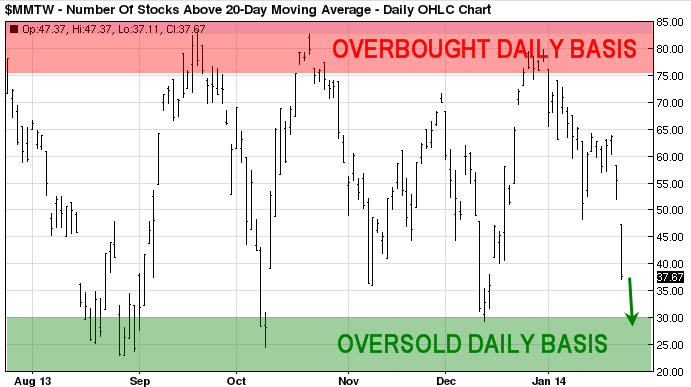
Momentum Index – The Intraday Extreme Overbought/sold indicator
This is an indicator I follow daily to understand how strong the selling is. If it is broad based or sector related. The last two sessions clearly shows is broad based and that the market has moved to quickly in one direction and is primed for a knee jerk reaction bounce.
This is a fantastic tool for timing key pivot lows and highs in the broad market. We are nearing another key pivot low but there is still room for more selling next week.
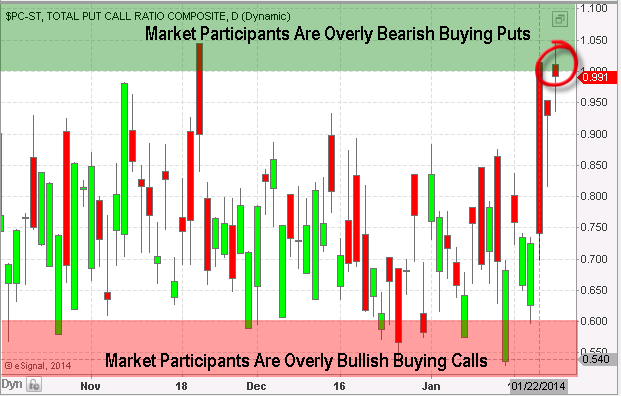
Options Traders Are Fearful of Continued Selling
If you don’t know what the put/call ratio is, in simple terms it tells us when the majority of traders are buying put options (expecting stocks to fall, ratio of 1.0+), and when they are overly bullish (expecting stocks to rise, ratio below 0.60).
The chart below shows everyone is leaning towards more selling in the stock market. I use this as a contrarian indicator.
The Fear Trade – Shorting Fear with an Instrument that Naturally Loses Value: VXX
There is a lot of interesting way to trade the stock market and once way it through shorting the VXX ETF during bull markets. Instead of buying a long position in stocks, you could simply short the VXX fund. This thing loses value over time because of the way it’s managed/constructed. So logic says, shorting it on bounces can be very rewarding during times when fear is high.
Keep in mind this fund and its underlying index moves FAST with 20-30% percent swings… Trade small position sizes if you ever touch this thing…
Weekly Technical Trading Report Conclusion:
In short, (pardon the pun) I feel the stock market is setting up for another big bounce. The technicals and longer term trend remains bullish. I trade with the trend until proven wrong. Only then will I change the direction and trade with the new trend.
2013 was one of the worst years for gold in a generation and the strangest part of it is that this loss came during a time in what should have been a banner year for gold.
When the Fed launched its QE1 and QE2 programs, gold posted huge gains but with QE3, we only had a brief rally in late 2012, it’s been all downhill form there.
The price of gold over the last year highlights just how much Europe has become a powerful driver behind gold vs. the US which has historically been the main mover. When the European debt crisis started a few years ago, people fearing a financial meltdown in Europe put a lot of their money into gold as it was the save haven of choice.
However, with financial and political risk in Europe subsiding, we have seen money leave gold and move into other markets, hence the big outflows from gold ETF’s.
Other factors that have dragged on gold over the last year include falling jewelry demand, the loss of its role as an inflation hedge with deflation becoming more of a concern in some areas, also tax increases on gold imports in India, and the supposedly improving economy in the US. All these contributed to the selling of gold.
Gold and gold stocks crashed last year in the summer. They have since been going through a stage one base. This suggests that 2014 will mark the start of a new bull market for gold, gold mining stocks and commodities. The commodity sector as a whole should be your focus in the coming months if you want to be able to invest in something for longer than a few days or weeks and make a huge amount of money be sure to check out my gold newsletter.
Gold Market Traders & Manipulators Provide Contrarian Bullish Outlook
Gold market traders and manipulators like some of the commercial banks/brokerage firms have been verbally slamming gold, and it turns out many are not as negative as lead us to believe…
Goldman Sachs we all know are the biggest hypocrites. While advising clients to sell gold in the second quarter of 2013, they bought a stunning 3.7 million shares of the GLD. And when Venezuela needed to raise cash and sell its gold, guess who jumped in to handle the transaction? Yup, GS! So while they tell everyone to sell gold, they are accumulating as much as they can without being obvious.
There is a lot more reasons and fundamentals to be bullish on commodities and gold, but that is not the point of this technical based report.
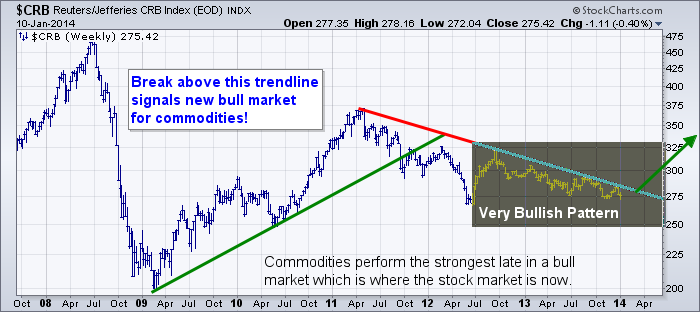
Weekly CRB Commodity Index – Bull Market Cycle About To Start
Taking a quick look at the CB index which is a basket of commodities, it looks as though a breakout above its down trend line will trigger a new bull market in the commodity sector. While this has not yet happened it looks as though it may happen in the next few months.
On stock market that recently broke out of a Stage 1 basing pattern (new bull market) is the Toronto Stock Exchange. This index is heavily weighted with commodity based stocks. I talk about this more in my new long-term algorithmic trading newsletter.
In this report I want to show you some interesting charts that are pointing to a new gold bull market cycle which looks to be starting.
The chart below of the gold miner’s bullish percent index is often misread by many traders and trade off its information incorrectly. Many for example think this index is based on stocks trading above a moving average which is no correct.
How a bullish percent index is calculated is based on Point & Figure buy and sell signals with each individual stock within the sector and in our case the gold minders ETF GDX.
Gold prices peaked in 2011 at $1923 an ounce when the gold mining stocks index was above 80%. Why is this important? Because gold stocks typically lead the price of gold in both directions, tops and bottoms.
As of today we have the reverse situation with the bullish percent index at 13% and showing bullish divergence from that of gold stocks. This is an early signal that the new gold bull market cycle is turning up and it should not be overlooked.
Also we see the 5th and final Elliott wave pattern forming and we could once again witness another multi year rally in the price of gold.
Gold Mining Bullish Percent Index – Weekly Chart
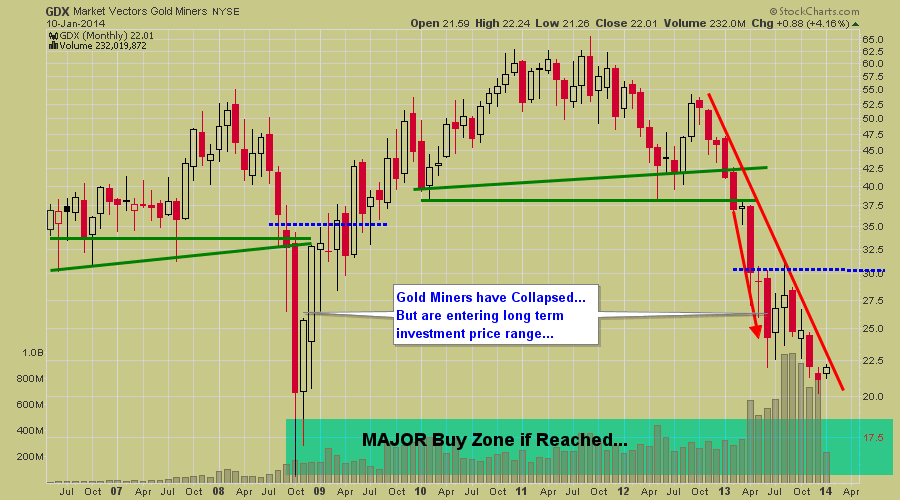
Gold Miners ETF – Monthly Chart
Gold stocks have not yet broken out to start a rally as you can see in the chart below. But the important thing to note is that the daily chart has formed a mini Stage 1 Basing patterns and could breakout this week to kick start a multi month/year rally.
Gold & Gold Stock Bull Market Conclusion:
If you have been following me for a while, you know I don’t try to be a hero and pick tops or bottoms. We all know that strategy is a losing one over the long run.
Since 2011 I have been a very dormant gold trader. Why? Because the price and technical indicators topped out and confirmed a massive consolidation or bear market was in motion.
With gold, gold stocks and precious metals about to start a new bull market, it is time to get back to trading gold and gold stocks.
You can get my daily gold, silver and gold stock analysis every morning with my gold newsletter and save 50% on your membership by joining today!
http://www.thegoldandoilguy.com/wp-content/uploads/2014/11/tgaoglogo.png00adminhttp://www.thegoldandoilguy.com/wp-content/uploads/2014/11/tgaoglogo.pngadmin2014-01-12 13:18:522014-03-03 12:19:40Gold Market Traders – New Gold Bull Market Cycle Has Started
This is the last part four of my four part series. The biggest mistakes traders and investors make which costs them time, money and usually self-confidence when trading are laid out in in the information below.
This last mistake is the by far the biggest and hardest problem individuals have. Believe it or not, the best way around it is with the use of algorithmic trading strategies which trades for you simply because we cannot mess things up. This is one of the reason automated trading has exploded in the recent years.
Mistake #4 – Lack Of Discipline, this silent killer is in all of us!
Over the 16 years in which I have been trading and investing, I have never found a person who has not had discipline issues in their trading career. The brutal honest truth you likely do not want to hear is that you will never succeed at trading if you cannot follow a proven trading strategy and all its rules over and over again.
While some individuals just don’t have enough discipline to trade, most of us fall victim to fear, greed or our ego causing us to break our trading rules and do silly things with our money or open positions.
Lack of discipline is failing to do what you should do in a given circumstance when trading your strategies. We all know how easy it is to break rules from time to time because our gut feeling is so strong against what our trading strategy is doing but it is a huge mistake to intervene.
How to Avoid Your Lack Of Discipline
There are only three ways that will only help reduce (not eliminate) your lack of discipline.
1. Lose enough money that you now respect the market.
2. You have taken the time to think, create, and test a proven trading strategy that trades within your market philosophy and risk levels. I talk about this in great detail in my book “Technical Trading Mastery – 7 Steps To Win With Logic”.
3. You either automate your trading strategies or subscribe to a Automated Trading Strategy that removes you from the equation.
An interesting way to think of trading is not think but react.
The key to defeating your lack of discipline is to create and trade a system that is very simple to execute. And you must have 100% confidence in the system so you do not step in and alter its trading decisions. The key is to react and execute trade first with your proven strategy, and then once you are done you can think about what and why things did what they did all you want.
The last point I want to make, is that if you have your own system it is crucial that you are not tinkering with it all the time. If you keep tinkering with it, then you will never truly know how well it works thus you will second guess its activities and remain an un-disciplined trader.
Four Biggest Mistakes Series Conclusion:
My primary goal of this series has been to show you that there really is only one person who can control your success or failures in trading along with everything else in life. That person is you. In the end you are responsible for everything you have done.
The most common pitfall traders fall into is that when something goes wrong, they blame the market for the loss and not himself.
The key in trading is to accept that you will have losing trades and understand that it is part of this business. And when you lose a trade be sure not to allow these bad experiences have a negative effect on subsequent trades.
So the next time you find you self contemplating breaking a trading rule that has proven to work well over the long run for you, know that if you fall off the discipline train you will instantly be categories as one of those 90% of losing traders kind of guy.
I hope that his series has helped you. If you missed the previous parts, scroll up and use the links within this article near the top for Part I, II and III.
Here are some important resources for conquering these four biggest mistakes:
http://www.thegoldandoilguy.com/wp-content/uploads/2014/11/tgaoglogo.png00adminhttp://www.thegoldandoilguy.com/wp-content/uploads/2014/11/tgaoglogo.pngadmin2014-01-06 16:23:352014-03-03 12:23:33The Most Important Trading Tool That Money Can’t Buy