
Is February a Risk-On or Risk-Off Trade: Equities or Gold & Bonds
Recent price action in the stock market has many traders on edge. With the market closing below our key support trend line last week, the market has now technically starting a down trend.
While trend lines are a great tool for identifying a weakening trend and reversals in the market, I do not put a lot of my analysis weighting on them.
Most of my timing and trading is based around what I call INNER-Market Analysis (Market Stages, Cycles, Momentum and Sentiment). Using these data we can diagnose the overall health of the market. Knowing the strength of the market we can then forecast short term trend reversals before they happen with a high degree of accuracy.
In this report I keep things clean and simple using just trend lines. During the last three weeks we have seen the price of stocks pullback. And because 2013 was such a strong year for stocks most participants are expecting a sharp market correction to take place anytime now.
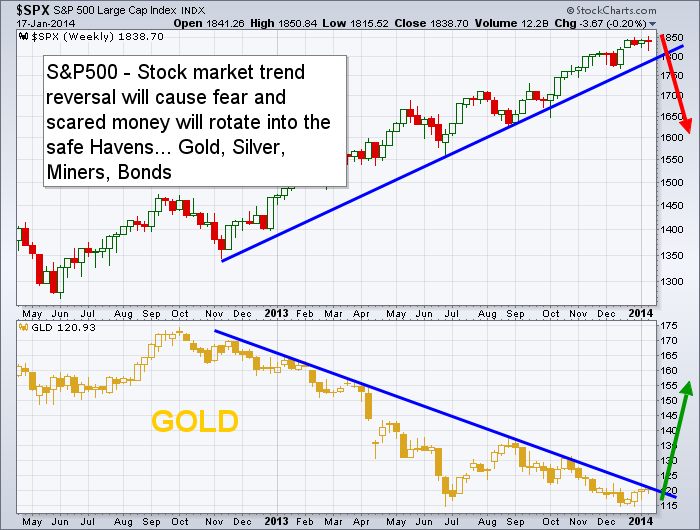
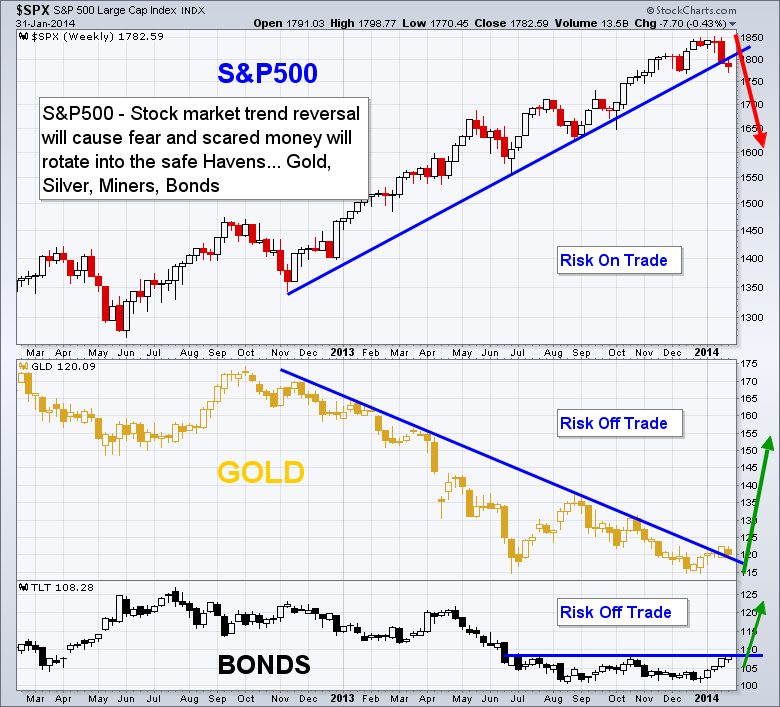
So with the recent price correction fear is starting to enter the market and money is rotating out of stocks and into the Risk-Off assets like gold and bonds.
Stocks tend to fall in times of economic uncertainty or fear. These same factors push investors towards the safety trades (Risk-Off) high quality bonds and precious metals. As more money goes from risk-on to risk-off, stocks will continue to fall and the safety trades will rise. The move by investors to select the safety of gold and bonds compared to the volatility of stocks will result in these risk plays to moving in opposite directions.
Let’s take a look at the chart below for a visual of what looks to be unfolding…
How to Trade These Markets:
While these markets look to be starting to reverse trends, it is critical that we understand how the market moves during reversals and understand position/money management.
Getting short stocks and long precious metals in the long run could work out very well, but if you understand the price action that typically happens during reversals you know that the stock market will become choppy and we could see the recent highs tested or possibly even a new high made before price actually starts a down trend. And the opposite situation for gold and bonds. Drawdowns can be huge when investing and why I don’t just change position directions when the first sign of a trend change shows up on the chart.
Price reversals are a process, not an event. So it is important to follow along using a short term time frame like the daily chart and play the intermediate trends that last 4-12 weeks in length. By doing this, you are trading in the direction of the most active cycle in the stock market and positioned properly as new a trend starts.
What I am looking for in the next week or two:
1. Stocks to trade sideways or drift higher for 3-6 days, then I will be looking to get short. Again, cycle, sentiment, and momentum analysis must remain down for me to short the market. If they turn back up I will remain in cash until a setup for another short or long entry forms.
2. Gold remains in a down trend but is starting to breakout to the upside. I do have concerns with the daily chart patterns for both gold and silver, so next week will be critical for them. We will be using some ETF Trading Strategies to take advantage of these moves.
3. Bond prices (not yields) look to be forming a bottom “W” pattern. They have had a big run in the last few weeks and are now testing resistance. I think a long bond position is slowly starting to unfold but if we look at the futures price charts for both bonds and gold, they have not yet broken to the upside and have more work to do. As mentioned before ETFs are not really the best tool for charting but I show them because they what the masses follow and trade.
Get these reports every week free at: www.GoldAndOilGuy.com
Chris Vermeulen
Author of “Technical Trading Mastery – 7 Steps To Win With Logic”

