
When To Trade? My Algorithmic Trading System Shows You
Pre Algorithmic Trading System Analysis: This week has been a little wild as stocks pulled back due to headline news. The two big drops which took place on heavy volume sent market participants into an emotional state liquidating their long positions on fear of a collapse. Even though the stock market shows no sign of the trend reversing down, traders are jumpy and quick to lock in gains with any negative new. Sounds like a “Wall Of Worry” to me.
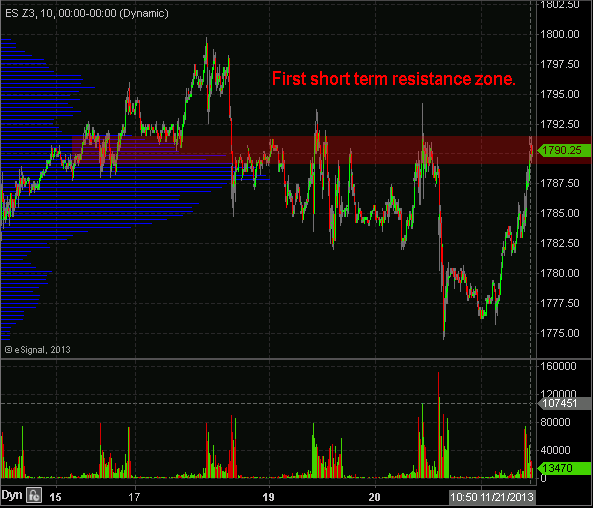
Taking a look at the ES mini futures chart below which is a ten minute intraday chart. It is clear the recent pop in price is testing high volume resistance as seen on the chart with the blue horizontal bars.
Also the previous pivot highs and consolidations on the chart highlighted in red also confirms there is price resistance at this level. Thursday’s rally is likely ready for a little pullback or sideways consolidation at this point based on this information.
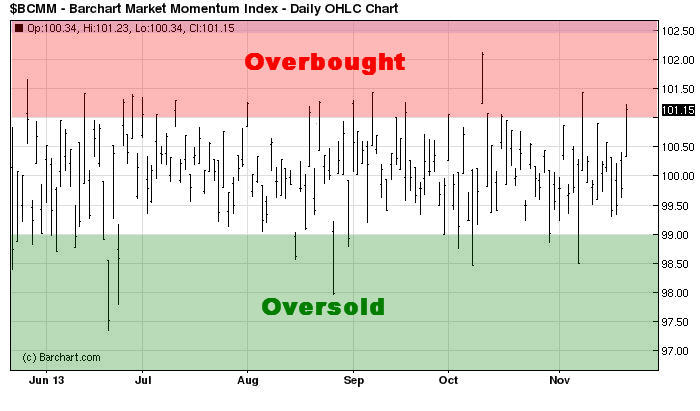
If we take a look at the Barchart Market Momentum index which is something I follow closely because it tells me when stocks have moved to far too fast in either direction. In simple terms, the market is either overbought or oversold when this chart reaches either extreme.
When the market closes with this indicator in the overbought or oversold zone, you should expect a pause or 1-3 day reversal in the opposite direction.
But keep in mind, when the trend is up, the only high probability zone to focus on is the oversold. We want to buy dips within an uptrend, and take partial profits or tighten our stops when the stock market is over extended to the upside. This is exactly what members and myself did today, locked in some profits and tightened our stops, well my Algorithmic Trading System told us to do it…
Logical Market Analysis Combined with Automated Algorithmic Trading System
Reviewing the charts for high volume resistance levels, previous pivot highs and lows, and a close eye on the Barchart momentum index like we just did in this report is only the tip of the iceberg when it comes to complete market analysis.
There are many other things one should analyze for precision market timing of the broad market. The stock market has several different forces at play which move price and using a type of analysis which I call INNER-Market Analysis allows us to capture all the market moving forces within one indicator. This February when my book is published on INNER-Market Analysis and algorithmic trading systems all this information will be available if you would like to learn more.
Some other areas of the market which must be analyzed are trends, active cycles, volatility, volume flows, and market sentiment to name a few.
Over the years I have been converting the way I analyze the market into an algorithmic trading system that catches each overbought and oversold market condition on specific chart timeframes. I have also implemented position and money management rules for the algorithm to trade in my brokerage account completely hands free which I must admit is the coolest feeling thing to experience.
What is an algorithmic trading system?
 A trading algorithm is nothing more than a bunch of rules which you create (your trading strategy) converted into a computer language so a financial charting platform can run your trading strategy automatically. Everything is done for you including the trading. The only thing the system creator needs to do is monitor the algorithmic trading system for technical issues and possible tweaks here and there.
Take a look at the 30 minute algorithmic trading results
Since Oct 30th the S&P500 index has been chopping around and shaking traders out of their long and short positions with intraday price whipsaws (nominal new highs and lows which runs the stops of the average market participant). The index is only risen by 1.2% in the last 23 days while my algorithmic trading system which trades the S&P 500 index futures (ES Mini) and/or (3x Leveraged ETFs UPRO & SPXU) has been pulling money out of the market at an incredible rate.
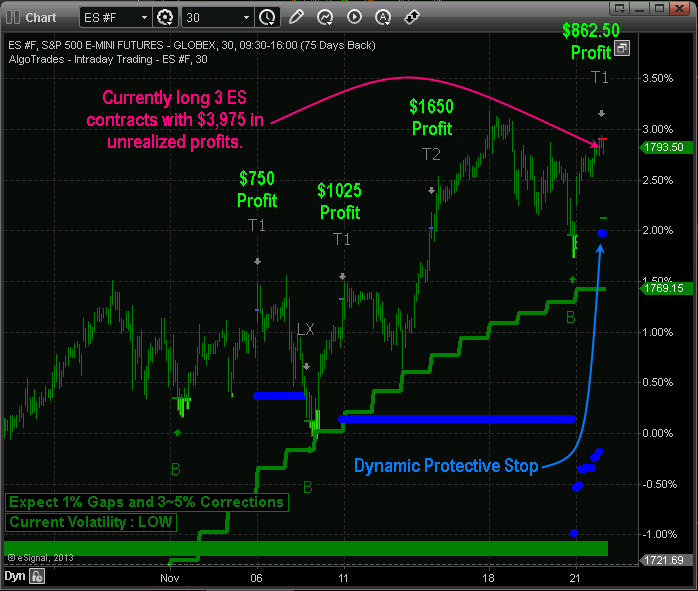
Remember these trades in the example chart above are just two types for algorithms trading within my system. There are 12 algo trading strategies covering all market conditions automatically managed in one complete solution.
Conclusion About Using an Algorithmic Trading System:
Trading or investing for that matter is no easy task. And I know firsthand that even if one has a proven winning strategy it’s almost impossible follow the rules and catch every trade setup generated. I do not know how many times I see perfect setups about to unfold and then miss them because I was reviewing other charts, sending an email, going to the washroom or grabbing a bite to eat.
These missed opportunities along with a few other reasons I will explain in my next post, is what got me started programming my trading strategies to do exactly what I showed you here.
I will admit, it has been a major learning process, ridiculously expensive to create and I can safely say that I now know several of the main stream programmers available. I also know who can make miracles happen and who cannot.
This post is to share with you some new and exciting things unfolding based around my index trading strategy. Over the next week I will share my story of how algorithmic trading became my focus, passion and automated income stream and how you can do it also.
Chris Vermeulen


