The SP500 continued to rally and is pushing extreme overbought conditions today. Our net short ETF trading strategy on the SP500 is close to getting stopped out as the trend is on the verge of turning back up if sellers do not step in tomorrow. We are under water on this trade and unfortunately we lose when trends reverse as that is just part of trading. The trend remains down and we could get a miracle tomorrow to save the day. only time will tell.
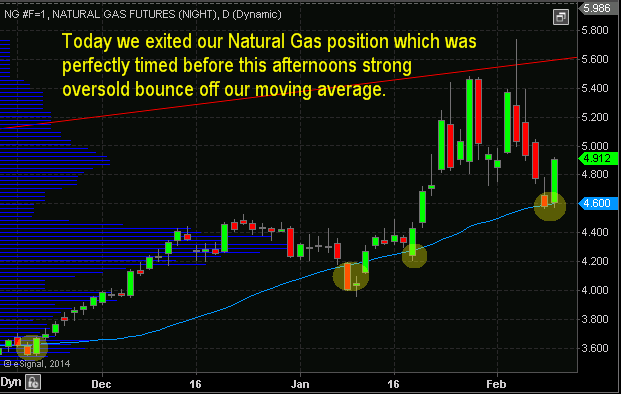
Natural Gas ETF Trading Strategies: This morning we closed out our natural gas trade for a big profit of roughly 18-20% depending where you entered and placed your stop. I have had a several emails from members wanting to add to their position yesterday, and another bunch today saying they still hold their position in natural gas cause they think price will continue to move in their favor. Technically, closing out our trade today was the proper thing to do. We followed our rules and the trade managed it’s self perfectly. While natural gas could continue to sell down in the long run, wanting to hold your position or add to a trade that is up 40% without any real pullbacks is the sign of a GREEDY trader. General rule is, if you do not take profits on a trade, the market will simply take them back, its that simple.
ETF Trading Strategy for DGAZ Pays out 20% return!
It looks as though precious metal miners and gold are having an impulse wave higher and have turned up. Silver remains in a down trend/basing pattern. I plan to get long this sector on the first pause or pullback. Though we could get long Silver tomorrow using one of our precious metals etf trading strategies.
Chris Vermeulen
https://thegoldandoilguy.com/wp-content/uploads/2014/02/natgasbounce.png394621adminhttp://www.thegoldandoilguy.com/wp-content/uploads/2014/11/tgaoglogo.pngadmin2014-02-11 16:39:322014-03-03 13:35:18ETF Trading Strategies for Gold, Silver, Miners and Natural Gas
Recent price action in the stock market has many traders on edge. With the market closing below our key support trend line last week, the market has now technically starting a down trend.
While trend lines are a great tool for identifying a weakening trend and reversals in the market, I do not put a lot of my analysis weighting on them.
Most of my timing and trading is based around what I call INNER-Market Analysis (Market Stages, Cycles, Momentum and Sentiment). Using these data we can diagnose the overall health of the market. Knowing the strength of the market we can then forecast short term trend reversals before they happen with a high degree of accuracy.
In this report I keep things clean and simple using just trend lines. During the last three weeks we have seen the price of stocks pullback. And because 2013 was such a strong year for stocks most participants are expecting a sharp market correction to take place anytime now.
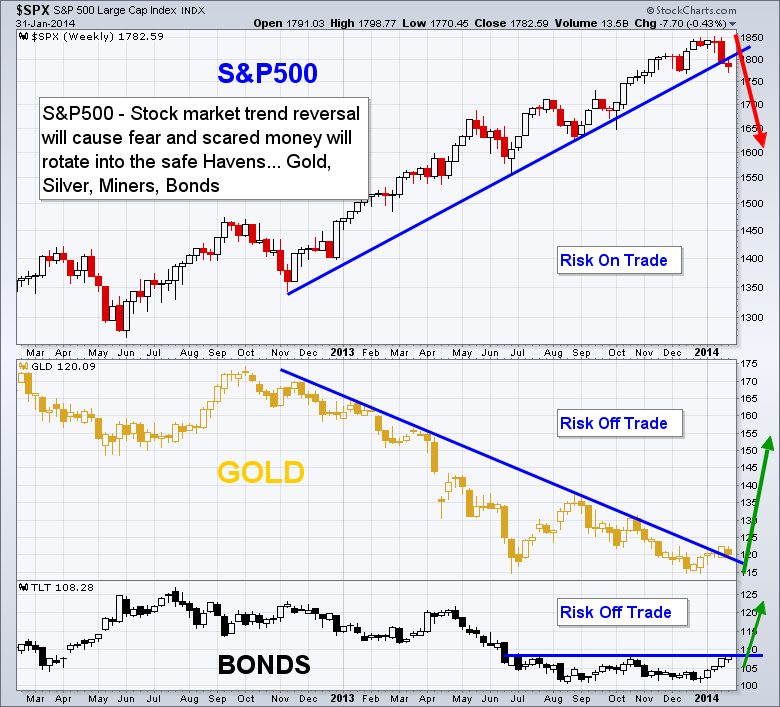
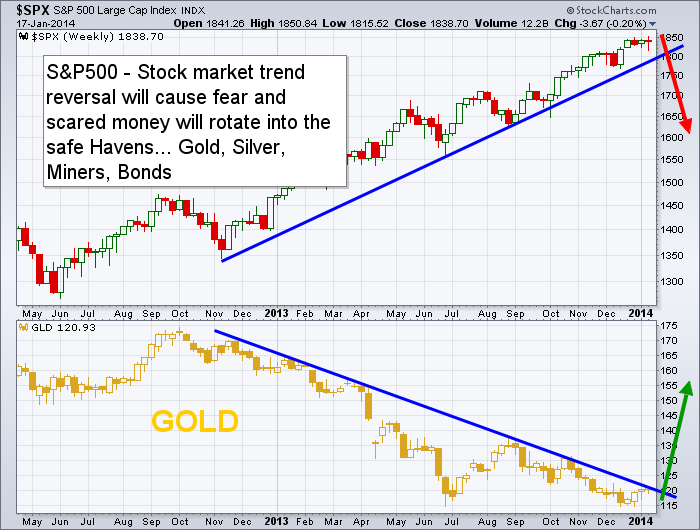
So with the recent price correction fear is starting to enter the market and money is rotating out of stocks and into the Risk-Off assets like gold and bonds.
Stocks tend to fall in times of economic uncertainty or fear. These same factors push investors towards the safety trades (Risk-Off) high quality bonds and precious metals. As more money goes from risk-on to risk-off, stocks will continue to fall and the safety trades will rise. The move by investors to select the safety of gold and bonds compared to the volatility of stocks will result in these risk plays to moving in opposite directions.
Let’s take a look at the chart below for a visual of what looks to be unfolding…
How to Trade These Markets:
While these markets look to be starting to reverse trends, it is critical that we understand how the market moves during reversals and understand position/money management.
Getting short stocks and long precious metals in the long run could work out very well, but if you understand the price action that typically happens during reversals you know that the stock market will become choppy and we could see the recent highs tested or possibly even a new high made before price actually starts a down trend. And the opposite situation for gold and bonds. Drawdowns can be huge when investing and why I don’t just change position directions when the first sign of a trend change shows up on the chart.
Price reversals are a process, not an event. So it is important to follow along using a short term time frame like the daily chart and play the intermediate trends that last 4-12 weeks in length. By doing this, you are trading in the direction of the most active cycle in the stock market and positioned properly as new a trend starts.
What I am looking for in the next week or two:
1. Stocks to trade sideways or drift higher for 3-6 days, then I will be looking to get short. Again, cycle, sentiment, and momentum analysis must remain down for me to short the market. If they turn back up I will remain in cash until a setup for another short or long entry forms.
2. Gold remains in a down trend but is starting to breakout to the upside. I do have concerns with the daily chart patterns for both gold and silver, so next week will be critical for them. We will be using some ETF Trading Strategies to take advantage of these moves.
3. Bond prices (not yields) look to be forming a bottom “W” pattern. They have had a big run in the last few weeks and are now testing resistance. I think a long bond position is slowly starting to unfold but if we look at the futures price charts for both bonds and gold, they have not yet broken to the upside and have more work to do. As mentioned before ETFs are not really the best tool for charting but I show them because they what the masses follow and trade.
https://thegoldandoilguy.com/wp-content/uploads/2014/01/Gold-Stocks.png530700adminhttp://www.thegoldandoilguy.com/wp-content/uploads/2014/11/tgaoglogo.pngadmin2014-02-02 12:24:142014-03-03 13:37:43Is February a Risk-On or Risk-Off Trade: Equities or Gold & Bonds
I apologize now for the Christmas colored charts below… Its a lot of red and green but these are the most understood colors for knowing what ranges means (bullish or bearish).
This was a very emotion week for traders. The strong selling Thursday and Friday has traders and investors running for the door and panicking out of positions. While I did close out our long SP500 swing trading on Thursday to lock in a profitable trade, I do feel as though we can re-enter next week a better price.
The only ones feeling pain today are those who do not have enough self-discipline to create rules and trade by them. Again this is talked about in GREAT DETAIL in my new book. If this is you, I recommend buying my book and reading it this weekend as it’s a quick and simple read. There is a paperback version or instant PDF download available: Get Book.
Without self-discipline no amount of courses are trading services will make you a successful trader.
Let’s get technical and jump into the charts…
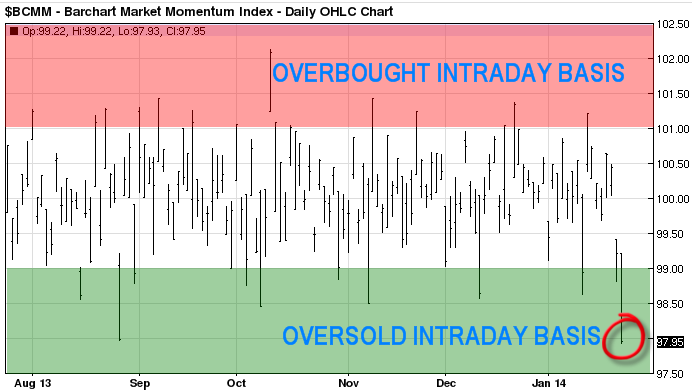
Momentum Index – The Intraday Extreme Overbought/sold indicator
This is an indicator I follow daily to understand how strong the selling is. If it is broad based or sector related. The last two sessions clearly shows is broad based and that the market has moved to quickly in one direction and is primed for a knee jerk reaction bounce.
This is a fantastic tool for timing key pivot lows and highs in the broad market. We are nearing another key pivot low but there is still room for more selling next week.
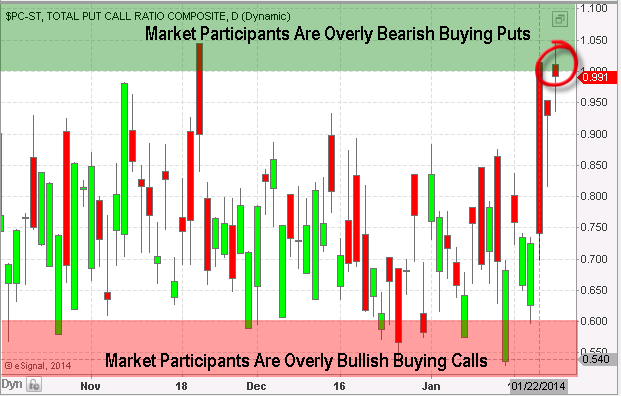
Options Traders Are Fearful of Continued Selling
If you don’t know what the put/call ratio is, in simple terms it tells us when the majority of traders are buying put options (expecting stocks to fall, ratio of 1.0+), and when they are overly bullish (expecting stocks to rise, ratio below 0.60).
The chart below shows everyone is leaning towards more selling in the stock market. I use this as a contrarian indicator.
The Fear Trade – Shorting Fear with an Instrument that Naturally Loses Value: VXX
There is a lot of interesting way to trade the stock market and once way it through shorting the VXX ETF during bull markets. Instead of buying a long position in stocks, you could simply short the VXX fund. This thing loses value over time because of the way it’s managed/constructed. So logic says, shorting it on bounces can be very rewarding during times when fear is high.
Keep in mind this fund and its underlying index moves FAST with 20-30% percent swings… Trade small position sizes if you ever touch this thing…
Weekly Technical Trading Report Conclusion:
In short, (pardon the pun) I feel the stock market is setting up for another big bounce. The technicals and longer term trend remains bullish. I trade with the trend until proven wrong. Only then will I change the direction and trade with the new trend.
The two trend reversals everyone has been waiting a year for are about to take place, but they have not yet started.
While I do think 2014 is the year we see gold, silver, miners and many other commodities rally, it is important to follow the trend and wait for a reversal to form before getting overly excited and long commodities.
Each time we see the daily charts form some type of bullish pattern gold market traders become instantly bullish. And each time this happens they get another reality check about their trading technique of trying to pick a bottom.
I just published a book in December which teaches readers how to identify trends and stages in the market – “Technical Trading Mastery – 7 Steps to Win With Logic”. Buying into a bear market rally is not a high probability winning position. Odds favor that sellers will pull the price down and likely to new lows.
This January is one of these times and gold market traders are getting excited and long positions. While the bottom may in for precious metals, buying a bounce in a bear market is tricky and you better have some trading discipline to exit if price starts to sell back down.
Eventually we will see the stock market rollover and breakdown below its support trendline and gold will rally. But keep in mind, some of the largest percentage based moves take place just before a reversal. What does this mean? It means that the stock market could easily go parabolic and rally for a few more weeks, then reverse down sharply. And precious metals would do the opposite, sell off, make new lows, then reverse back up and start a new bull market.
Stock Market VS. Gold – Gold Market Traders Be Aware!
Below are a few more charts showing my big picture trend analysis for silver and gold miners.
Gold Market Traders Conclusion:
In short, the precious metals sector is still in a bear market and has not yet reversed to the upside. As you know I don’t pick bottoms or tops which go against the longer term trend. In this case the trend is down for precious metals so I am not trying to pick a bottom.
While I am starting to get excited about the eventual bottom in gold, I am still sitting on the fence with my cash.
If you would like to get my analysis every day and my gold trades be sure to join me at www.TheGoldAndOilGuy.com
Chris Vermeulen
http://www.thegoldandoilguy.com/wp-content/uploads/2014/11/tgaoglogo.png00adminhttp://www.thegoldandoilguy.com/wp-content/uploads/2014/11/tgaoglogo.pngadmin2014-01-20 10:59:282014-03-03 12:09:49Gold Market Traders: Metals And Stock Market will Swap Trends – Part II
This is part three of a five part series of the four biggest mistakes traders and investors make which costs them time, money and usually self-confidence when trading stocks, ETF’s or futures trading strategies.
If you were to engage in something risky like skydiving, you or a team would check your parachute to be sure its packed properly, strapped on to your body correctly before you jumped out of the plane. If for some reason you were not told how to use the gear, like when to pull the ripcord etc… I guarantee you would ask them before you threw your body out of the plane. There is a real fear of dying so you naturally make sure you are in control of what you are about to do so your risk is managed and live another day.
But when it comes to trading this is not the case and you and I both know a good part of why. We all know people who have said rude things, quit jobs or broken up with a girlfriend or boy friend over the internet (email/text message). Let’s face it, it’s easy to be brave online and do things we would never really do in person. Heck, some of the emails I get from readers of my free weekly articles I post are so rude and some are threatening that all I can do is laugh. Because I know these people would likely never say the things they did to someone they have never met, and do it to their face all because they think my FREE short term market prediction does not fit their bias. I think you get the point here…
So when it comes to trading individuals get this what I call “Online Courage” and this is why so many fail to protect their capital when trading. They simply don’t see their money so it does not feel at risk (out of sight is out of mind). This lack of fear is what leads to loss of risk control.
There area few things that can and should be done to control your overall risk when trading. The first one is diversification. Not having all your trading capital in one investment allows you to spread your risk between other investments with low correlation, meaning if one of your positions move down, another one should be moving up in your favor.
The second is diversification between time-frames. Having multiple positions based on different time frames can provide an overall lower volatility in your portfolio. For example you could be long the daily chart for a swing trade that should last a couple weeks, and you may be short the 60 minute chart because you expect a shot term pullback. Time diversification is overlooked by many traders.
Third is through position sizing. It’s better to have a few smaller positions spread captial over various investments than it is to have one position in only one investment (eggs all in one basket).
And finally the last and one of the most important is the stop loss. They are commonly referred to as money management stops. They are not used to increase your positions performance. Instead they are there to protect you from unnecessary loss if the market moves against your position. Keep in mind when I say protective stop, I dont mean a mental stop (one floating around in your head) I mean a read stop loss order that is live in the market. Risk control should never be an option, it’s a MUST!
In short, risk control will not single handily allow you to beat and profit from the market. But without managing your risk you have no hope of winning in this industry. The key is to stay in the game long enough to start seeing gains and allowing your money to compound over time for above average returns.
Controlling risk is in each trade that is taken with my subscribers at TheGoldAndOilGuy.com ETF Trading Strategies are something I always provide. Consider joining the newsletter today and start trading with confidence.
Also stay tuned for the next part in this series Lack Of Self-Discipline!
GET MY FREE TRADING IDEAS AND EDUCATIONAL REPORTS BELOW
http://www.thegoldandoilguy.com/wp-content/uploads/2014/11/tgaoglogo.png00adminhttp://www.thegoldandoilguy.com/wp-content/uploads/2014/11/tgaoglogo.pngadmin2013-12-30 07:20:072014-03-03 12:35:04Part III – The Four Biggest Mistakes by Traders: Failing to Control Risk
Tis the Season for the most powerful seasonality trade of the year!
With the stock market up big in 2013 and most participants are speculating on a pullback in the next week or two, I have to say I am on the other side of that bet. Being a technical trader I focus on patterns, statistics and probabilities to power my ETF trading strategies. So with 37 years of stats the seasonality chart of the S&P 500 index paints a clear picture of what is likely to happen in December.
If you do not know how to read a seasonality chart, I will explain as its very simple. The simply shows what the index has done on average through each month over the past 37 years. December typically has the strongest up trend and probability of happening any other time of the year.
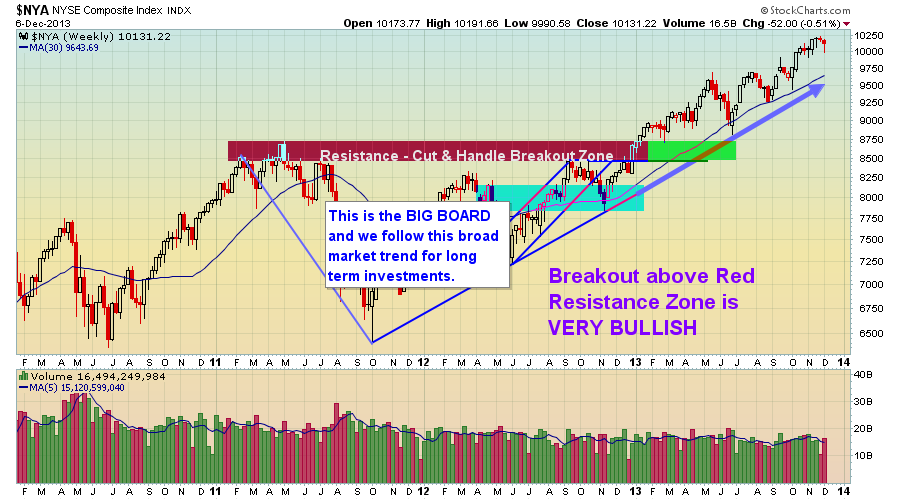
The Big Board – NYSE
The NYSE also referred to as the Big Board, is an index with the largest brand name companies. Most individuals do not follow this, but to me its as close to the holy grail of trading than anything else I know. I use many different data points from this index (momentum, order flow, trend) for my ETF trading strategies.
You must follow the trend of this index if you want to be on the right side of the market. While I follow and track the New York Stock Exchange closely and it has its own fund NYC but it’s an ETF trade I do not use. These big stocks are what really move the market (S&P 500) I think so I always trade with this index trend in mind.
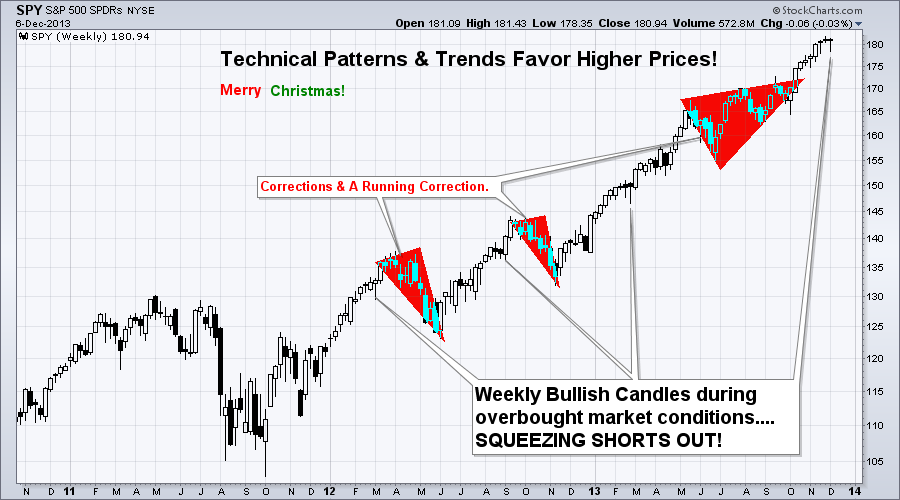
S&P 500 Weekly ETF Trading Strategy – Bullish
The chart below is self-explanatory I think… But let me recap.
The overall trend is up, so your ETF trades should be to the long side buying on the dips. The chart below goes back three years so the candles are a little condensed and small, but what you need to know are these two points:
1. After a correction within a trend, probability says that price is more likely to continue rising than it is to reverse. Notice the market just had a running correction through the summer months.
2. A reversal candle on the weekly chart (bullish reversal candle) generally indicates a 2-3 week rally is likely to happen.
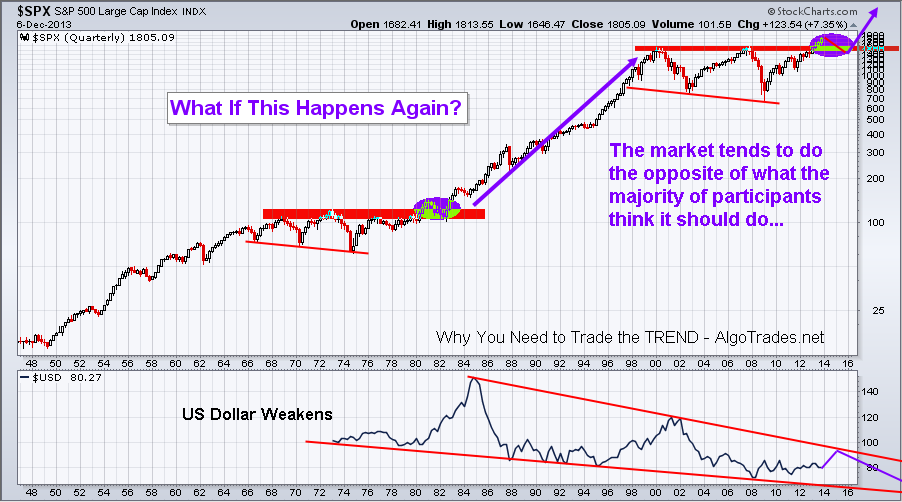
This is a quarterly chart and BIG picture outlook. Over the next 3-6 months we could see the stock market start to become choppy and rollover into a minor bear market for a couple years. That is the best case scenario I think… The other scenario is a major crash back down to the 700-1000 level on the SP500 which would cripple the baby boomer’s from retiring and getting a job would be impossible for almost everyone – full blown recession way worse that what everyone is saying we are in now.
Things are going to be really interesting over the next few years and things for south you better be prepared to make a killing during the next bear market or life will not be fun. The nice thing is that you can take advantage of these moves without ever having to lift a finger with my automated trading system.
ETF Trading Strategies Holiday Conclusion:
In short, I think we have a couple good weeks ahead of us. Holiday season, quality family time and a rising stock market paints a nice picture in my mind.
Anyway, I hope this report was helpful and somewhat educational. I always appreciate feedback and things you would like me to write about how I interpret, trade or analyze things. I am here to help and new topics to write about are always welcome!
Precious Metals ETF Trading: It’s been a week since my last gold & silver report which I took a lot of heat because of my bearish outlook. Friday’s closing price has this sector trading precariously close to a major sell off if it’s not already started.
On a percentage bases I feel precious metals mining stocks as whole will be selling at a sharp discount in another week or three. ETF funds like the GDX, GDXJ and SIL have the most downside potential. The amount of emails I received from followers of those who have been buying more precious metals and gold stocks as price continues to fall was mind blowing.
If precious metals continue to fall on Monday and Tuesday of this week selling volume should spike as protective stops will be getting run and the individuals who are underwater with a large percentage of their portfolio in the precious metals sector could start getting margin calls and cause another washout, spike low similar to what we saw in 2008.
ETF Trading Charts:
Below are updated with Friday’s closing prices showing technical breakdowns across the board..
Sweet & Sour ETF Trading Analysis:
Just to make things a little more interesting I would like to point out a couple other types of analysis.
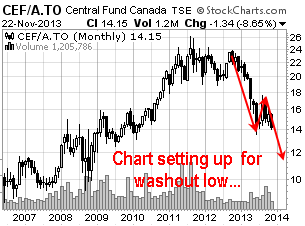
Sweet: Through analysis of the CEF Central Fund of Canada Ltd. chart and evaluation it is clear precious metals are falling out of favor at an increased rate. This fund owns physical gold and silver bullion and investors are fleeing the fund so fast that it is now trading at a 7% discount of its asset value. While this may not seem good for metals I see it as a positive.
When everyone is running for one door after an extended moves has already taken place it tends to act as a contrarian indicator. Knowing that some of the largest percent moves in a trend takes place before reversing, I see this information as an early warning that a bottom will soon be put in place.
Sour: While the USD index has not been much help compared to 2012, I feel as though a rising dollar is likely to unfold for a couple weeks which may lend a hand to pulling the precious metals sector down.
Precious Metals ETF Trading Conclusion:
While I am starting to get bullish for a long term investment in precious metals I know that a bottom has likely not yet been made. But even if it has been, it is better to buy during a basing pattern or breakout to the upside from a basing pattern than to be underwater with a position for an extended period of time along with all the other negatives that come along with it.
I do like the idea of CEF as a long term investment when I feel the time is right. I have invested and traded it many times in the past. The key to trading the fund is to be sure you are buying it at fair value or a discount from the net asset value. You do not want to be buying it when it is trading at a 5-7% premium. The fund owns both gold and silver making it a simple diversified precious metals play.
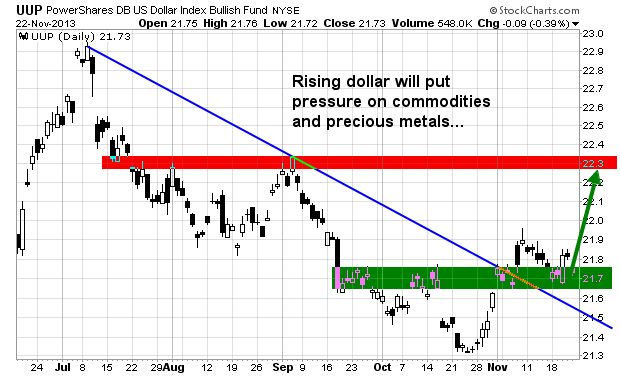
We all know quantitative easing devalues the Dollar but contrary to that general statement it looks as though we could see the dollar index continue to rise for a few more weeks.
If we analyze the chart of the Dollar ETF (UUP) it is clear that the short term momentum has turned up. The break above the down trend line and recent bounce off support bodes well for the dollar index.
The bull flag chart pattern that has formed in the past month has a measured move price target of roughly $22.30. The level also happens to be a key pivot point on the chart along with high volume resistance.
I expect the dollar to continue to work its way higher over the next week or two with $22.30 being the line in the sand where sellers will jump on price and drive it back down, or at minimum force price to consolidate for a few days.
US Dollar ETF Trading Strategy – Daily Chart Analysis
A couple weeks ago I posted these same charts talking about the pending breakout (in either direction) with silver, gold and mining stocks. Fast forwarding to this week its clear this sector continues its struggle to rally. Key support levels are now being tested and if these levels fail prepare for a sharp correction with mining stocks showing the most downside potential of roughly 25% for the GDX ETF trading fund.
Let’s take a quick look at what is going on.
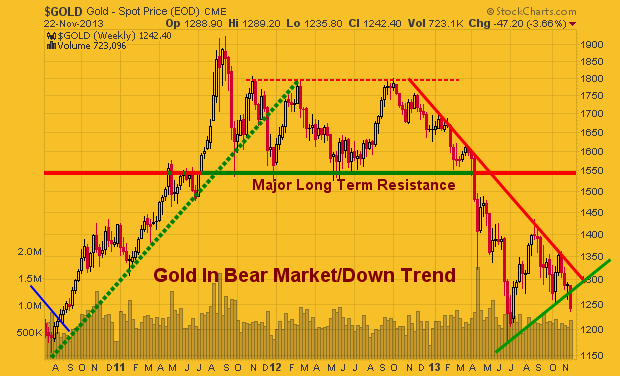
Gold Trading Chart:
The chart of gold shows price being wedge into the apex of the down sloping resistance trend line and the rising support trendline. Gold was trading below this level but has since bounced. But if gold closes the week below this line in the sand the price could start to fall quickly and test the $1200 per ounce within a week or two.
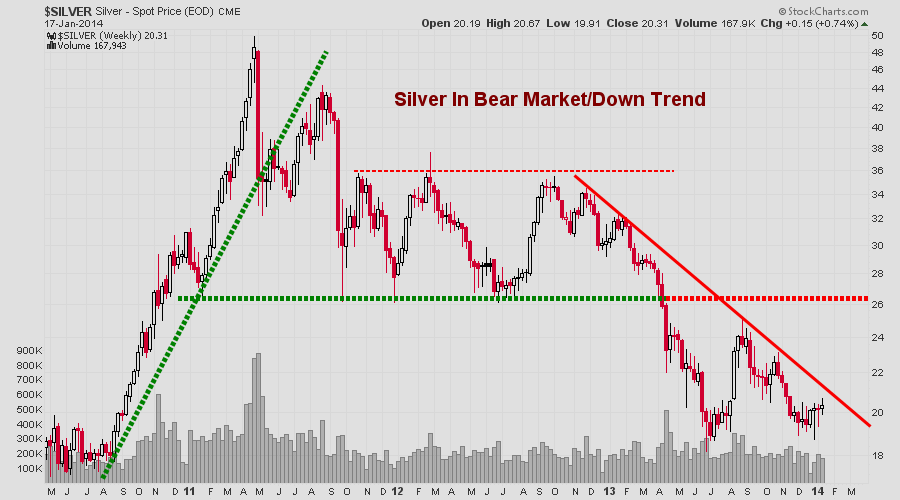
Silver Trading Chart:
Silver is under performing gold and trading below its support level currently. If silver does not recover by Friday’s closing bell then things could get ugly for a few weeks as investors start to exit their positions. That being said, I need to point out that silver is more of a wild card when using trend lines like this. Both gold and gold miners should be confirming this breakdown in silver if it is the real deal.
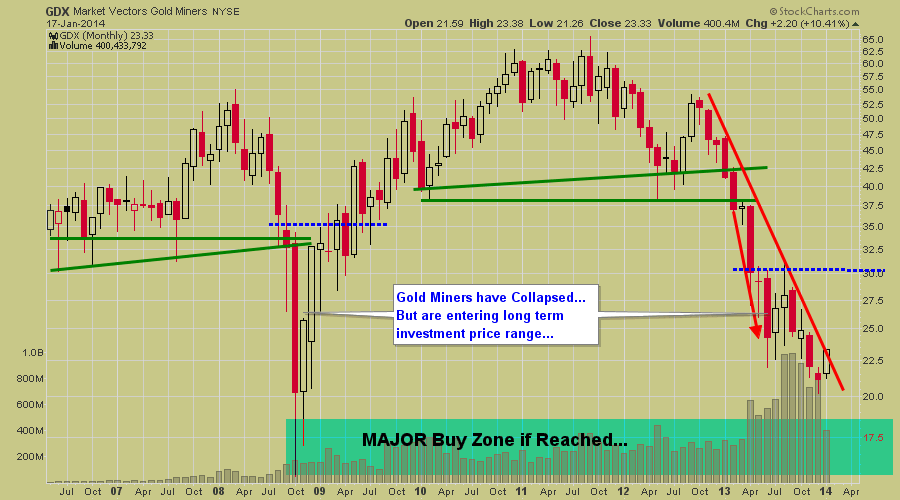
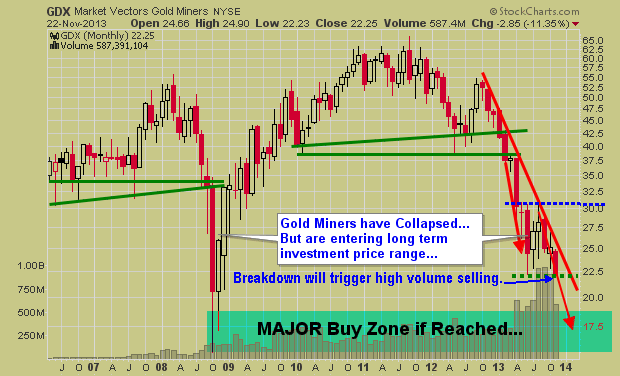
Gold Mining Stocks ETF:
The chart of gold miners I like the most. I like it because it’s pointing to lower prices, roughly 25% lower if the breakdown takes place. Gold mining stocks could be a fantastic long term investment if we see the $17.50 level reached on this GDX etf.
Last week I talked about ETF trading strategies and the big picture on gold, silver, miners and bonds. They look to be nearing a major bottom and once they do bottom it should be a great buying opportunity for specific stocks or the entire sector.
The next few weeks are going to be crucial for precious metals and we will keep an eye on them as this bottom unfolds. Get more reports like this here: www.GoldAndOilGuy.com
Chris Vermeulen
http://www.thegoldandoilguy.com/wp-content/uploads/2014/11/tgaoglogo.png00adminhttp://www.thegoldandoilguy.com/wp-content/uploads/2014/11/tgaoglogo.pngadmin2013-11-18 16:23:472013-11-18 16:23:47Silver, Gold & Miners About To Sell Off Again