Here is my gold prediction (silver and gold mining stocks, should be the same) looking forward 24 months.
Since the top in gold in 2011 gold has selling off. Depending on how you analyze the market, this 3 year sell off could be seen as consolidation within a major cyclical bull market or that it’s in a bear market. But know this, either way, the outlook is bullish, and all gold has to do is find a bottom here and rally above the $1400 per ounce level. This would kick start a major feeding frenzy of gold buying.
Gold bear market in the past have on average corrected 33% and lasted a total of 550 days. So if we look at the stats of the current pullback in gold it has dropped 38% and about 700 days long. Time for a bottom and bull market? It sure seems like it.
You can see my recent report on the US Dollar and gold forecast.
Gold Prediction Technical Outlook:
Gold remains in a down trend, but looks to be starting a possible stage 1 basing pattern. Technical analysis is pointing to strength as the MACD moving higher, relative strength, and the down trendline show price and momentum being bullish.
A few weeks ago the chart completed a Golden Cross. This is not shown on the chart, but it is when the 50 SMA crosses above the 200 SMA. Investors tend to look at this as a major long term buy signal, although I do not use it for any of my analysis or timing of the market.
If historical data, statistics, and technical analysis prove to be correct we can expect gold to rise. My gold prediction is for price to reach $2300 – $2500 per ounce within 24 months.
Gold Prediction Conclusion:
The average gold bull market last roughly 450 days and posts a gain of 95%. So with the current correction which is beyond these levels already, expect price to firm up this year and complete the stage 1 base.
Note that until gold breaks out of its Stage 1 Basing pattern, I will remain bearish/neutral on the metal. There is a huge opportunities else where unfolding…
Join my email list FREE and get my next article which I will show you about a major opportunity in bonds and a rate spike – www.GoldAndOilGuy.com
Chris Vermeulen
https://thegoldandoilguy.com/wp-content/uploads/2014/05/gold-predictions.png141171adminhttp://www.thegoldandoilguy.com/wp-content/uploads/2014/11/tgaoglogo.pngadmin2014-05-14 18:18:282014-05-14 18:18:28Gold Prediction using Statistics & Technical Analysis
Silver forecast shows you the critical line in the sand that silver must hold if the new bull market is to start in the near future. If silver can find support here then I predict silver to rally and break out of its basing pattern in the next 2-3 months.
Silver Forecast & Equities Prediction
In this article I show you how to read and trade using trend lines. Most individuals trade trend lines incorrectly and my example is using the US Dollar index chart which is one of the main points why my silver forecast is bullish.
Silver remains is a downtrend or basing phase at this point, but some big price action is just around the corner. Silver traders and investors should be aware that if silver breaks below its sell support zone it could be in for a world of hurt…
Silver and gold mining stocks are in a similar position but we are seeing bullish divergence when comparing the gold miners bullish percent index to the GDX etf. This is pointing to higher price for silver and gold stocks. Keep in mind that divergence is an early warning indicator and trades should not be traded based upon that alone.
If you have not yet read my gold forecast read it now: Gold Forecast
Chris Vermeulen
https://thegoldandoilguy.com/wp-content/uploads/2014/04/elliott-wave-theory-gold-silver.jpg204240adminhttp://www.thegoldandoilguy.com/wp-content/uploads/2014/11/tgaoglogo.pngadmin2014-04-24 15:15:592014-04-24 15:15:59Silver Forecast and Prediction of Silver Stocks
Gold Forecast: During the past year there has been very little talk about gold, silver or gold stocks in the media. Yet the year before it was all the media could talk about and they even had the price of gold streaming live all day in the corner of the tv monitor.
I am always amazed how the masses and media can be so off in their timing of the stock market and commodities in general. For example when Greece was having issues in 2012 and everyone was avoiding investments in that country like it was the plague. Looking back now, Greece is up huge and only recently investors are confident enough to put money into the Greek stock market again.
But the truth is that big move has already happend, and the US and global markets are in rotation (changing trends). Money is slowly shifting from what has been hot during the past year or two, to new investments which have a lot more room to rise in value. And this is leads us back to my gold forecast.
If you are at all familiar with Stan Weinstein’s work, then you understand the four market stages. If not, you can learn these four stages on my Stan Weinstein page. Through stage analysis we can predict the type of price action we should expected and have a rough idea just how long a move (new trend) is likely to last. It is important to know that Stan Weinstein’s stage analysis works on any time frame from a one minute chart to a monthly chart. If you do not know this then you are trading almost blind without a doubt.
Current stage analysis looks as though the US stock market may be starting to form a stage three top. There are several indicators and market behaviors which are screaming, telling us to trade with caution to the long side. But the masses do not see this or hear what is unfolding in front of their very own eyes, and that I fine. It actually reminds me of a funny old movie called “hear no evil, see no evil”.
In short, the market is showing some signs of distribution selling in stocks, and the once market leaders are now getting completely crushed with heavy selling volume like the biotech stocks, social media stocks and other momentum stocks and this is bad.
Gold on the other had has been forming a stage one basing pattern. This provides a very bullish long term gold forecast that investors could ride for several years.
———————–
Q: Where Will Investment Capital Go During The Next Bear Market In stocks?
A: One of the places will be precious metals. Click here for my gold forecast which shows the main reason why
———————–
Gold Forecast Coles Notes:
1. The US dollar index has setup a massive stage 3 topping pattern on the weekly chart. A falling dollar will send the price of gold higher naturally.
2. Bullish gold forecasts by the media have dropped substantially, meaning everyone is bearish on gold.
3. Gold stocks are already showing signs of massive accumulation. I always use the price and volume action of gold stocks to help create and time my gold forecasts which it starting to look bullish.
Gold Forecast Conclusion:
Gold market traders should understand that precious metals in general are still months away from breaking out to the upside and starting a new bull market. Do not be in a rush to buy gold or gold stocks yet. There will be plenty of time folks.
https://thegoldandoilguy.com/wp-content/uploads/2014/04/gold-forecast-gold-eagle.jpg225224adminhttp://www.thegoldandoilguy.com/wp-content/uploads/2014/11/tgaoglogo.pngadmin2014-04-17 02:30:592014-04-17 02:30:59Gold Forecast – This Is Going To Be Exciting
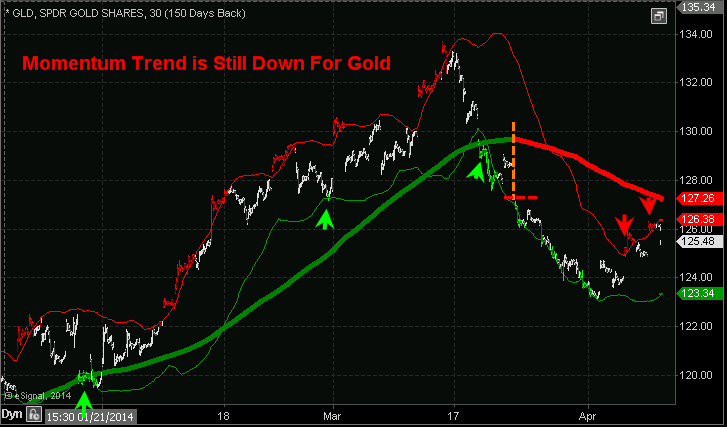
I did a short video a while back on momentum trading gold and wanted to share it and post it in the members area of the website for you to view. It’s short and basic, but useful.
I just posted a timely article talking about how the market leaders (groups/sectors) which lead the stock market higher have been met with strong selling. All of March we saw some distribution selling but the past few weeks it is clear that the big guys are unloading massive amounts of shares to the general public as they no longer want to hold this growth and momentum stocks.
This is of great concern to me and anyone long stocks in their portfolio need to read my article about this.
https://thegoldandoilguy.com/wp-content/uploads/2014/04/gold-forecast-etf-trading-newsletter.png251344adminhttp://www.thegoldandoilguy.com/wp-content/uploads/2014/11/tgaoglogo.pngadmin2014-04-04 17:13:112014-04-04 17:13:11The Market Leaders Are Being Distributed!
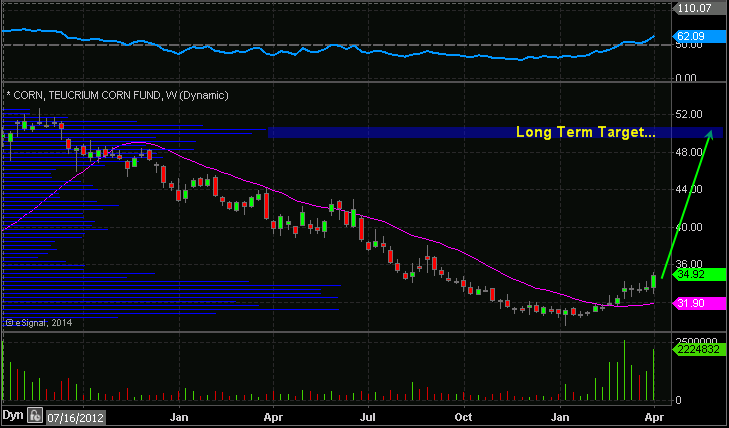
ETF Trading Newsletter: In early February I started watching the CORN ETF very closely for a possible new bull market starting and a long entry point. Many of the other commodities had already posted strong rallies while corn sat on the side lines.
The Corn ETF is designed to follow the price of the continuous corn futures contracts. This commodity looked as though it was forming a base (launch pad) for the new rally and possible major bull market to start.
This post walks you through each step of the way from entering the Corn ETF trade, adding to a winning position, tightening our stops, locking in partial profits at our first price target etc.. In fact myself and subscribers are still long the Corn ETF as of today with my ETF trading newsletter.
________________________________________
ETF Trading Newsletter – CORN ALERT #1
We have been watching the commodities index rally for a few weeks now with natural gas, coffee, sugar, gold, silver and several others jump in price. We have been watching the GCC ETF which is a basket of several commodities to get a feel for the commodities market as a whole.
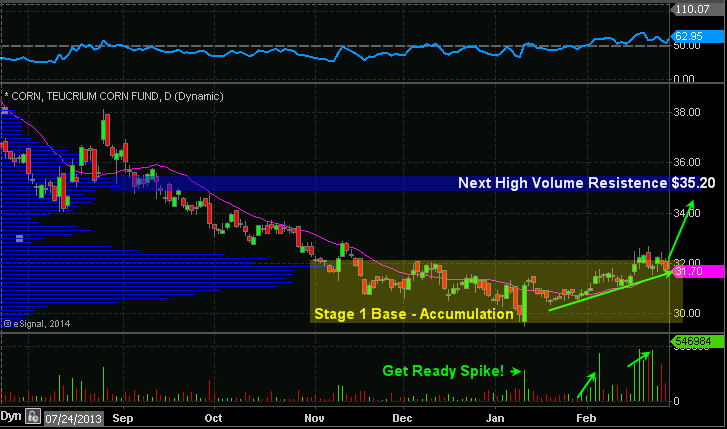
While most of the commodities have posted some solid gains, CORN has yet to pop in price. Corn looks to be forming a stage 1 basing pattern and the volume/money flowing into this fund suggest new money is moving into corn because it looks as though it will be the last to pop and rally in price.
This is similar to how we entered the silver trade a few weeks back. Everything else in the precious metals sector popped and silver lagged giving us a high probability setup.
Both the short and long term the charts of corn look bullish. As usual I will lock in some gains if we get a pop in the commodity, then let the balance ride with a break even stop. If corn is entering a new bull market phase (Stage 2) I want to hold some long term. There is potential for a 19%-30% rise in value.
During the past couple weeks we have seen the CORN ETF trade sideways with fading volume. Recently we have seen a couple strong buying days in CORN which I call GET-READY spikes. These typically indicate some big money (insiders) are accumulating a position ahead of good news.
We are currently long CORN already and in the money, which is why I like this second setup even more. Because we already have a profit buffer, making the risk here is lower than normal. If you have ready some of the market wizard books you will also pickup on how the most successful traders pyramid up (average up) in winning trades.
My Plan Of Attack: I only want to buy on strength here focusing on entering the trade once is breaks a previous pivot high which in this case is: $34.06
Trade Setup:
Place a Buy-Stop order at $34.06, GTC (Good Till Canceled), 8% of portfolio position size
This type of order will enter you into the trade if price rallies and breaks that price point so you do not need to sit around and watch the charts. If you do not know this type of order just Google it only or call your broker. It is a very simple and basic order type.
________________________________________
ETF Trading Newsletter – CORN ALERT #3
CORN Position Added
This afternoon our CORN trade order was executed. Yesterday we set a Buy-Stop order so we get entered the commodity if price starts to breakout to the upside. These types of order are just like a stop order in respect that you just enter it and the market and broker do all the work after that.
This is why trading with a plan/strategy is much easier and less stressful. If you have a plan, do the leg work and execute it, things do not seem difficult or stressful. Problem is most traders don’t have a plan and even if they do, most times they don’t follow it. The result is a confused, stressed out trader/investor second guessing their every move.
I have updated the portfolio in the member’s area so you can review positions and protective stops.
________________________________________
ETF Trading Newsletter – CORN ALERT #4
CORN Position Adjustment – Locking in Gains
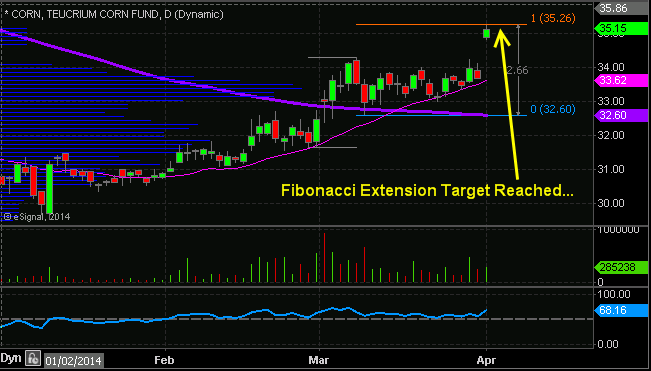
CORN has been moving in our favor for about a month now. Today’s pop in price has reached my short term measured move using fibonacci extensions and I feel it is time to lock in some gains and move our protective stop to breakeven.
We entered this position twice and your average price per share should be around $32.96.
I am moving my stop to breakeven and selling half of my position today. Current price is $35.10, as we are up 6.5%.
See chart below for a visual:
________________________________________
Why You Need My ETF Trading Newsletter as a Self-Directed Trader
You know it and I know it, trading is extremely difficult, time consuming and can be expensive if not done properly. What I have shown you above is verbatim of what subscribers to my ETF Trading Newsletter received thus far for the corn trade.
I do updated and show the charts live each day in my daily video forecast which members have access to but that is just to keep everyone up to speed on the trade to help manage their emotions and prepare for what it to happen before it happens.
https://thegoldandoilguy.com/wp-content/uploads/2014/04/corn-etf-crop.jpg201251adminhttp://www.thegoldandoilguy.com/wp-content/uploads/2014/11/tgaoglogo.pngadmin2014-04-04 16:25:322014-04-04 20:23:25ETF Trading Newsletter: Live Trade of the Month – It’s a bit Corny
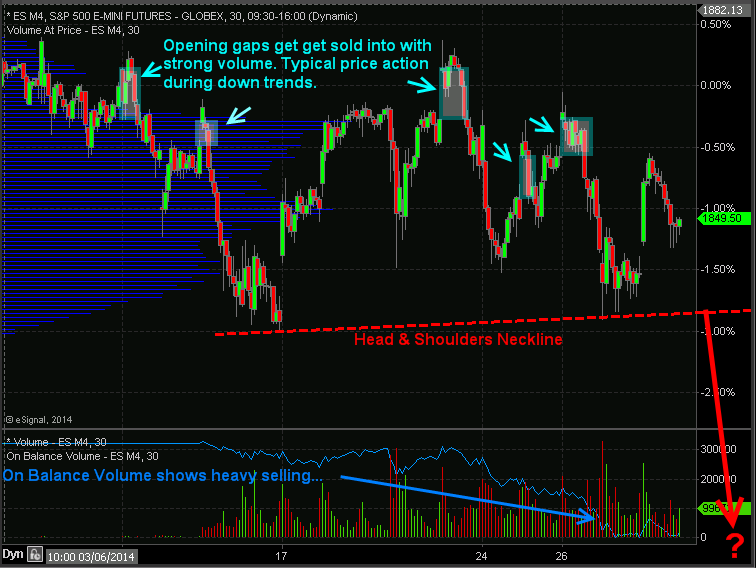
Index ETF Trading Strategies: Stocks have kick started this week with a 0.85% pop in price but the big question is if the market can hold up. Last week stocks repeatedly gap higher and sold off with strong volume telling us that institutions are slowing phasing out of stocks (distribution selling) unloading shares into strength and passing them onto the a average investor to be left holding bag.
I want to show you a couple charts which show the price action, volume and money flow of the SP500 so you have a visual of what I am talking about.
In the chart below you can see the price gaps followed by selling. Why is this important? It is important because during a down trend the market makers and big money plays who have the money and tools to manipulate the markets will allow the market drift higher or they will run price up in overnight or premarket trading when volume is light. Once the 9:30am ET opening bell rings volume and liquidity spike which allows the big money player to sell remaining long positions and or add to short positions they have.
If you look at the blue on balance volume line at the bottom of the chart you can clearly see that more contracts are being sold than bought which is typically an early warning sign that the market is about to fall farther.
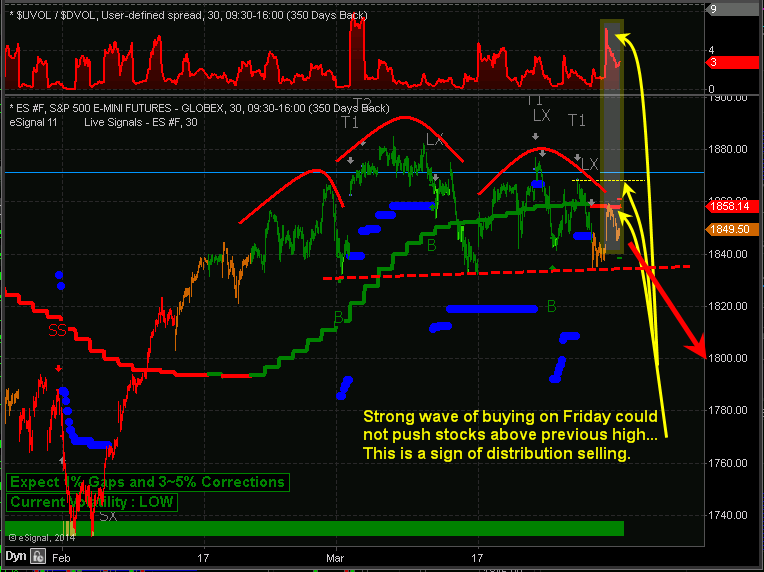
Automated Trading System – 30 Minute ES Futures Chart
Below is a marked up screen shot of my automated trading system which I use for timing both futures and ETF trading strategies. The color coded bars tell you the market trend along with the strength of buyers and sellers.
When you couple market cycles, trends, volume/money flow, along with chart patterns we can forecast and trade markets with a high degree of accuracy in terms of market direction and timing. Ross Clark & I talk about cycle analysis, market stages etc… which you can listen to live here:http://talkdigitalnetwork.com/2014/03/this-week-in-money-129/
My Index ETF Trading Strategies Conclusion:
Just to be clear on the current market trend and my overall outlook let me explain a little more. Overall, the broad stock market remains in an uptrend. Thursday and Friday of last week we started getting orange bars on the chart telling us that cycles, volume, and momentum are now neutral. It’s 50/50 on which way the market will go from here, so until the market internals (cycles, volume, breadth) push the odds in our favor enough for a short sell trade or a new long entry we will not add new positions to our portfolio.
It is important to understand that nearly 75% of stocks/investments move with the broad market. So we don’t want to add more long positions when the odds are not in favor of higher prices. Trading in general is not hard to do, but creating, following, executing properly money and position management is. If you have trouble with following or creating an ETF trading strategy you can have my ETF trading system for rising, falling and sideways markets traded automatically in your trading account.
Chris Vermeulen
www.TheGoldAndOilGuy.com
www.AlgoTrades.net
https://thegoldandoilguy.com/wp-content/uploads/2014/03/quantitative-investing.jpg213237adminhttp://www.thegoldandoilguy.com/wp-content/uploads/2014/11/tgaoglogo.pngadmin2014-03-31 19:23:132014-04-01 00:23:57SP500 ETF Trading Strategies & Plan of Attack for This Week


 Back on April 9th I posted a short tutorial on
  Gold Forecast: During the past year there has been very little talk about gold, silver or gold stocks in the media. Yet the year before it was all the media could talk about and they even had the price of gold streaming live all day in the corner of the tv monitor.