VIDEO ANALYSIS: Gold is on the move but is this the buy point we have been waiting for?
Watch Video On YouTube: http://youtu.be/kgitUsjcGr4

VIDEO ANALYSIS: Gold is on the move but is this the buy point we have been waiting for?
Watch Video On YouTube: http://youtu.be/kgitUsjcGr4
The energy sector has surged during the last two months which can be seen by looking at the XLE Energy Select Sector Fund. If crude oil continues to climb to the $112 level, XLE will likely continue to rally for another few days or possibly week as energy stocks are considered a leveraged way to play energy price movements.
Another way to look at this info is through the USO United States Oil Fund. This tracks much closer to the price of oil. The only issue is that many ETFs that “try to track” an underlying commodity is in how the funds are built. They own multiple contracts further into the future which does not exactly provide us with the short term news/event driven price movements in the current front month contract as they should.
What does this mumbo jumbo mean? Well, it means funds like USO and the highly respected UNG, and VIX ETFs… (just joking about the highly respected part), fail to track the underlying commodity or index very well when it comes to short term price movements. This means, you can nail the timing of a trade, and the commodity or index will move in your favor, yet your fund loses money, or goes nowhere…
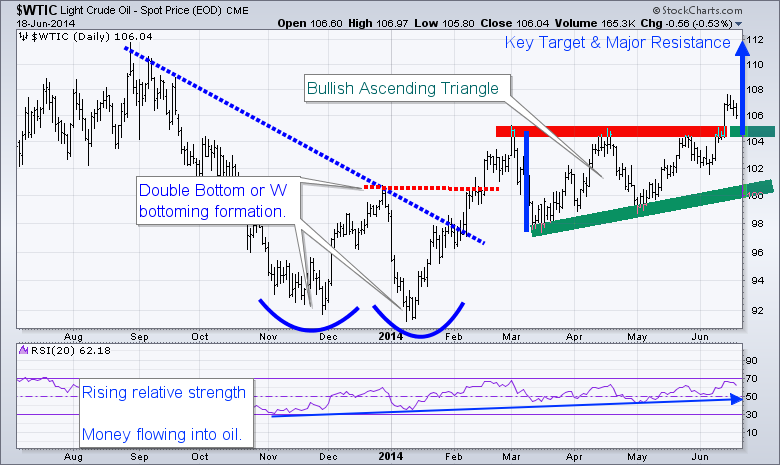
WTI crude oil has formed a bullish ascending triangle pattern from March to May of this year. The breakout to the upside is bullish and should be traded that way until the chart says otherwise. This breakout and first pullback must hold, or I will consider it a failed breakout. So if price dips and closes 2 days below the breakout level, it will be a major negative for oil in my opinion.
The range of the ascending triangle provides us with a measured move to the upside which is $112. Typically the first pullback after a breakout can be bought. The first short term target to scalp some gains would be $109, and at that point moving your stop to breakeven is a wise decision. Trading is all about managing capital and risk, if you don’t, then the market will take advantage of your lack in discipline.
Looking further back on the chart, you can see the double bottom formation also known as a “W” formation. Once the high of the “W” formation is broken the trend should be considered neural or up.
Also note that the RSI (relative strength) has been trending higher for some time now. This means money is rotating into this commodity. This is in line with my interview this week with Kerry Lutz and my recent article talking about the next bull market in commodities and the TSX (Toronto Stock Exchange).
In short, oil has some extra risk around it. The recent move has been partly fueled by news overseas. So at any time oil could get a lift or take a hit by news that hits the wires. I tent to trade news related events with much less capital than I normally do because of this risk.
Happy Trading!
Chris Vermeulen
CEO & Founder
AlgoTrades.net
TheGoldAndOilGuy.com
Commodities in general have been under pressure for the last couple years. This can be seen by looking at the GCC Greenhaven Continuous Commodity ETF which holds a basket of resources.
The weekly chart has formed a bullish bottom pattern, and as of last January it looks as though it’s now building a basing pattern. Overall commodities are in the very early stages of a stage 1 basing pattern and it looks as though it will be a few more months before any significant breakout will occur. But there could be some early entry points if you know what to look for…
A few days ago I talked about how commodities tend to perform well near the end of a bull market in the United States stock market. I also pointed out which hot index was going to benefit from this.
Read Commodity Index Report: http://www.gold-eagle.com/article/gold-and-oil-fuel-canadian-stock-market-rally
In this article I want to bring your attention to the steel market. Using the SLX Steel ETF you can clearly see the bottoming pattern and basing pattern for this commodity.
Currently steel is underperforming the stock market and is vulnerable to lower prices. But if we see a few things come together in the coming days or weeks, this could be a screaming buy.
SLX has formed a bottoming pattern from January – mid March. It has since put in a strong impulse rally to make a higher high, and is now consolidating above key support. The RSI (Relative Strength) remains in a down trend, but if this starts to rise and SLX breaks above its recent highs around the $47.75 level I feel steel will start to rally with $50 being the next major whole number and previous high for steel to find some resistance.
Also price has been riding along the 200 day moving average which is acting as support. If price closes a couple of days below the 200 moving average I would consider this to be a bearish sign.
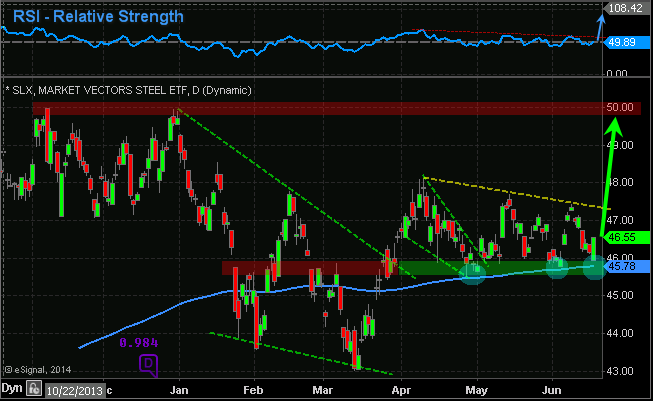
In short, we are looking for the relative strength to start making new highs. Also we want to see a reversal bar on the SLX chart to the upside which we got on Tuesday. Or you can wait for a breakout and close above $47-48 area. Stop would be somewhere around the $45.75 area to start, then raise it as price rallies using intraday pivot lows on the 30 minute chart.
GET THESE REPORTS DELIVERED TO YOUR INBOX FREE: www.GoldAndOilGuy.com
Chris Vermeulen
Disclaimer: I do not own shares of TAN as this point, but may buy some in the near future.
During the past couple months several indexes, sectors and commodities have sold off more than 10 – 20%. But now some are looking like new buying opportunities. Over the next week I will bring a few of these trades to your attention as they start to unfold.
Today we are looking at the TAN solar ETF. This sector recently had a 23% hair cut in price. A 20-25% correction in price is a typical intermediate correction for a fast moving sector. The price correction has pulled the sector down to its 150 and 200 simple day moving averages. These levels tend to act as long term support for investors, a buying point.
Many of the individual stocks within this sector are starting to pop and breakout of bullish price patterns. These individual stock prices point to higher prices for TAN going forward.
Be aware of crude oil…. I do think that as long as the price of crude oil stays up solar stocks will continue to rise overall. But if oil starts to roll over and break down, TAN will struggle.
My Technical Take on The Chart:
Big picture analysis shows a powerful uptrend with bullish consolidation.
Intermediate analysis shows a falling bullish wedge, test of moving averages, and a reversal breakout pattern.
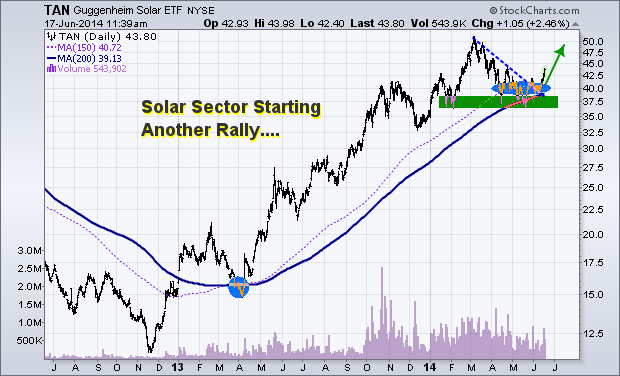
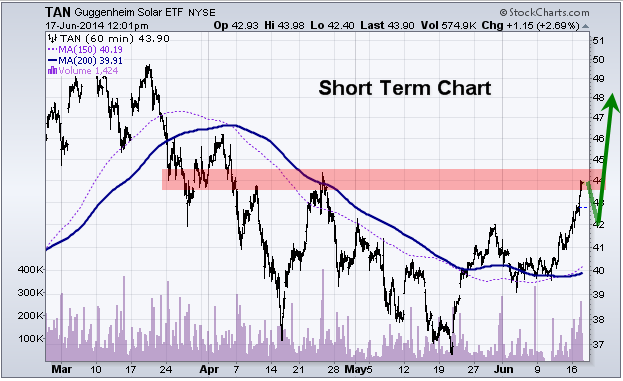
Short term analysis shows we are at a resistance level and we will likely see a pause of pullback over the next few days before it goes higher.
TAN Trading Conclusion:
If price closed back below the $39.00 I would consider this bounce/rally failed.
Get My Trade Ideas Delivered To Your Inbox FREE: www.GoldAndOilGuy.com
Chris Vermeulen
Disclaimer: I do not own shares of TAN as this point, but may buy some in the near future.
Here is my market forecast for precious metals and this weeks trade setups.
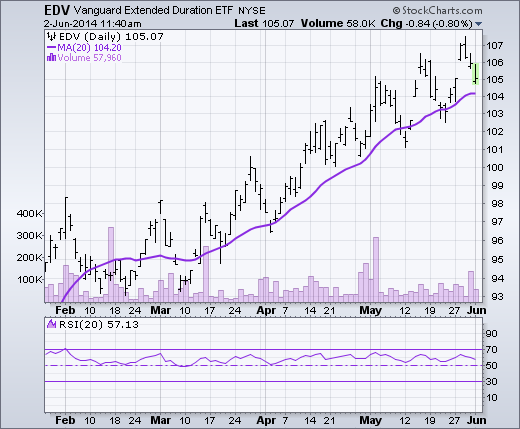
Here are a couple of my market forecasts for bonds, dollar, euro, gold, silver, mining stocks and the broad stock market.
VIDEO FORECAST
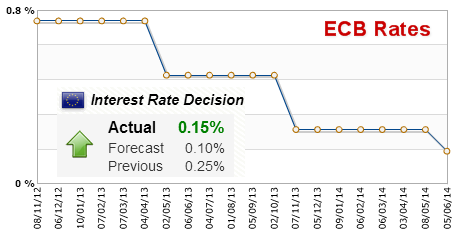
The six members of the European Central Bank (ECB) Executive Board and the 16 governors of the euro area central banks vote on where to set the rate. We watch interest rate changes closely as short term interest rates are the primary factor in currency valuation.
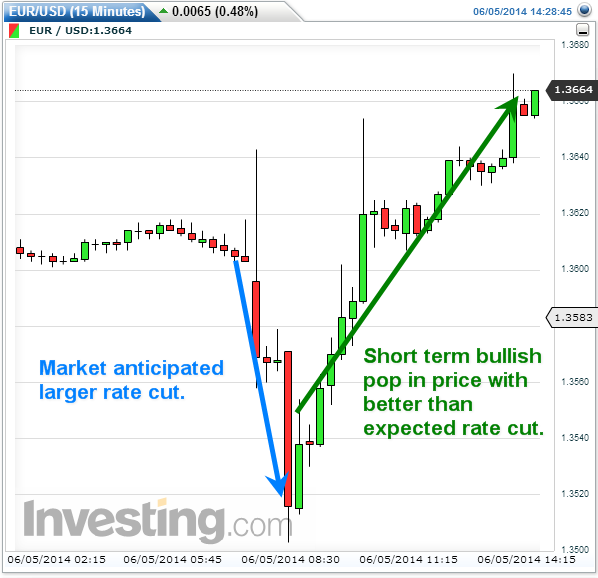
A higher than expected rate is positive for the EUR, while a lower than expected rate is negative for the EUR. Today (Thursday June 5th) we expected a rate cut. The cut was not as much as analysts expected which is bullish for the short term, but the rate is still declining and nearing zero, or even worse, negative territory.
A negative interest rate may sound crazy or impossible, but it’s already happening in Denmark.
Europe is already in a deflationary state and central banks are doing everything they can to bring about inflation by cutting rates and devaluing the euro.
This will cause a ripple through multiple asset classes and will drastically alter the outcome of individuals worldwide.
Just imagine if you had to pay a bank to hold your money and you do not earn any interest but rather pay interest.
People who have been saving their entire lives will get hit the hardest. Retired folks will stop earning money and start paying for all the money they hold held at banks.
Individuals will go more into debt because money will be extremely cheap to borrow.
Price of assets like equities, real-estate, discretionary goods will rise because the cheap money everyone is borrowing will be used to buy more stuff. While all this happens everyone takes on more dept. It is a brutal spiral leading to increase debt levels, inflation and eventually bankruptcy.
If the euro dollar starts to decline at a quicker pace the US dollar will likely rally. A strong dollar could affect the commodities market including gold, silver and the European stock markets.
Today’s rate cut led to a pop in the euro, but that is likely to be short lived. I hope this sheds some light on the markets and helps in your trading.
Chris Vermeulen
P.S. In the next few days member’s and myself will be looking to enter some trades based round this analysis. See Premium Trading Video & Newsletter
Sincerely,
Chris Vermeulen
www.TheGoldAndOilGuy.com
www.AlgoTrades.net
Read Special Big Bond Report here: http://www.gold-eagle.com/article/bonds-lead-gold-silver-will-follow
Chris Vermeulen