Chris sits down with David Lin from Kitco News to discuss the recent runs in the different stock market sectors and the largest upside potential in 2022.
Spend a bit of time with Chris and David as they discuss market strategy. Learn whether:
buying and holding the dips is a good idea.
buying into fear or selling during euphoria is as hard as it sounds.
altering your perspective will help you become a better trader/investor.
adhering to your strategy rules will help or hinder your end results.
STOCK MARKET SECTOR ROTATION
The overall feeling Chris Vermeulen has regarding the stock market is that the energy sector may be losing steam while technology, gold, silver and their miners are beginning to draw attention and investment. The economic concerns facing China and the US, in particular, are creating a situation where the stock market and gold are climbing in value at the same time.
“Stock market levels,” he says, “are determined by how we get to the lofty levels”. Parabolic moves to the upside are more likely to crash back down to earth than they are to continue their flight. If the rally takes longer and moves slower, it is more likely to chop around and then stabilize. This can offer a stronger position from which an uptrend can begin.
TO LEARN MORE CLICK ON THE IMAGE BELOW TO WATCH THE INTERVIEW
GET YOUR DAILY DOSE OF CHRIS’S SILVER AND GOLD ANALYSIS ALONG WITH THE HOTTEST ETFS TO TRADE WITH BAN TRADER PRO!
https://thegoldandoilguy.com/wp-content/uploads/2021/11/kitco.png187400adminhttp://www.thegoldandoilguy.com/wp-content/uploads/2014/11/tgaoglogo.pngadmin2021-11-15 10:09:362021-11-15 10:09:45Kitco Gold Forecast & Stock Market Video
Since the start of the COVID-19 virus event, Gold has rallied more than +26% to reach highs near $2090 on August 7, 2020. Yet, over the past 15 months, Gold has been trailing downward in a sideways price pattern. This price rotation has set up a very broad Pennant/Flag formation in Gold that has recently reached the APEX of the Flag setup.
This is very important for two reasons. First, as the global central banks begin to plan and prepare for more normalized monetary policy, and address credit excesses and inflationary price concerns, the advantages of Gold as a hedging instrument become more valuable. Secondarily, after a massive rise in asset prices and an even bigger global attempt to stimulate the economy after the COVID-19 virus event, the world has never been in this scenario. Near-zero interest rates, excessive amounts of money and credit throughout the world, asset prices showing near hyper-inflation trends, and the global central banks taking very little action to address any future economic concerns.
The Luster Of Gold May Be Growing For Global Investors
The luster of Gold over the past 15 months has slightly diminished. Global central banks, corporations, and consumers jumped into the easy money rally and ignored ongoing risks. Now, China’s economic concerns and corporate debt issues continue to plague the global markets. Investors are suddenly waking up to the potential of rising global risks over the past 12+ months – not subsiding.
Recently, China’s economic and credit/debt issues have spilled over into more broad market concerns. What used to be more of a junk-rated debt issue has now transitioned into more of a global concern as China’s demand for cheap credit over the past 8+ years may have created the components of a perfect storm in the making (source: Yahoo! Finance).
I published research articles about this many months ago – which are still relevant.
After reviewing some of my earlier research posts, I urge you to consider a unique situation that may be taking place in the global markets right now. I believe the US markets have transitioned into a new Depreciation Cycle Phase (started near the end of 2019). As the US Dollar continues to try and hold above the $90~$91 level, we may be entering a foreign market economic crisis prompted by US easy money policies over the past 12+ years. If this is the case, then the US stock market and the US Dollar may continue to show strength well into a foreign market collapse – also while Gold and Silver start to move higher.
What Could Happen Next
This type of event will eventually spread into the US markets as concerns mount related to the depth and cross-border economic issues if any economic contagion event continues. Yet my thinking is that initially US assets, and the US Dollar, may rise as global traders/investors move away from global/Asian market risks and pour capital into safer US stocks and the US Dollar. This may prompt a rally phase in the US stock market and push the US Dollar above $95~96 briefly before traders realize the full scale and scope of this potential global crisis in the making.
This Daily Gold chart highlights the extended Pennant/Flag price formation and how Gold has started to see increased trading volume in what appears to be an upward price breakout. Still, Gold must break above two key levels before considering this potential rally phase confirmed: $1845 and $1920.
Fibonacci Price Extensions Show $2600 As A Potential Price Target For Gold
This Weekly Gold chart highlights a longer-term Fibonacci Price Extension pattern. It suggests that $2240 and $2600 are likely to be price targets for Gold if this rally continues. Many traders believe the last 15+ months of sideways trading in Gold has formed a “handle” for a bigger “cup-n-handle” price pattern. Ideally, I would like to see a Gold rally above $1925~1940 before attempting to confirm the “cup-n-handle” pattern.
My interpretation of the global markets and Gold is just as I stated above. Gold is starting to become more interesting for global investors as the China debt/economic crisis continues. Risks are mounting if the economic contraction in China/Asia continues. Global risks are already excessive after 24+ months of extended global central bank functions, easy credit, and increasing inflation. As a result of inflation, pricing pressures will eat away at profits for many firms. Slowing consumer demand could blow a big hole in demand for many assets.
Traders should prepare for a bout of price volatility headed into the end of 2021 as these issues continue to work themselves out. My technical analysis suggests this rally may continue into early January 2022. My cycle analysis indicates a change in price trend may initiate after January 18th or so. Yet, I also believe this potential rally in Gold may be just starting, and global concerns may be festering while the US stock market rallies. This is because global traders are piling into US assets/stocks while attempting to avoid economic/debt concerns in other world areas.
Gold will continue to react to this new concern and fear as it populates in traders’ minds. The luster of Gold will likely continue to grow – which may push Gold above $1950 before the end of 2021. Time will tell.
Want To Learn More?
Follow my research and learn how I use specific tools to help me understand price cycles, set-ups, and price target levels. Over the next 12 to 24+ months, I expect large price swings in the US stock market and other asset classes across the globe. I believe the markets are starting to transition away from the continued central bank support rally phase and may form a revaluation phase as global traders attempt to identify the next significant trends. Precious Metals will likely start to act as a proper hedge as caution and concern drive traders/investors into Metals.
Please take a minute to visit www.TheTechnicalTraders.com to learn about our Total ETF Portfolio (TEP) technology, and it can help you identify and trade better sector setups. We’ve built this technology to help us identify the strongest and best trade setups in any market sector. Every day, we deliver these setups to our subscribers along with the TEP system trades. You owe it to yourself to see how simple it is to trade 30% to 40% of the time to generate incredible results.
Chris Vermeulen
www.TheTechnicalTraders.com
https://thegoldandoilguy.com/wp-content/uploads/2021/11/Chart_21-11-08_GC_D_1.png572850adminhttp://www.thegoldandoilguy.com/wp-content/uploads/2014/11/tgaoglogo.pngadmin2021-11-11 08:00:432021-11-11 08:00:46Gold Reaches 15-Month Flag Apex
Protecting Yourself with GOLD, Oil and Index ETF’s
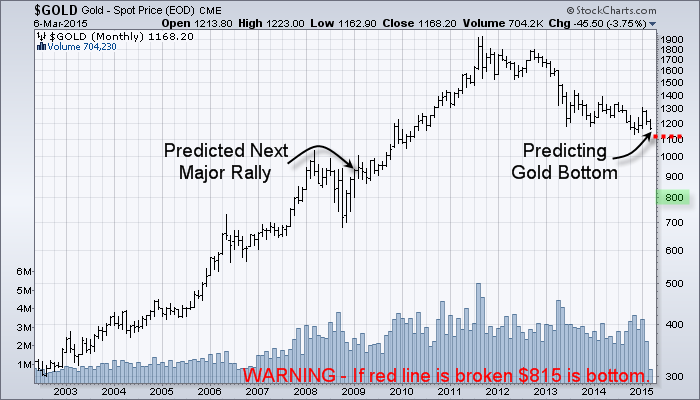
In 2009 I shared my big picture analysis, investment forecast and strategy in a book called “NEW WORLD ORDER ECONOMICS – What you can do to protect yourself”. In January 2009 I forecasted that the Dow Jones Industrial Average was going to make a bottom within a couple months which it did. I also predicted the price of gold to start another major rally, and for crude oil to bottom and rally for years, which were also correct.
You can call it luck, skill or a mix of both… but the truth is that the markets cannot be predicted with 100% certainty. With that said, the US stock market, gold and oil look to be setting up for their NEXT BIG multiyear moves.
GOLD BEAR MARKET IS ABOUT TO END
Gold and silver have a little trickier of a situation to navigate and invest for maximum returns over the next 2+ years.
The most important thing to realize is that when a full blown bear market starts virtually all stocks and commodities drop including gold, silver and oil. Knowing that, investors must be aware that when the stock market starts its bear market the fear will rise and investors will inevitably sell their holdings and this means we could see gold and oil continue to fall much further from these levels before a true bottom is in place.
Is this time different than the 2008/09 bear market? Yes, this time we have possible wars starting, oil pipelines overseas being cut off, counties and currencies failing and even negative bond yields in some parts of the world – it’s a mess to say the least. There are a lot of things unfolding, most seem to be negative for the economy.
The currency problems and possible war breakout will be bullish for gold and oil. So if a bear market starts in equities, and a war or currency fails gold and oil should rally while stocks fall.
But if we don’t have those sever crisis’ then if gold and oil break below their critical support level which is the red line on the charts and a bear market in stocks start you do not want to be long stocks or commodities.
I have drawn a line in the sand for gold at $1050. If this level is broken then $815 per/ounce is not out of the question. It seems everyone is bullish on precious metals and have been buying like crazy. But as I wrote in 2009 this bullish sentiment actually pointing to much lower prices if support is broken.
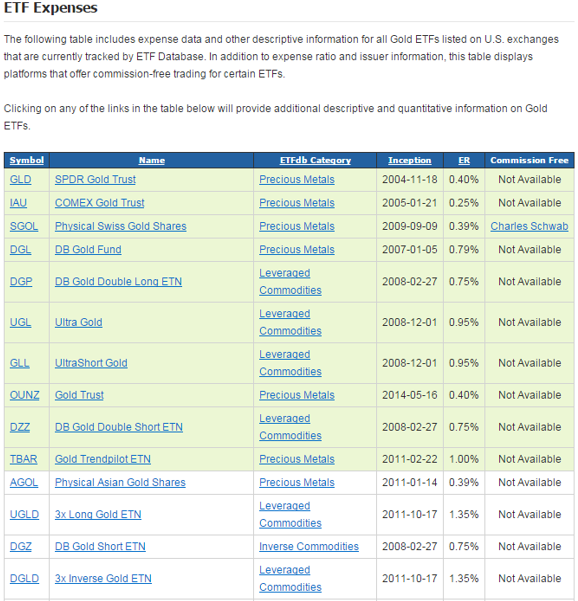
Below are some ETFs that can be used to take advantage of rising gold prices. While there are other funds that cover gold miners I feel they may not perform well during the equities bear market. Investing in physical gold is the best play at this stage of the game but when the equities bear market looks to be nearing an end, gold mining stocks will be the best place to be.
PART 2 CONCLUSION:
In this article we talked about gold and gold stocks which are showing signs of a major bottom being put in place this year. And in the next article PART 3 I will who you what to expect long term for crude oil, how we are up 28% in our short oil trade, and how you can play this multi-year cycle bottom when the time is right.
In the meantime, be sure to join my Free Newsletter so that you receive PART 3 along with more trade ideas: www.GoldAndOilGuy.com
Chris Vermeulen
https://thegoldandoilguy.com/wp-content/uploads/2014/05/gold-predictions.png141171adminhttp://www.thegoldandoilguy.com/wp-content/uploads/2014/11/tgaoglogo.pngadmin2015-03-18 13:31:342015-03-18 13:40:02THE NEXT FINANCIAL CRISIS – Part II
Here is my gold prediction (silver and gold mining stocks, should be the same) looking forward 24 months.
Since the top in gold in 2011 gold has selling off. Depending on how you analyze the market, this 3 year sell off could be seen as consolidation within a major cyclical bull market or that it’s in a bear market. But know this, either way, the outlook is bullish, and all gold has to do is find a bottom here and rally above the $1400 per ounce level. This would kick start a major feeding frenzy of gold buying.
Gold bear market in the past have on average corrected 33% and lasted a total of 550 days. So if we look at the stats of the current pullback in gold it has dropped 38% and about 700 days long. Time for a bottom and bull market? It sure seems like it.
You can see my recent report on the US Dollar and gold forecast.
Gold Prediction Technical Outlook:
Gold remains in a down trend, but looks to be starting a possible stage 1 basing pattern. Technical analysis is pointing to strength as the MACD moving higher, relative strength, and the down trendline show price and momentum being bullish.
A few weeks ago the chart completed a Golden Cross. This is not shown on the chart, but it is when the 50 SMA crosses above the 200 SMA. Investors tend to look at this as a major long term buy signal, although I do not use it for any of my analysis or timing of the market.
If historical data, statistics, and technical analysis prove to be correct we can expect gold to rise. My gold prediction is for price to reach $2300 – $2500 per ounce within 24 months.
Gold Prediction Conclusion:
The average gold bull market last roughly 450 days and posts a gain of 95%. So with the current correction which is beyond these levels already, expect price to firm up this year and complete the stage 1 base.
Note that until gold breaks out of its Stage 1 Basing pattern, I will remain bearish/neutral on the metal. There is a huge opportunities else where unfolding…
Join my email list FREE and get my next article which I will show you about a major opportunity in bonds and a rate spike – www.GoldAndOilGuy.com
Chris Vermeulen
https://thegoldandoilguy.com/wp-content/uploads/2014/05/gold-predictions.png141171adminhttp://www.thegoldandoilguy.com/wp-content/uploads/2014/11/tgaoglogo.pngadmin2014-05-14 18:18:282014-05-14 18:18:28Gold Prediction using Statistics & Technical Analysis


 In 2009 I shared my big picture analysis, investment forecast and strategy in a book called “