Chris Vermeulen & JW Jones – www.OptionsTradingSignals.com

Silver and copper have recently been going through their own private bear markets. Since the open on September 1st, silver futures have sold off by more than 25%. During the same time frame, copper futures sold off by around 24%. Both metals are extremely oversold, but lower prices are still possible.

Are the bear markets in copper and silver an attempt to warn market participants that slower economic condition are ahead? Are equities going to take a huge hit on slower future growth?

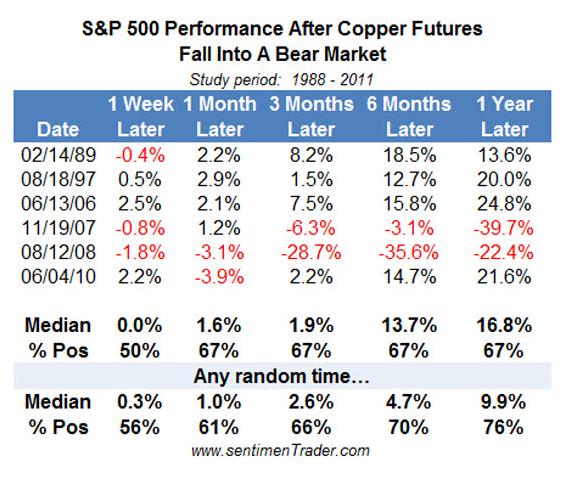
The notion that lower copper prices will precede a stock market selloff is generally an unfounded allegation. Recently Jason Goepfert of SentimentTrader.com produced the follow table illustrating the returns of the S&P 500 immediately following a bear market in copper over the past 25 years:

The chart above is additional proof that a massive selloff in copper does not necessarily have a major impact on the returns for the S&P 500. However, I would remind readers that volatility in commodities generally precedes volatility in equities.

Precious metals may be getting close to a possible intermediate term bottom. Silver and copper futures are extremely oversold based on a variety of indicators. However, the key to future price action likely will revolve around the price action in the U.S. Dollar Index.

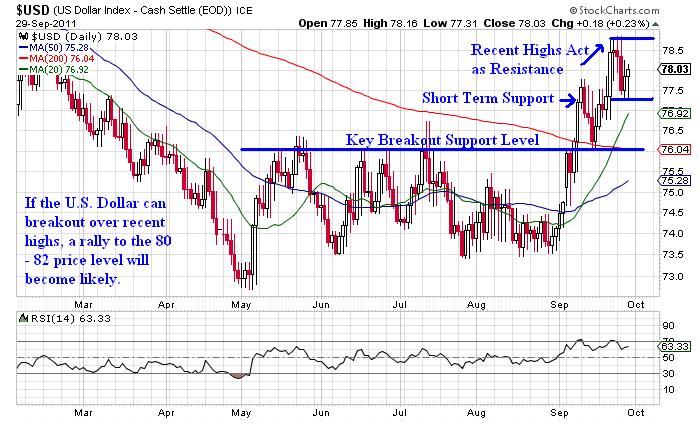
The U.S. Dollar Index has been ripping higher throughout most of September. The rally in the Dollar is placing pressure on risk assets such as equities, precious metals, and oil. The daily chart of the U.S. Dollar Index is shown below:

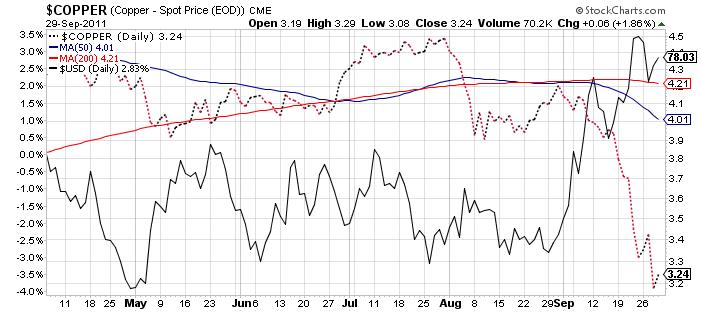
So far the U.S. Dollar Index has been held back by the $79 price level which has been acting as resistance, but if prices can breakout above recent highs it would not be shocking to see the U.S. Dollar Index test the 80 – 82 price range in the near future. A breakout would likely put additional pressure on silver and copper prices. The two charts below illustrate the recent correlation between silver and copper prices and price action in the U.S. Dollar Index:

Silver : Dollar Correlation

Copper : Dollar Correlation

Additionally the S&P 500 could break below the August lows and oil could follow suit if the Dollar continues to work higher above recent resistance. If October turns out to be an ugly month for risk assets as pundits have predicted, then the U.S. Dollar will likely perform relatively well in the intermediate future.

Clearly there is political risk coming from Europe which could alter price action in risk assets in a variety of ways. Financial markets are volatile across the board and large intraday price swings are becoming common place.

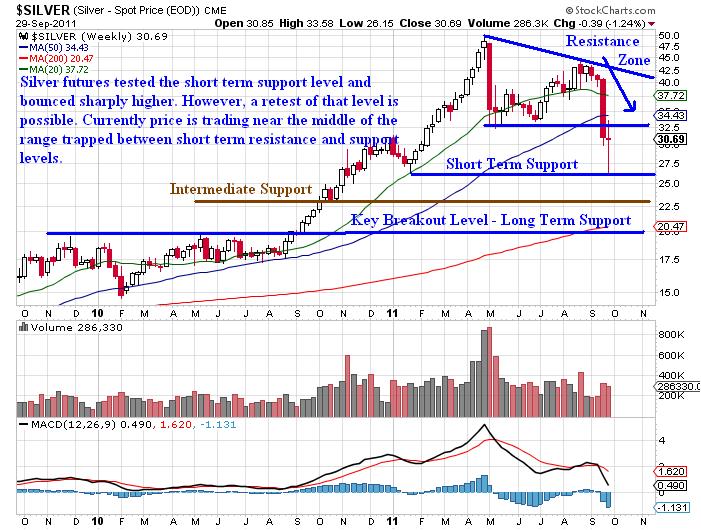
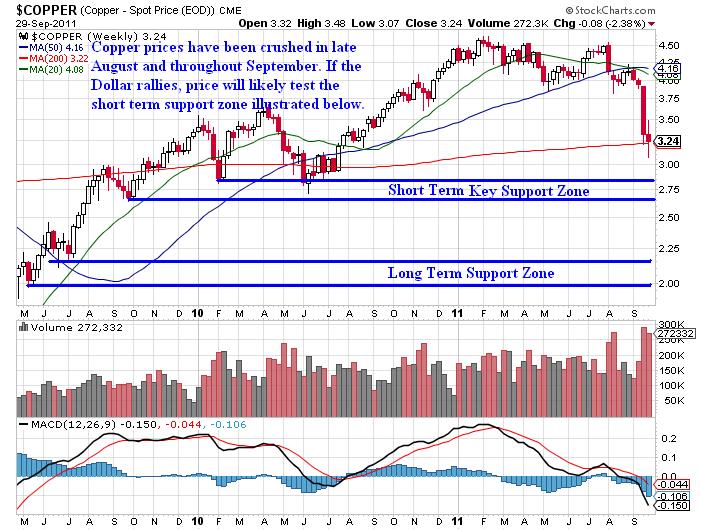
In many cases the headlines will have more impact than the fundamentals or the technicals in this type of trading environment. However, the longer term support and resistance levels should hold sway even during times of exacerbated volatility. The weekly charts of silver and copper futures are shown below:

Silver Weekly Chart


Copper Weekly Chart

Clearly the price action in silver and copper in late August and throughout September has been ugly. Both metals are oversold in nearly every time frame, however if the Dollar continues to strengthen we could see deeper declines in both silver and copper prices as illustrated in the charts above.

Currently fundamentals and technical analysis cannot be relied upon solely when making trading decisions. However, the longer term support and resistance levels derived from the charts above give informed traders areas that offer solid risk / reward exits for profit taking and entries for those looking to get long silver and copper.

Trading Conclusion:

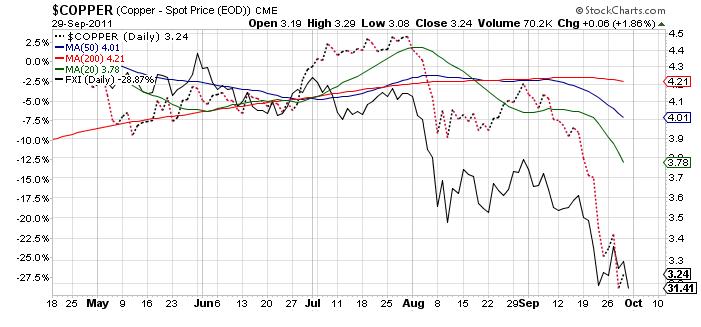
The data provided above regarding equity returns after a bear market in copper are sufficient enough to state that lower copper prices do not necessarily project lower domestic equity prices in the United States. With that said, the correlation between the price of copper and the IShares FTSE China 25 Index Fund (FXI) is irrefutable. Lower prices recently in copper are directly correlated in the price action of the FXI China Index fund as shown below:

FXI China Index Fund : Copper

The recent price action in the FXI China Index fund is ugly to say the least. As shown above, if the U.S. Dollar continues to strengthen copper, silver, and the FXI will likely continue to trade lower. Clearly the recent price action in Chinese markets is concerning for domestic equity investors, but an economic statement released earlier today is an ominous signal in the immediate future for U.S. equity investors.

On Friday the ECRI (Economic Cycle Research Institute) came out with a statement that the U.S. economy is headed for a new recession that the U.S. federal government cannot prevent. Data is starting to show signs that a new recession is not only possible, but quite likely in the near future. One of the key underlying assets to monitor for future clues about price action in risk assets is the U.S. Dollar. In coming weeks and months, I will be monitoring the U.S. Dollar closely. I think it would be wise if you did as well. Headline risk is increasingly high!

Subscribers of OTS have pocketed more than 150% return in the past two months. If you’d like to stay ahead of the market using My Low Risk Option Strategies and Trades check out OTS at www.OptionsTradingSignals.com and take advantage of our free occasional trade ideas or a 66% coupon to sign up for daily market analysis, videos and Option Trades each week.

This material should not be considered investment advice. J.W. Jones is not a registered investment advisor. Under no circumstances should any content from this article or the OptionsTradingSignals.com website be used or interpreted as a recommendation to buy or sell any type of security or commodity contract. This material is not a solicitation for a trading approach to financial markets. Any investment decisions must in all cases be made by the reader or by his or her registered investment advisor. This information is for educational purposes only.

Chris Vermeulen – www.GoldAndOilGuy.com

Over the past week precious metal investors have had a wakeup call from their big shiny nest eggs. Last week’s free fall in both gold and silver spot prices was enough to get investors into a panic. More on this in a minute though…

The fall was triggered by three key factors which caused the powerful move down. The first factor is based on pure technical analysis (price and volume patterns). Because the metals had such a strong run up this summer and prices had moved to far too fast, it is only natural so see price correct back to a normal price level. In general any investment that surges in one direction in a short period of time almost always falls back down shortly after. As I stated in my weekly report on August 31st, gold is forming a topping pattern and all investors should take profits or tighten protective stops (exit orders)”. Three days later gold popped to the new high completing the pattern and was quickly sold off which continues to unfolding as we speak from $1920 down to $1532 in only a couple weeks.

The second factor which I think had the most power behind the drop were the margin requirements changes. This new rule literally overnight caused traders and investors holding to much of the metals in their account to liquidate (sell) their positions without having any say in the matter. That is when the most damage was done to the price of gold and silver.

The key factor was the US Dollar which rocketed higher and adding a lot of pressure to the metals. I also covered this in my Aug 31st report in detail. Overall, past few years we have seen both gold and silver move in opposite direction of the dollar. I don’t expect that to change much going forward. Back in August the US Dollar was coiling (building power) and it was only a matter of time before it would explode to the up side and rallied. This high probability move in the dollar was what triggered me to exit our long gold positions shortly after. I expected the dollar rally to last a month or more and that means we would see a lot of pressure on equities and metals going forward.

Now keep in mind, if Greece or other countries continue to get worse then we could see the dollar and gold move higher together as they are seen as the safe haven at this time. But with the nature of the two I am anticipating a rising dollar and sideways trading range for gold.

Ok, so back to precious metals investor sentiment…

Last Friday and all of this week I have been getting emails from traders and friends saying they are going to sell their gold and silver because they are concerned metals will continue to fall and because many of them are now losing money after chasing prices higher through the summer. The good news is that one of my best indicators for helping to time market tops and bottoms is to just read my emails and answer the phone. During market tops, generally the final month when prices are soaring to new highs every day/week is when everyone contacts me and says they just bought gold or are about to buy more gold cause it’s such a great investment. Once I start getting 2-5 of these messages a day alarms start going off in my head. This works the same with market bottoms. So with everyone now in a panic and selling their positions I feel we are darn close to one if we did not see it already…

Let’s take a look at the charts…

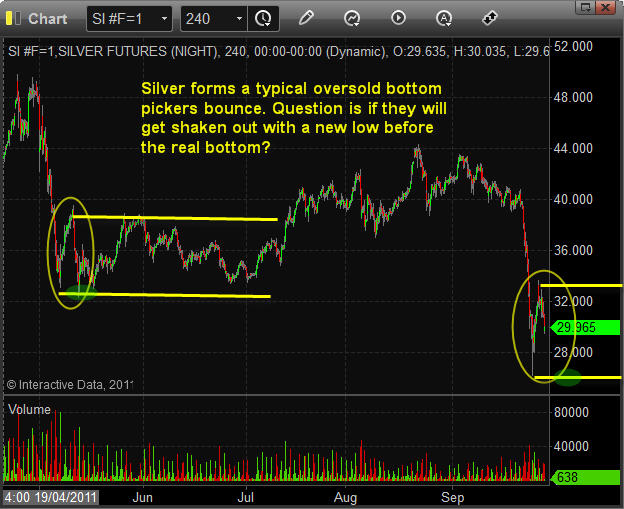
Silver Spot / Futures Price Chart

As you can see on the hard right edge silver is forming a very similar pattern which happened this past spring. I would like to note that this type of pattern is typical with extreme market selloffs as to how they generally bottom. I am anticipating silver trades in this range for a couple months and that we could see lower prices in the near term. But my upside target for silver in the coming few months is the $35-$36 level.


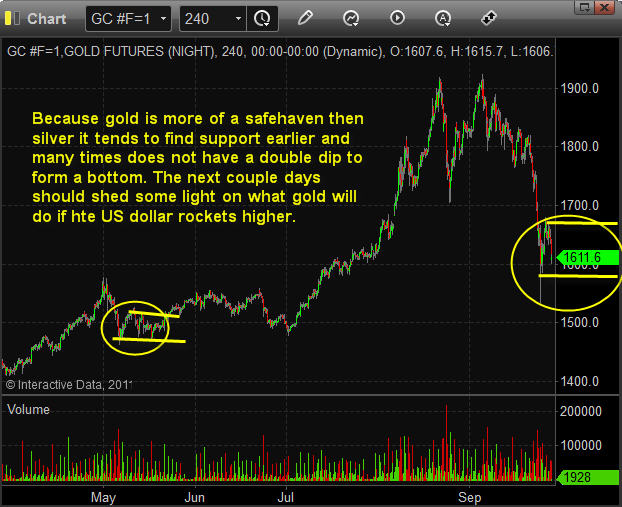
Gold Spot / Futures Price Chart

Gold is doing much the same as silver but I have noticed that when gold falls hard the second dip generally does not make a new low as often. If we do get a new low, all the better for buying on the dip but overall I feel gold should trade sideways for a couple months. My upside target for gold is the $1750-$1775 area.


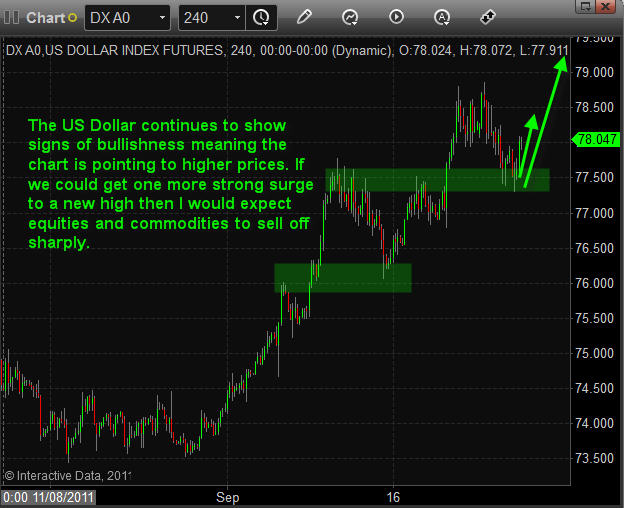
US Dollar Index Price Chart

The Dollar index is looking ripe for another bounce and possibly another rally to new highs in the coming week. If this happens then we should see the SP500 short position (SDS) which we took Tuesday afternoon (Sept 27th) to continue rocketing another 5-8% in our favour again.


Mid-Week Trading Conclusion:

In short, I feel the US dollar is going to continue higher and that will put the most pressure on stocks, oil and silver. Depending how things evolve overseas gold could hold up and possibly rise with the dollar.

So far subscribers have pocketed over 40% gains this month using ETFs on the SP500, Dollar and Oil and are holding another winning trade in the SDS etf taking partial profits today. If you would like learn more about etf trading and receive my daily pre-market videos, intraday updates and detailed trade alerts which even the most novice trader can follow then join my free trading education newsletter and my premium trading service here: http://www.GoldAndOilGuy.com

Chris Vermeulen – www.TheGoldAndOilGuy.com

A few weeks ago I wrote about how gold was starting to top and that everyone should expect a very sharp drop to the low $1600 area. How I came to this conclusion was though the use of inter-market analysis combining price patterns, gold futures volume, the dollar index and market sentiment. This allowed me to understand what the majority of other traders/investors were thinking and feeling. By knowing each of these market variables and crowd behavior I can accurately see into the future a few days with a high probability of success and most importantly with low downside risk.

You can view part-1 on how I properly forecasted that gold would fall sharply in August here: http://www.thegoldandoilguy.com/articles/dollar%E2%80%99s-on-the-verge-of-a-relief-rally-look-out/

At the time when I forecasted gold to reach the low $1600 area gold was still building the top pattern so I could not say how long a recovering would likely take nor did I know exactly when to re-enter a long position. But now that we have seen how gold arrived at my target price I can form a new forecast.

Spot Gold Price Forecast – Daily Chart:

The gold chart below clearly shows rising volatility along with my topping pattern of three surges to new highs. It was August 31st when I warned subscribers and my followers that gold was about to top and that everyone should be taking profits or at least tightening their stops to lock in gains. Only three days later gold topped and it has not stopped falling since.

On August 8th gold had a large opening gap to the upside. This means the price opened the next day much higher from where it closed the previous session. It’s important to note that gaps especially for gold almost always get filled within a couple months. Seeing this gave me a solid reason to think that gold should pullback to this level during the next big correction in price.

Also during the month of August gold had to pullbacks only to continue to make the third and final high. This told me that when the top is put in place was a very high probability that we see the price of gold drop below both of Augusts’ lows and that would trigger stop orders sending the market sharply lower.

Now that we are seeing the stops being flushed out of the market it means the majority of speculative traders have exited their positions. So speculative traders who caused the large surge in gold to take place are now out. Once all the speculative traders have exited which should take place in the coming weeks or two we can expect some type of bounce or rally. I will keep a close eye on the intraday charts for subscribers as we near a potentially major trade setup.

Where are we in this gold bull market?

Well I feel gold is more fairly priced between $1632- $1660 area. Currently gold is trading at $1660 but if things play out like I have seen in the past we just may get one more dip this week to the $1600 area before gold truly puts in a bottom. Because gold went from a new high all the way down to Friday’s panic selling washout instead of a controlled ABC correction I feel a bottom will be more of a one day event. This type of bottom carries more risk and is more difficult to time and trade. So scaling in with a small position at this level and adding on a drop to $1630 then $1600 could prove to be the safest way into a gold position.

Forward looking I see gold bottoming over the next week or two then a nice relief rally to the $1775 area. Depending on how gold arrives there will alter my next gold forecast so let’s wait and see how things unfold.

Watch my pre-market video analysis to see how prices are unfolding today: http://www.thetechnicaltraders.com/ETF-trading-videos/index.html

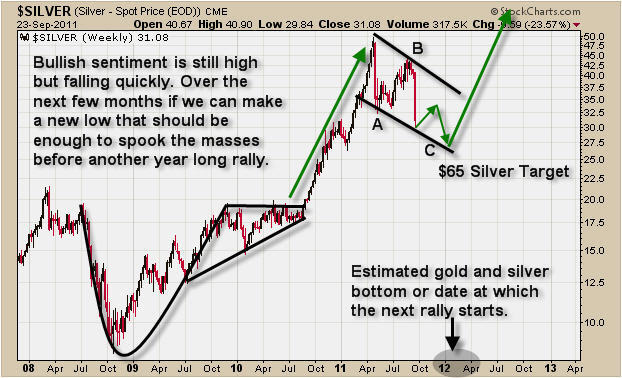
Spot Silver Price Forecast – Weekly Chart:

Silver I call the Un-Safe haven because to me it’s not a safe haven in the way everyone’s believes it be. I hear and see everyone including friends and family selling all their stocks and putting their money into silver. To me buying large amounts of silver with your retirement money is just ridiculous. I m sure my statement here will trigger an inbox of silver-perma-bulls (silver bugs) to send me hate mail but that’s fine as my assistant filters my emails so I don’t have to keep being reminded how rude some humans can be over an simple opinion…

Investments that can lose 25% in value within 2 days or lose 40% of it’s value in 5 months should not be traded nor invested in with large portions of anyone’s life savings, especially if you are over the age of 50 and have not proven to be a constantly profitable trader. No one can stomach losing that much of their nest egg.

That being said I do feel silver is in a similar situation as gold. I do feel a bottom is near. Silver has formed an ABC correction and the price and volume patterns seem to be in line with a typical bottoming pattern. After Friday’s massive selloff I feel silver may slide a little lower yet before putting in a bottom.

One thing to keep in mind with silver is that it is very thinly traded; there are a lot of speculative traders involved which push and pull the price to extreme levels on a regular basis. So if the broad stock market continues to sell off sharply then I expect silver to follow suit.

Pre-Week Precious Metals Trend Analysis Trading Conclusion:

The price action we have seen this year for both gold and silver indicate were are just warming up for something really big to happen. It could be a massive parabolic rally to ridiculous new highs in 2012 or it could be a large unwinding of the safe havens as countries sort out their issues and the big money starts moving out of metals and into currencies and stocks.

Only time will tell and that is why I analyze the market multiple times per week to stay on top of both long term and short term trends. So if you want to keep up with current trends and trades for gold, silver, oil, bonds and the stocks market check out TGAOG at: www.thegoldandoilguy.com/trade-money-emotions.php

Chris Vermeulen

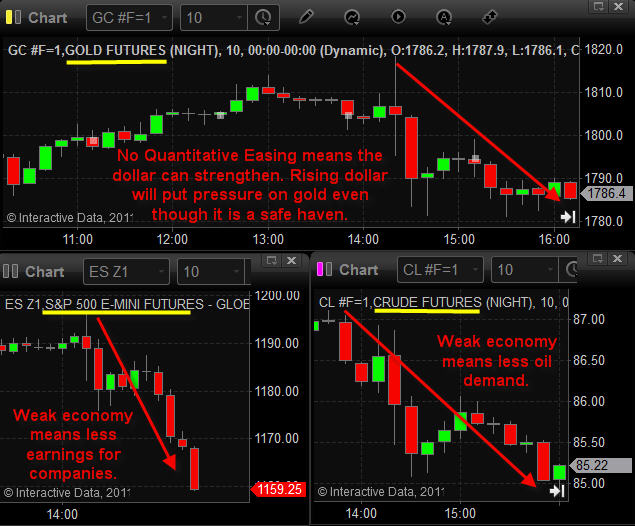
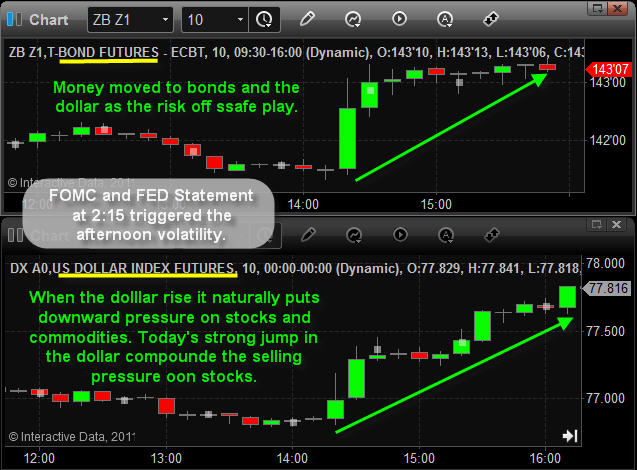
What a trading session Wednesday was with the FOMC meeting and the FED coming out leaving the Fed Funds Rate unchanged at 0.25% and saying the economy is looking weak and will not likely to get better any time soon. This wave of negative news triggered a selling spree across the board in stocks, metals, and oil. On the flip side all that money being pulled out of those investments was being dumped into bonds and the dollar currency.

So the question everyone is asking is why almost every asset class sold off after the Federal Reserve’s statement today? The next question is how do we position ourselves to profit?

Understanding how the market moves is not a simple task, if it was that easy everyone would be pulling money out of the market on a daily or monthly basis. With that being said, moves can be anticipated if enough indicators are pointing to the same outcome.

Gold, SP500 and Oil 10 Minute Charts Showing Todays 2:15 FED News
Over the past few weeks we have been seeing stocks, oil, and gold turn bearish with similar price and volume action. Having three major investment vehicles hinting towards a move in the same direction as each other increases the odds for that move to occur. With the Fed coming out with negative news and no quantitative easing on tap, a rally in the dollar was triggered because inflation (printing of money) is not in the picture for some time still.

Bonds and Dollar Index 10 Minute Charts Showing Today’s 2:15 FED News
Now if we look at the safe havens we can see the positive side to today’s news.
Bonds have been trading higher for some time and the key in trading is to trade with the trend. Though it’s easier said than done… In this morning’s pre-market analysis I talked about bond prices and how they are looking toppy but we need one more large surge higher before I will consider looking for a short trade setup. Today’s news sent bonds surging higher which I feel will happen for a few more days. Once the momentum stalls out of bonds, then I may be looking to short bonds using the TBT inverse bond fund.

The fact that there is no quantitative easing planned is bullish for the dollar. Stepping back a few weeks we have seen the dollar index rally very strongly. The move up was an impulse wave meaning a trend reversal from the multi-month down trend. Knowing that the dollar had shifted from a down trend to a strong uptrend prior to the Fed’s announcement today was our tip off to being long the dollar several days ago at a much lower price level.

Mid-Week Market Trend Conclusion:
In short, I feel the intermediate trend (5-20 days) remains firmly down for stocks and crude oil. Silver is more of a wild card because it is more of an industrial metal/speculative investment and it can move at times with gold or down with stocks…

Looking at gold. I am bullish on gold long term but at this time I remain neutral until I see how the next couple trading sessions play out.

Bonds I remain neutral because they have moved a long way without any substantial pause or pullback and I feel one really positive headline news item could send bonds sharply lower.

The dollar index shifted from a strong down trend to a very strong up trend last month and I feel we could see another substantial rally unfold. I have an 80.00 – 81.00 price target on the dollar index at this time.

Consider joining me at TheGoldAndOilGuy for ETF trade ideas on the SP500, Oil, Gold, and Silver with great accuracy. Check it out at http://www.thegoldandoilguy.com/free-preview.php

Chris Vermeulen

The coming summer should be exciting for traders! While summer trading generally tends to be slow, this one could be different. A large number of other professional traders I talk with are all feeling the tension building in the market. We all think some big movements are just around the corner and the big question is which way are things going to move?

Depending on your trading style you may be viewing the recent market action as the beginning stages of a bear market (major sell off). A bear market is not necessarily impossible as the U.S. Economy is showing the beginning signs of weakness. The fact that stocks have moved lower for almost 6 weeks straight is a recent reminder that we may not be out of the woods just yet. The recent price action and negative sentiment has been harsh enough to make 99% of traders bearish.

In contrast, some traders may be seeing this market as an oversold dip preparing for a bounce/rally in the bull market which we have been in since 2009. Some traders may see this as a buying opportunity because you are a contrarian. Most contrarians generally want to do the opposite of the masses (herd) who are merely trading purely out of emotional sentiment.

I myself have mixed thoughts on the market at this point in time. I’m not a big picture (long trend forecasting) kind of guy but my trading partner David Banister is great at it. Rather I am a shorter term trader catching extreme sentiment shifts in the market with trades lasting 3-60 days in length. So looking forward 2-5 days I feel as though stocks and commodities are going to bottom and start to head higher for a 2-6% bounce. At that point we need to regroup and analyze how the market got there… Was the buying coming from the herd, institutions, or was it just a short covering rally? Additionally, where are the key resistance levels and did we break through any?

During extreme sentiment shifts in the market we tend to see investments fall out of sync with each other for a few days. I feel the attention will be on stocks and we get a bounce this week. I am expecting commodities to trade relatively flat during the same time period.

OK let’s take a quick look at the charts…

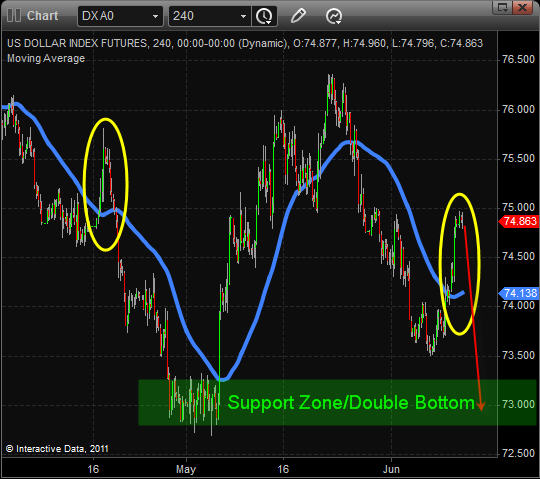
Dollar Index 4 Hour Candles
I feel as though the US Dollar is trying to bottom. It is very possible that we test the May low at which point I would expect another strong bounce and possible multi-month rally. So if the dollar drops to the May lows then we should see higher stocks and commodities, but once the dollar firms up and heads higher it will be game over for risk assets.

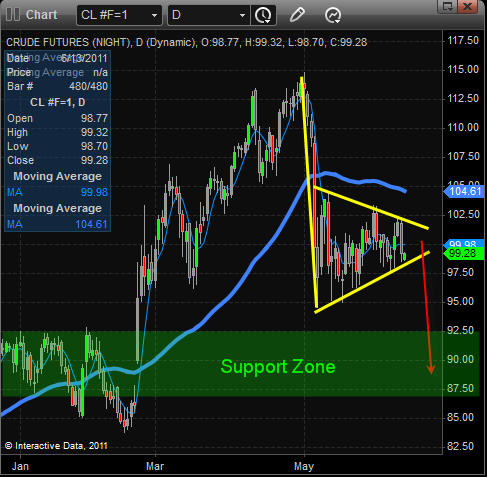
Crude Oil Chart – Daily
Oil took a swan dive in early May and has yet to show any signs of moving higher. Actually crude oil is looking more and more bearish as time goes by.

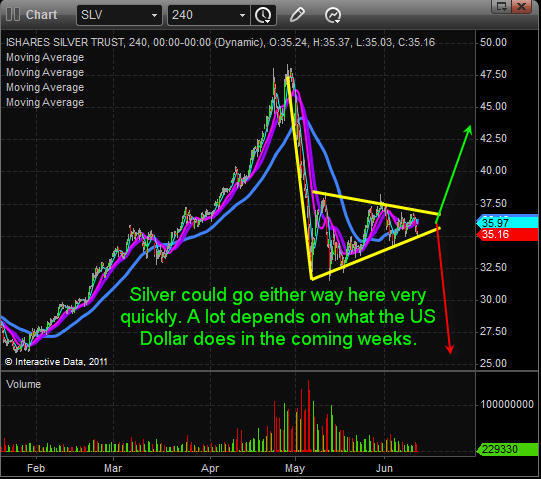
Silver 4 Hour Chart
Silver has formed much of the same pattern that oil has. On a technical basis its pointing to sharply lower prices still. The fact that silver bullion went from an investment to a speculative trading instrument within the past 8 months makes me think it could test the $25 area. The one thing to remember here is that silver is still overall in a bull market. This is a 50/50 guess in my opinion as it nears the apex of this pennant pattern.

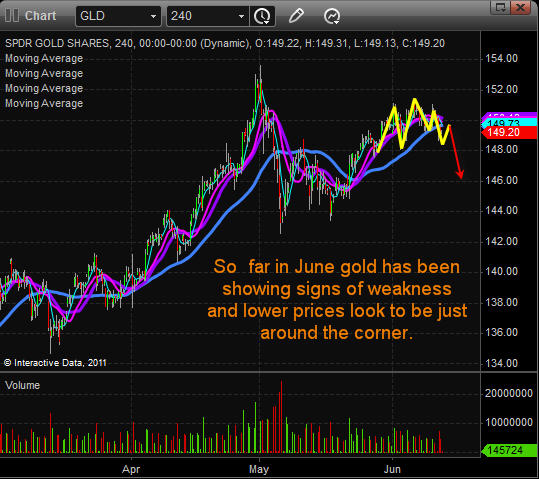
Gold 4 Hour Chart
Gold has held up much better than other metals and commodities and I feel that is because it’s still seen at the REAL safe haven. But reviewing the chart Im starting to see bearish price action beginning to take place.

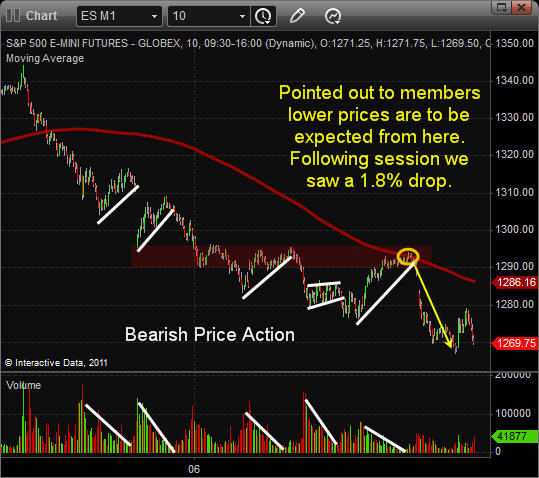
SP500 Futures – 10 Minute Chart Going Back 8 Days
Last week the SP500 continued to show signs of weakness. Any bounce in the market was on light volume and that is because the sellers took a break and let all the small traders buy the market back up. But once the market moved up enough then sellers jumped back in and unloaded their shares.
Last Thursday I sent out an update to members pointing out that lower prices were to be expected. I came to this conclusion because of many data points. Looking at the chart you can see sellers are clearly in control. The SP500 bounces high enough that it reached a key resistance levels going back 5 days. Also the 200 period moving average was at that level. To top that off my sentiment reading for the herd mentality was at a point which sellers like to start dumping their shares again.

Weekly Market Trading Conclusion:
In short, I am getting more bullish for a bounce as the market falls. But once we are into day 3 or 4 of a bounce we must be ready to take profits and/or look for a possible short setup.

Get my free weekly reports here: http://www.thegoldandoilguy.com/trade-money-emotions.php

Chris Vermeulen

It was a crazy session as the stock market slid over 2% on heavy volume. This type of price action means fear has taken control of masses and they are unloading (selling their stocks) in anticipation of much lower prices.
Trading off extreme levels of fear can be very rewarding if done right. That’s because fear is the most powerful reaction we as humans have and it’s somewhat predictable. Fear can make people do crazy and or stupid things and it’s these extreme reaction which investors do in the market that lead to great trading opportunities. Buying into fear and selling into greed is what I focus on.

Gold and Silver Showing Greed and Fear
For example, if we take a look at the 4 hour chart of gold and silver you will see how investments which have a large amount of speculation like Silver move the opposite to what other related investments like gold are doing.

The first chart which is gold, shows how today’s fear had investors moving into this shiny safe haven. Silver on the other hand has been the investment of choice for every Tom, Dick and Harry trying to play the popular headline investment. So on a day like today when prices start to slide in the stock market these speculative holders of silver get scared and dump (sell) their position in stocks and silver. The problem with silver is that the market is still small and its does not take many people hitting the sell button to send it 5% lower which is what took place today. This is one sign which is telling me traders are getting scared of a market selloff.

Evidence #2 Showing Signs Of Fear
These data points below clearly show sellers were in control today. I like to look at the NYSE because it holds all the big brand name stocks which the masses like to buy when they feel lucky. So when I see this many traders selling and so few buying I know the masses are dumping shares and going to a cash.

The NASDAQ had 10 shares being sold to every one share being bought which is half the fear level of what the NYSE and that makes good sense. The NASDAQ has many smaller companies which the masses just don’t know about or own so there was not as much selling taking place on that exchange. So brand name stocks getting dumped all at once is another sign of extreme fear hitting the market.

Evidence #3 Showing Signs Of Fear
This chart below provides the momentum of the market. I think of it as the rubber band effect. If the market selling momentum is strong enough then it pulls this indicator down to a level which it cannot go much further before it gives way and moves back a neutral or positive extreme level. This little hidden gem of an indicator can help time entry and exit points with ease once you understand it. Currently its telling us that a pause or bounce is likely to happen tomorrow.

Evidence #4 Showing Signs of Fear and an Oversold Market Condition
Take a look at the 10 minute SPY (SP500) chart below. Simple visual analysis shows that today’s strong selling which has brought the market down into a support zone should provide a pause or a bounce very soon. The question is how big will the bounce or rally be?

Given all the confirming is looking ready for a bounce and I feel we could be nearing not a bounce but an intermediate bottom and higher prices going forward. But if we break strongly below this support level then all bets are off and much lower prices should occur.

Mid-Week Trading Conclusion:
In short, today’s sharp move lower has put the market in a short term oversold condition. Meaning, a bounce is very likely to take place within the next 1-3 sessions. With the masses selling all their positions in stocks and commodities it generally takes 1-3 days after a day like this for the selling pressure to dissipate and for value buyers to step back into the market providing support.

I think both stocks and commodities will strengthen in the next few days and we will see if the market can get some traction and start a new rally. But until everyone has sold out of the market giving their shares to the big money (smart money) at a sharp discount I feel we have a rough road ahead.

Get these trading reports free each week here: http://www.thegoldandoilguy.com/trade-money-emotions.php

Chris Vermeulen

Update on Metals with David Morgan and Chris Vermeulen

Listen To What David and Chris have to say About gold and silver: http://www.netcastdaily.com/broadcast/fsn2011-0520-1.mp3

Seduced by silver at the tender age of 11, David Morgan started investing in the stock market while still a teenager. A precious metals aficionado armed with degrees in finance and economics as well as engineering, he created the Silver-Investor.com website and originated The Morgan Report, a monthly that covers economic news, overall financial health of the global economy, currency problems ahead and reasons for investing in precious metals.

Today on Jim Puplava’s Financial Sense Newshour metals update, David Morgan talks about the 16:1 gold to silver ratio fallacy and why we see silver margin requirements imposed.

Chris Vermeulen is Founder of the popular trading site GoldAndOilGuy.com. There he shares his highly successful, low-risk trading method. Since 2001 Chris has been a leader in teaching others to skillfully trade in gold, oil, and silver in both bull and bear markets. Subscribers to his service depend on Chris’ uniquely consistent investment opportunities that carry exceptionally low risk and high return.

Jim Puplava welcomes Chris Vermeulen today on the Financial Sense Newshour metals update. Chris indicates that silver is still consolidating, with the possibility of one more down draft.

Read Chris Vermeulen’s previous forecast which unfolded as planned: http://www.thegoldandoilguy.com/articles/parabolic-moves-are-only-temporary-for-silver-and-gold/


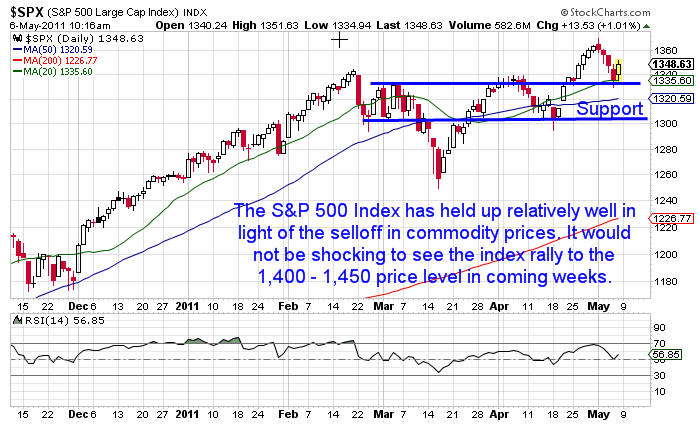
The price action in precious metals and oil this past week has been breathtaking. The last time we have seen this much volatility in commodity prices was amidst the financial crisis in 2008 and the early part of 2009. Does this mean we are at the brink and risk assets are going to decline precipitously? Obviously that question cannot be answered with any certainty, but the underlying price action in the S&P 500 has been relatively strong compared to gold, silver, and oil.

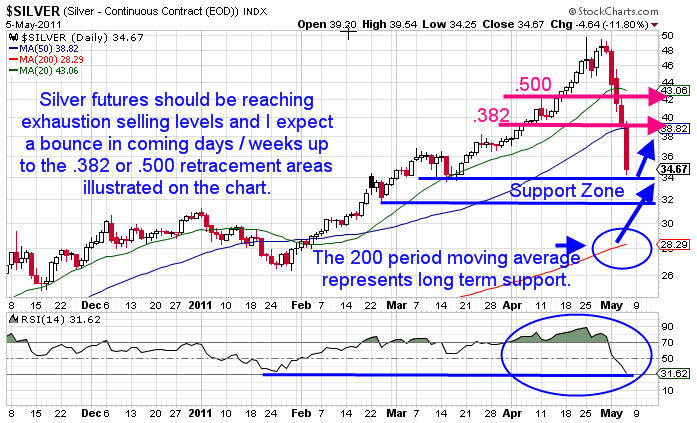
Talking heads everywhere are predicting the commodity bubble has burst and pointing fingers at excessive speculation in silver and oil. Margin requirement changes in silver futures have been fingered as the primary catalyst for the nasty sell off. Silver had gotten way ahead of itself in terms of price and parabolic moves higher are usually followed by parabolic moves lower. For silver buyers on Friday, April 29 a painful lesson has been learned as their investment has declined more than 30% in 5 days.

It doesn’t take a genius to realize that we are going to bounce higher at some point. With a sell off of this magnitude it would not be shocking to see at least a 50% retracement of the entire move in coming weeks. It is also possible that this is a buying opportunity for precious metals and oil. It is too early to be certain, but a bounce next week is likely as silver went from being severely overbought to severely oversold on the daily chart in one week. The chart below illustrates the 50% retracement and the RSI reading for silver futures:

In the month of April OptionsTradingSignals members were able to capitalize on rising silver prices to close a trade that produced an 18% return in less than 5 days using a double calendar spread in order to produce outsized profits based on maximum risk. Members regularly receive trade alerts focusing on gold and silver using ETF’s GLD & SLV which have extremely liquid options.

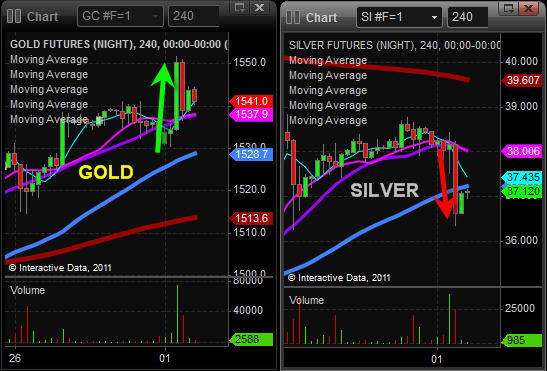
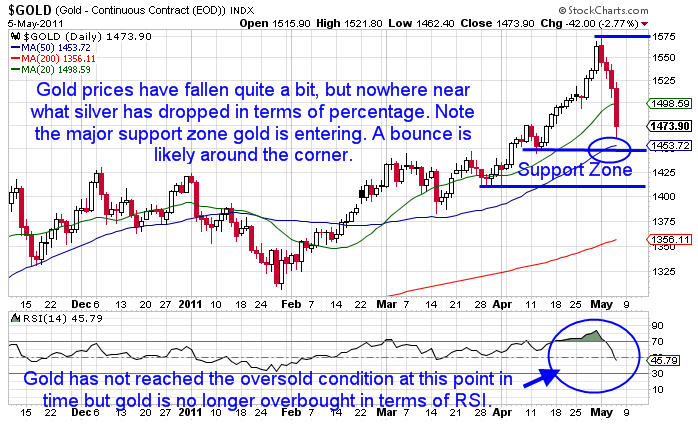
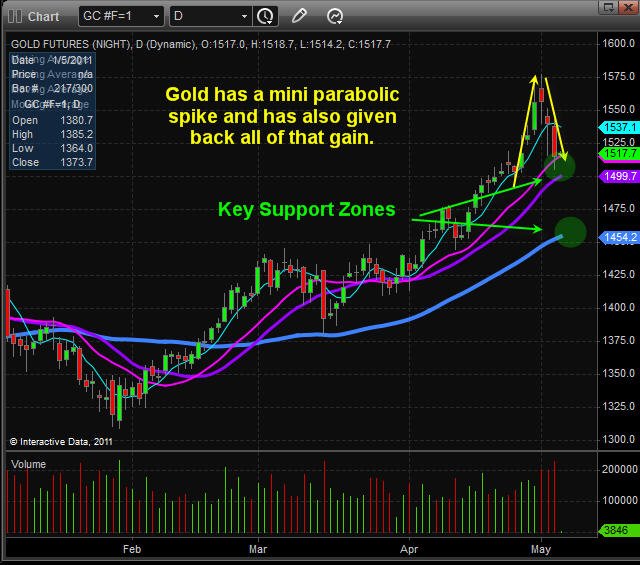
While silver prices have been absolutely crushed, gold prices have held up a bit better. In fact, in this selloff gold has been less volatile in terms of intraday percentage price movement and has not suffered from near the losses that we have witnessed in silver. The gold futures chart below illustrates key price levels:

Members of the OTS service received a trade alert on April 6th for a calendar spread that was converted to a vertical spread. When the vertical spread was closed on April 26th the members realized a gain close to 56% based on the maximum risk of the trade.

Recently we have received some poor economic data which has put a drag on equities the past few weeks. This morning we are seeing a strong bounce in the S&P 500 futures and if we have another light volume Friday prices tend to drift higher throughout the trading day. The S&P 500 futures spiked to around 1,370 on the news of Osama Bin Laden’s death and then sold off from that point. The chart below illustrates the S&P 500 futures rally and subsequent sell off highlighting current key price levels:

Members of OptionsTradingSignals received a trade alert on April 12th to put on a call vertical spread to capitalize on rising prices. On April 21st partial profits were taken and eventually stop orders closed out the position on May 4th locking in a total gain of around 32% for the trade based on maximum risk.

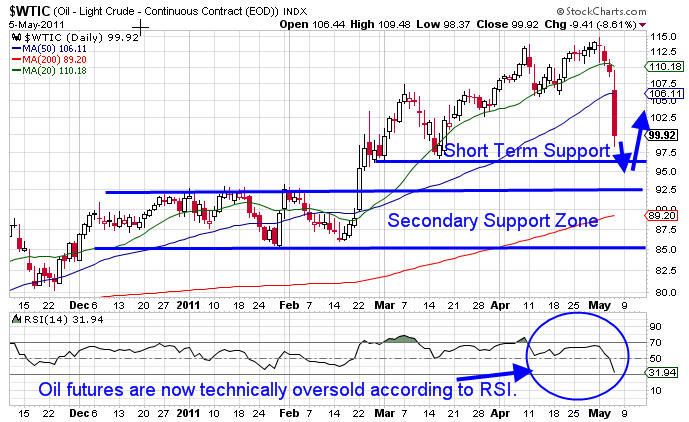
Oil prices have sold off sharply, albeit not as sharp as the downside move in silver recently from a percentage standpoint, but a significant amount of the risk premium has come out of oil prices. I continue to believe that oil prices over the long term have only one direction to go based on tightening supply / demand going forward and lower production levels in the future. Similar to silver, a .500 retracement of the entire recent move is rather likely in coming weeks. The daily chart below illustrates key price levels in oil futures:

I continue to believe that oil prices are going to work higher over the longer term for a variety of reasons, but a drop in gasoline prices would not hurt U.S. Consumers and the domestic economy. Higher oil and gasoline prices weigh on the U.S. Economy heavily so this sudden decline in price is beneficial to most Americans which could juice consumption if prices stay lower for a longer period of time.

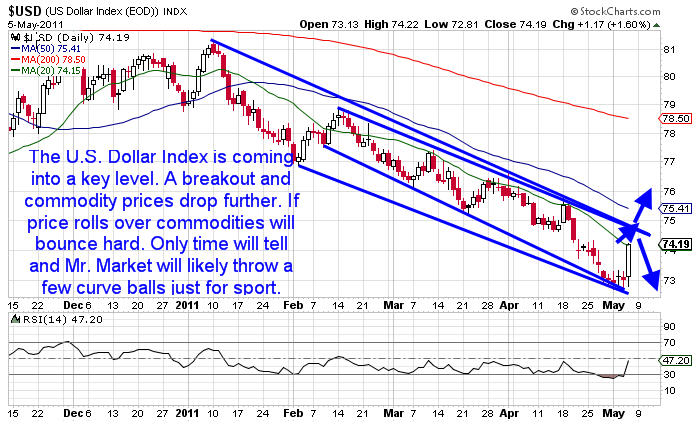
Overall, price action in the commodity space has been extremely volatile the past week with silver and oil really getting hammered lower. Gold and the S&P 500 held up a bit better and it would not be shocking to see the S&P 500 put on a rally from here if oil prices stabilize. However, if the U.S. Dollar continues its recent rally it will force the commodity space as well as equities lower. The daily chart of the U.S. Dollar Index futures is shown below:

In closing, I am expecting a bounce in coming days and a .382 or .500 retracement of the entire move in gold, silver, and oil would make sense so I would not be too aggressive shorting. However, I would not necessarily be an aggressive buyer either. It is going to take time for market participants to digest the recent moves. In weeks ahead it will be more apparent what price action is likely to do and I would be shocked if we did not see a few low risk, high probability trades setting up.

Speaking of low risk, high probability trades, the month of April was the best performance for the OptionsTradingSignals service so far year to date. Seven total trades were opened and six trades have been closed with sizable profits. Recent returns included an 18% return in SLV, a 56% return on a GLD trade, 32% return on an SPY call vertical spread, a 12% return on a RUT Calendar spread, and a 37% return on an AMZN calendar spread. The total cumulative return in April was 155%.

Assuming a trader had a $10,000 account and risked a maximum of $1,000 per trade, the gross gains would have been well over $1,400 in April alone. The overall service is up over 15% year to date handily beating the S&P 500 return while assuming less risk. Take advantage of the special offer going on now where new members get 3 months for the price of one!

Get JW Jones’ Weekly Reports Free Here: http://www.optionstradingsignals.com/profitable-options-solutions.php

By: JW Jones
Co-Author: Chris Vermeulen

The past few weeks we have been seeing the US Dollar slide to new lows at an increasing rate. The strong devaluation of the dollar has sent precious metals like silver and gold rocketing higher out of control sending them parabolic!

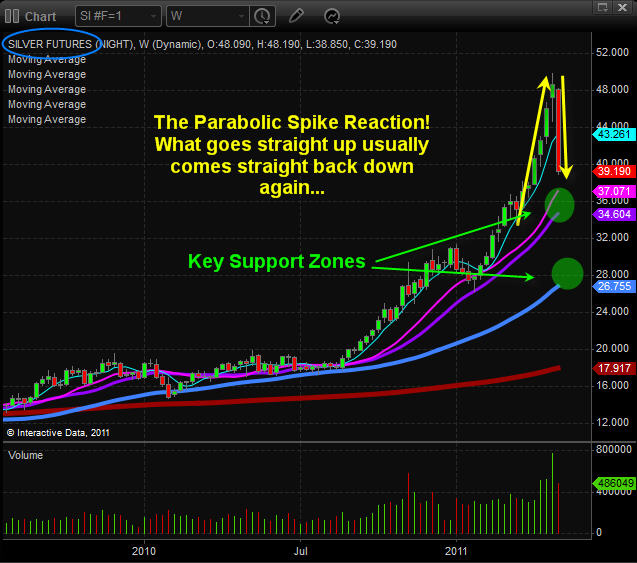
During the past 6 weeks both silver and gold have been rising in a parabolic formation. Meaning the price is going straight up with strong volume as everyone gets greedy and buys into the commodities at the same time. Most of you who follow my work already know that if the general public is piling into an investment rocketing prices higher, you better start focusing on tightening your protective stops and or taking some profits off the table before the price collapses.

Take a look at the weekly chart of Silver below:
Silver was grinding its way higher from July into March of this year. Only in the past 6-7 weeks did we start to see silver open up and run with expanding candles growing at an accelerated rate. This virtually straight up rally is a signature pattern and tells me that price action is now VERY unpredictable and anyone getting involved should be tightening their stops and or taking partial profits on price surges.

Parabolic moves can provide some big gains but most traders end of giving it all back and then some because the price can drop very abruptly as seen on this chart.

The weekly chart of gold below shows much of the same thing but without the extreme volatility that silver has.

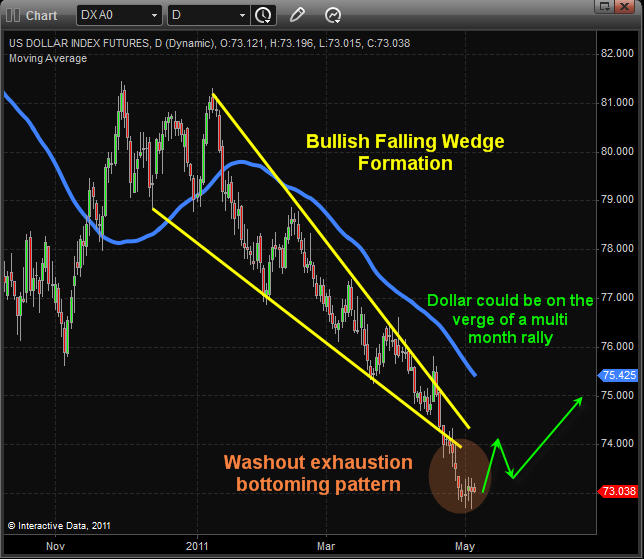
Now, if you take a look at the US Dollar chart it’s starting to look very bullish in my opinion. The chart shows a falling wedge which typically means the selling pressure should be coming to an end soon. I’m not sure how large the bounce/rally will be. I do think a quick move to the 75 level is very likely in the near future though.

I find that metals tend to turn just before the dollar does. So I’m very cautious here on buying any stocks or commodities at the moment. The past 2 years we have seen stocks and commodities have an inverse relationship with the dollar so a rising dollar means a market pullback will take place. Sell in May and Go Away…?

Mid-Week Trading Conclusion:
In short, we exited our SP500 position this week for a nice 6% gain in a couple weeks making that our third profitable back to back index play. At this time I’m not ready to buy or short the market until all the charts line up for another low risk entry point. Things are 50/50 odds here and that’s not good enough for me.

That’s it for now, but remember you can get my free trading reports each week at: http://www.thegoldandoilguy.com/trade-money-emotions.php

Chris Vermeulen

The dollar continues to control the equities and commodities market with its inverse relationship to them. The past couple years it seems that the dollar does what it wants and the all other investments move according to their relationship with rising or falling dollar prices.

 
Most of you know that I follow the dollar very closely. And each morning I provide my analysis with what I feel will take place throughout the session or next 48 hours.

 
In Today’s (Wednesday’s) pre-market trading analysis I talked about the strength of the equities market in the past few sessions and that it looks as though it still has more power behind it.


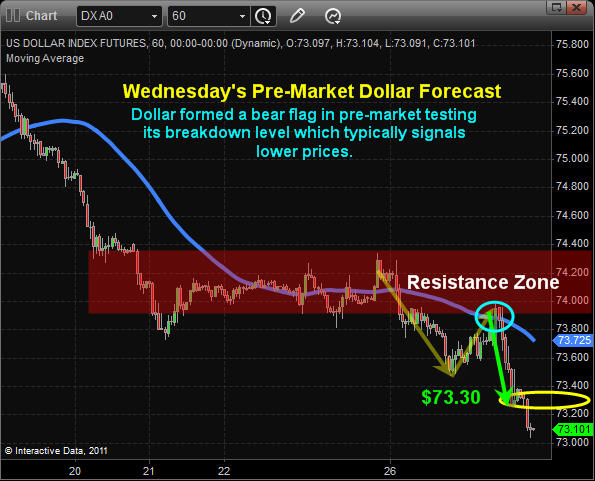
Dollar Index 60 Minute Chart
Taking a look at the US Dollar I noticed this morning that it was pointing to even lower prices and that it would likely happen today. It was only a few hours later that the dollar went into a free fall blowing through my downside price target of $73.30. It was this sharp drop in the Dollar which sent stocks, silver and gold soaring higher yet again in our favor.

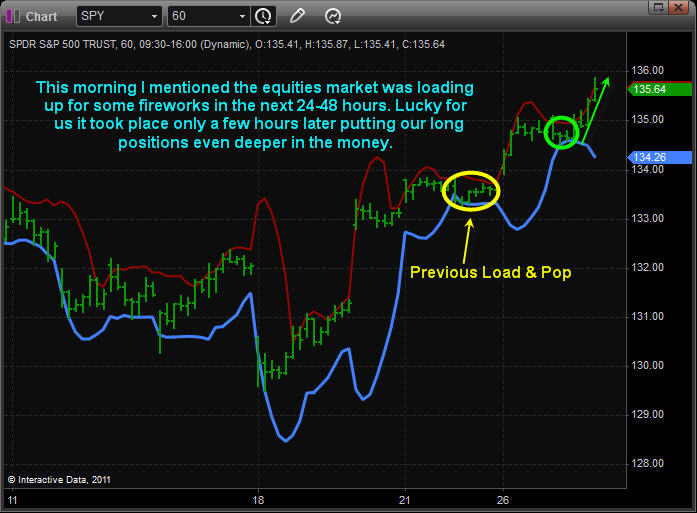
Equities Market – SPY 60 Minute Chart
Stepping back a couple hours before the US dollar dropped in value sending stocks higher I did see fear creep into the market as traders started selling their shares and buying put options expecting the stock market to fall. When I saw this I got exciting because higher stock prices are usually just around the corner which they were! That’s when I sent an update out subscribers noting we should see some fireworks very soon.

 
While I am bullish on the stocks and metals at the moment and are long in several positions I am starting to see signs that a pullback is becoming more likely each trading session. This is when money management is important. I do not want to give back to much profit, but I must make sure we lock in some gains during times when the market is overbought like this.

Mid-Week Trading Conclusion:
In short, we continue to ride the trend of higher stock and precious metal prices as the US Dollar spirals down out of control. Our SP500 positions are deep in the money and we continue to ride it for all it’s worth raising our stops as we go.

 
The big question is if the Sell In May, and Go Away will take shape or not… Im thinking it will as when the time is right I will be looking to short the market.

If you are not yet getting my pre-market chart analysis be sure to join my trading service at http://www.thegoldandoilguy.com/free-preview.php

Chris Vermeulen