Both the Canadian and US stock markets are closed today. Futures trading have shortened mixed hours also. Being a holiday and limited trading there is no video this morning.
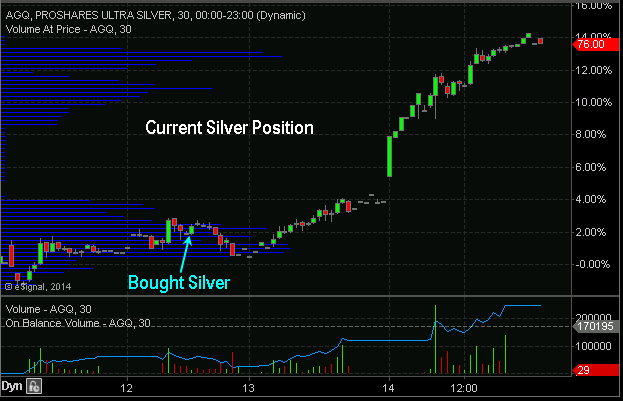
Taking a look at the futures market we can see trading up another 1.35% today which is great to see. So far out silver position is up over 12% in just a few trading sessions.
Natural gas is no fire once again… up nearly 5% again today and is now testing the recent spike highs in price in which we shorted earlier this month for a net 20+% profit in only a few days. Nat gas actually looks ready to rally even more this time so I am not looking to short it unless we get a picture perfect setup again.
The SP500 (broad market) continues to claw it’s way higher and its trading up 0.25% this morning. We are going to leave the stock market alone until we get a correction in price, then we will review the charts for a possible trade setup.
On different note, today we are excited to announce the opening of doors to our automated trading system for investors. Many of you are already on the waiting list as we have a limited amount of client seats available to have the system traded automatically in your brokerage account and it is first come first serve. Keep in mind today is a holiday with brokers and services are running on a skeleton crew. If you have not taken a look at our automated trading system you can review all the details here: www.AlgoTrades.net
Chris Vermeulen
https://thegoldandoilguy.com/wp-content/uploads/2014/02/silverposition.png401623adminhttp://www.thegoldandoilguy.com/wp-content/uploads/2014/11/tgaoglogo.pngadmin2014-02-17 08:56:372014-03-03 13:34:41Silver Trade & Automated Trading System for Investors
The precious metal market has been stuck in a strong down trend since 2012. But the recent chart, volume and technical analysis is starting to show some signs that a bottom may have already taken place.
This report focused on the weekly and monthly charts which allow us to see the bigger picture of where the precious metals sector stands in terms of its trend.
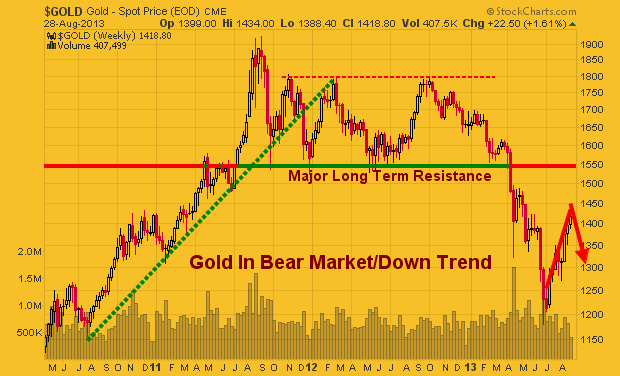
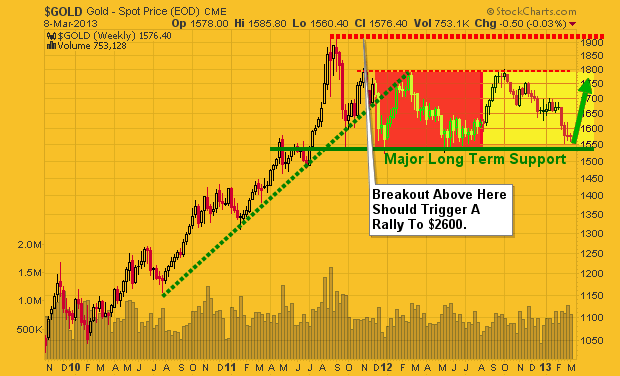
This chart clearly shows the trends which gold has gone through in the last three years. With simple technical analysis trend lines, clearly price is nearing a significant apex which will result in a strong breakout in either direction.
Remember, this is the weekly chart, so we could still have another month or three of sideways chatter to work through. But a breakout in either direction will trigger a large move.
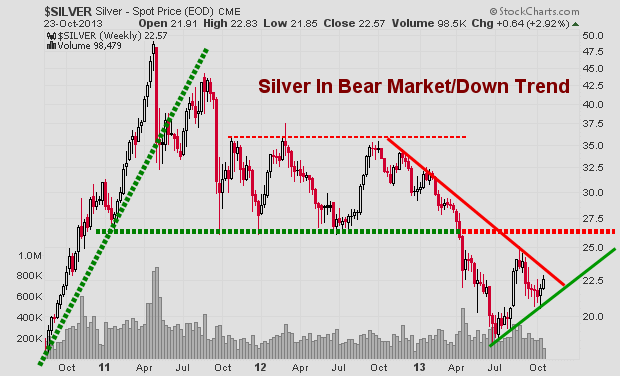
Silver Spot Price – Weekly Chart
Silver is also stuck in a similar pattern. Currently the odds still favors lower prices and for the upper resistance trend line to reject price and send it lower. But if we keep out eye on the leading indicators like gold miners, we may be able to catch a breakout or traded the rejection of resistance in the next month or so.
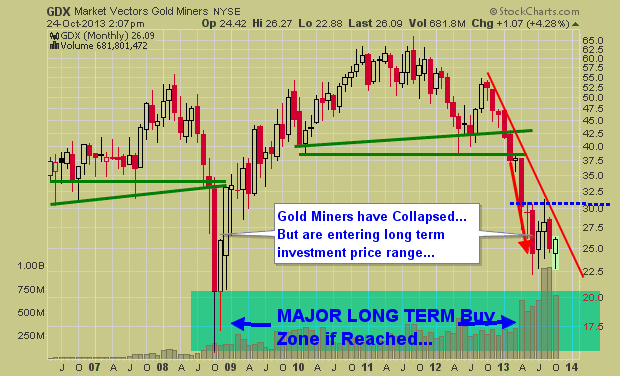
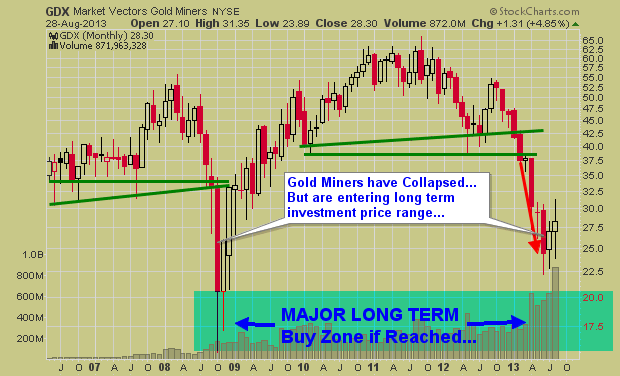
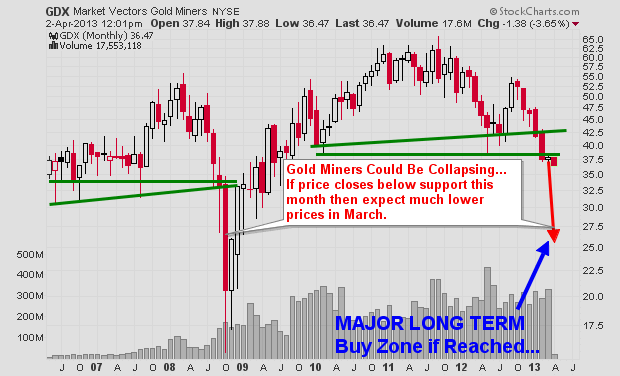
Gold Mining Stock ETF – Monthly Chart
Gold miners have a very sloppy looking chart. Price is extremely volatile and the recent price action in 2013 could go either way VERY quickly. I have a gut feeling GDX in the coming months could have a washout bottom and tag the $20 price level. While I hope I am wrong for many investors sake, if it does happen, it will be a very strong investment level to accumulate a position.
Precious Metals Bigger Picture Outlook:
In short, I remain neutral – bearish for this sector. In the next 1-3 months we are likely to see some strong price action which will be great. We need a breakout or bottoming pattern to form before we get involved at this level.
I know everyone is dying to get involved in precious metals again for another huge rally… but sometimes it’s just best to wait for the big picture chart to catch up with your bias before taking a position of size.
Get My Free Weekly Trading Sector Reports
Delivered To Your Inbox: www.GoldAndOilGuy.com
http://www.thegoldandoilguy.com/wp-content/uploads/2014/11/tgaoglogo.png00adminhttp://www.thegoldandoilguy.com/wp-content/uploads/2014/11/tgaoglogo.pngadmin2013-10-24 14:56:192014-03-04 14:05:43Precious Metals: Gold, Silver and Miners Are Trapped
It has been a bumpy ride for precious metal investors over the past couple of years and it unfortunately I do not think its over just yet.
The good news is that the bottom has likely been put in for gold, silver and gold miners BUT the recent rally in these metals and miner looks to be coming to an end. While we could see another pop in price over the next week or so the price, volume and momentum see to be stalling out.
What does this mean? It means we should expect short term weakness and lower prices over the next month or two.
Below are three charts I posted several months ago on my free stockcharts list. These forecast were based off simple technical analysis using cycles, Fibonacci and price patterns. As you can see we are not trading at my key pivot level which I expect selling pressure to start to increase and eventually overpower the buyers sending the prices lower.
Gold Trading Weekly Chart:
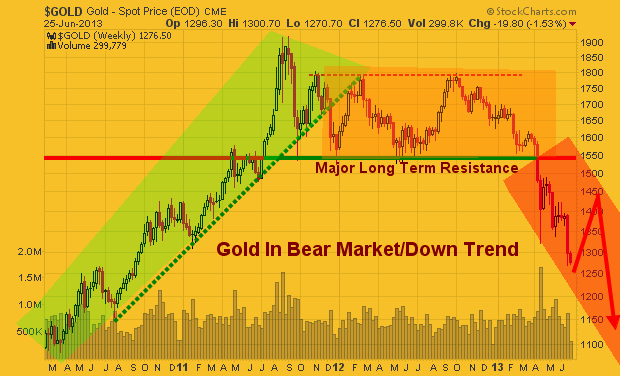
Here you can see that gold is technically in a bear market when viewing it on the weekly chart. If you were to pull up a daily chart you would likely notice how the price of gold is trading at a key resistance level on the chart and has reached its full flag measured move.
What does this mean? It means the odds are pointing to lower prices for gold in the next few weeks. Keep in mind though I do feel as though a major bottom has been put in place for the precious metals sector. So buyers are likely to step back in around the $1300 area.
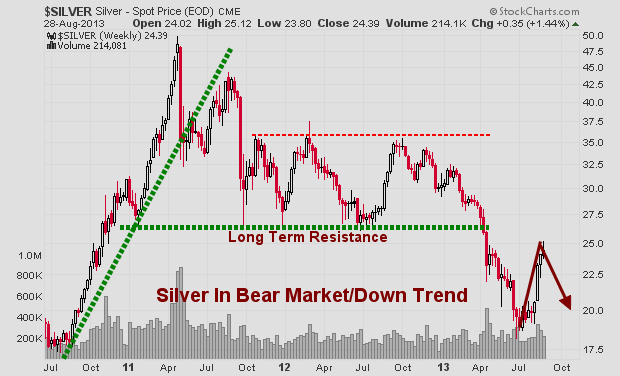
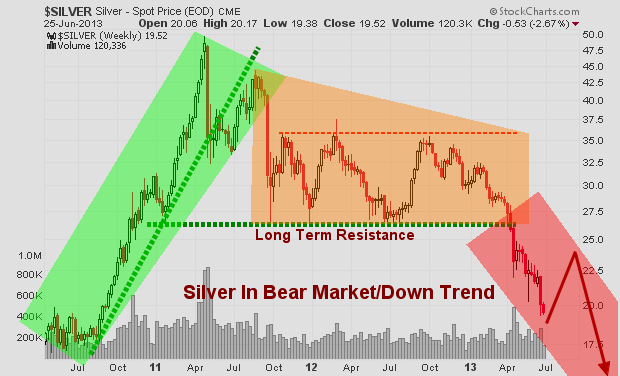
Silver Trading Weekly Chart:
Silver has a little bit different looking chart but the same analysis applies here as it did in gold.
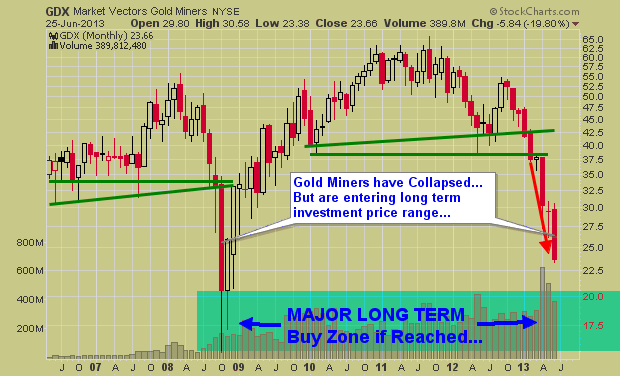
Gold Miners Trading Monthly Chart:
Gold miners may have bottomed on this monthly investing timeframe chart but the daily chart which you will see next clearly shows short term weakness has started.
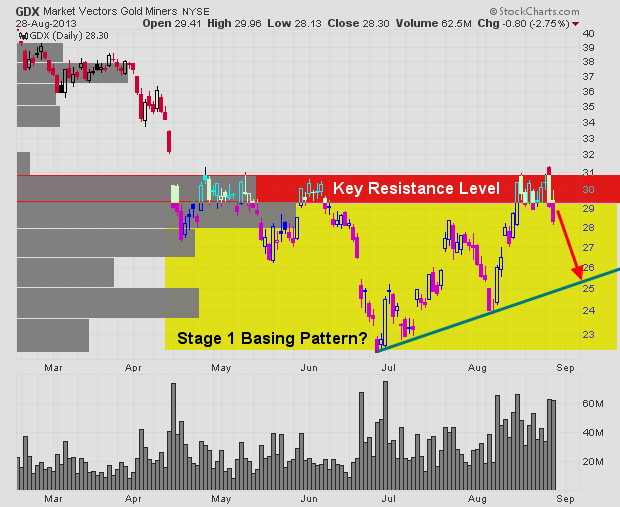
Gold Miners Trading Daily Chart:
This daily chart really shows my thinking for miners and the overall precious metals sector as a whole. The recent weakness in gold miners to the down side point to distribution of shares. This is very negative for the price of physical gold and silver as gold mining stocks tend to lead physical metals.
The yellow box shows a possible major stage 1 basing pattern forming. If this is the case, then we will have a great opportunity in the coming months when the precious metals down trend completes a reversal and start heading higher.
How to Trade Precious Metals & Gold Miners Conclusion:
In short, I think that staying in cash or shorting metals is the play for the next couple weeks. After that anything can happen and until price breaks down or finally completes the basing pattern and confirms a market bottom I would be very cautious trading here.
In the last week members of my trading newsletter took profits on our short SP500 trade and we closed a long trade in natural gas for a quick 6.5% gain. Join our community of traders and have your money on the right side of the market!
Find out what the SP500, Gold, Silver, Miners, Bonds, Oil and Nat Gas Are Setting Up For!
http://www.thegoldandoilguy.com/wp-content/uploads/2014/11/tgaoglogo.png00adminhttp://www.thegoldandoilguy.com/wp-content/uploads/2014/11/tgaoglogo.pngadmin2013-08-16 10:47:252013-08-16 10:47:25SellOff in Stocks Gives Us Some High Probability Setups
The life cycle of most things not matter what it is (living, product, service, ideas etc…) go through four stages and the stock market is no different. Those who recently gave in and bought gold, silver, mining stocks, coins will be enter this stage of the market in complete denial. They still think this is a pullback and a recover should be just around the corner.
Well the good news is a recovery bounce should be nearing, but if technical analysis, market sentiment and the stages theory are correct then a bounce is all it will be followed by years of lower prices and dormancy.
I really do hate to be a mega bear or mega bull on anything long term but the charts have painted a clear picture this year for precious metals and I want to share what I see. Take a look at the chart below which shows a typical investment life cycle using the four stage theory.
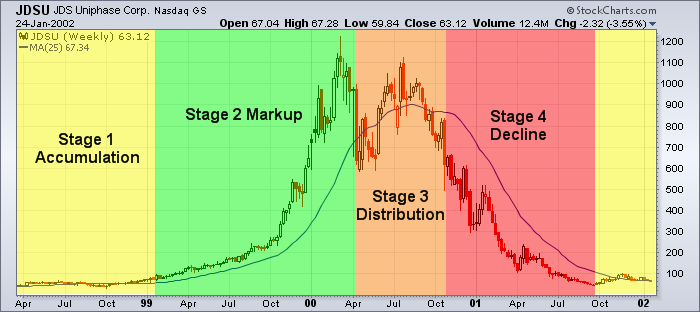
The Four Stages Theory
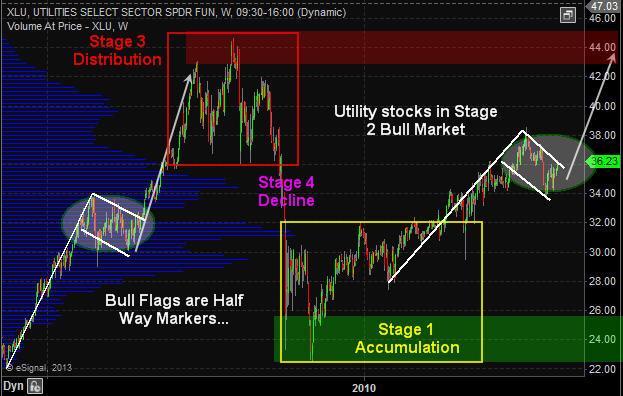
Classic economic theory dissects the economic cycle into four distinct stages: Accumulation, Markup, Distribution, and Decline. Stock, index or commodities are no different, and proceeds through the following cycle:
Stage 1 – Accumulation: After a period of decline a stock consolidates at a contracted price range as buyers step into the market and fight for control over the exhausted sellers. Price action is neutral as sellers exit their positions and buyers begin to accumulate.
Stage 2 – Markup: Upon gaining control of price movement buyers overwhelm sellers and a stock enters a period of higher highs and higher lows. A bull market begins and the path of least resistance is higher. Traders should aggressively trade the long side, taking advantage of any pullback or dips in stock price.
Stage 3 – Distribution: After a prolonged increase in share price the buyers now become exhausted and the sellers again move in. This period of consolidation and distribution produces neutral price action and precedes a decline in stock price.
Stage 4 – Decline: When the lows of Stage 3 are breached a stock enters a decline as sellers overwhelm buyers. A pattern of lower highs and lower lows emerges as a stock enters a bear market. A well-positioned trader would be aggressively trading the short side, taking advantage of the often quick decline in share price.
Gold Price Weekly Chart – Stages Overlaid
Silver Price Weekly Chart – Stages Overlaid
Gold Mining Stocks – Monthly Chart
This chart is a longer term picture using the monthly chart. I wanted to show you the 2008 panic selling washout bottom in miners which I think is about to happen again. While physical gold and silver are in a bear market and should be some a long time, gold mining stocks will likely find support and possibly have a strong rally in the coming months.
Many gold stocks pay high dividends and are wanted by large institutions and funds. The lower prices go the higher the yield is making them more attractive. So I figure gold miners will bottom before physical metals do. A bounce is nearing but at this point selling pressure and momentum continue to plague the entire PM sector.
Precious Metals Investing Conclusion:
In short, I feel with Quantitative Easing (QE) likely to be trimmed back later this year, and with economic numbers slowly improving along with solid corporate earnings the need or panic to buy gold or silver is diminishing around the globe.
While there are still major issues and concerns internationally they do not seem to have any affect on precious metals this year. Long terms trends like the weekly and monthly charts shown in this report tends to lead news/growth/lack of growth by several months. So lower precious metals prices may be telling us something very positive.
The precious metals sector is likely to put in a strong bounce this summer but after sellers will likely regain control to pull prices much lower yet.
http://www.thegoldandoilguy.com/wp-content/uploads/2014/11/tgaoglogo.png00adminhttp://www.thegoldandoilguy.com/wp-content/uploads/2014/11/tgaoglogo.pngadmin2013-06-26 09:43:342014-03-05 13:21:16Precious Metals Life Cycle Nears an End – Final Stage of Denial
It has been a very long couple of years for the precious metal bugs. The price of gold, silver and their related mining stocks have bucked the broad market up trend and instead have been sinking to the bottom in terms of performance.
Earlier this week I posted a detailed report on the broad stock market and how it looks as though it‘s uptrend will be coming to an end sooner than later. The good news is that precious metals have the exact flip side of that outlook. They appear to be bottoming as they churn at support zones.
While metals and miners remain in a down trend it is important to recognize and prepare for a reversal in the coming weeks or months. Let’s take a look at the charts for a visual of where price is currently trading along with my analysis overlaid.
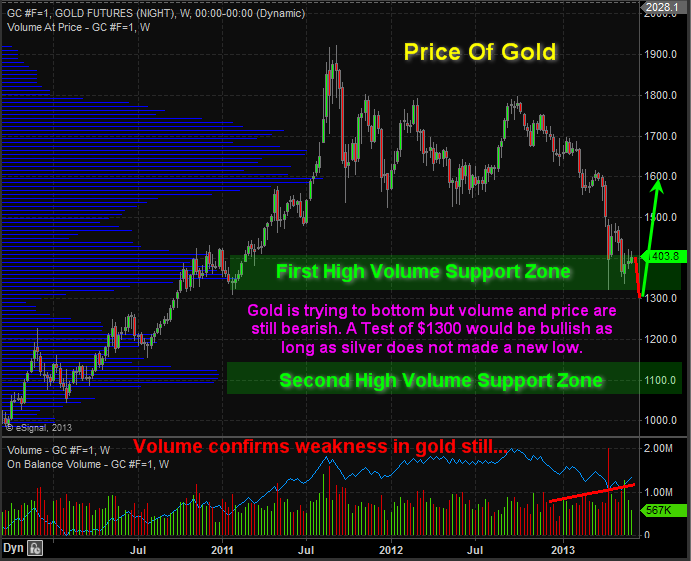
Weekly Price of Gold Futures:
Gold has been under heavy selling pressure this year and it still may not be over. The technical patterns on the chart show continued weakness down to the $1300USD per once which would cleanse the market of remaining long positions before price rockets towards $1600+ per ounce.
There is a second major support zone drawn on the chart which is a worst case scenario. But this would likely on happen if US equities start another major leg higher and rally through the summer.
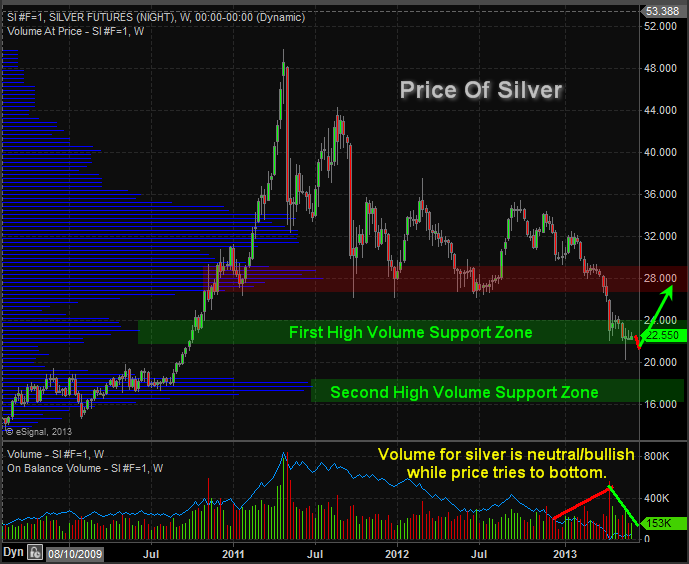
Weekly Price of Silver Futures:
Silver is a little different than gold in terms of where it stands from a technical analysis point of view. The recent 10% dip in price which shows on the chart as a long lower candle stick wick took place on very light volume. This to me shows the majority of weak positions have been shaken out of silver. Gold has not done this yet and it typically happens before a bottom is put in.
While I figure gold will make one more minor new low, silver I feel will drift sideways to lower during until gold works the bugs out of the chart.
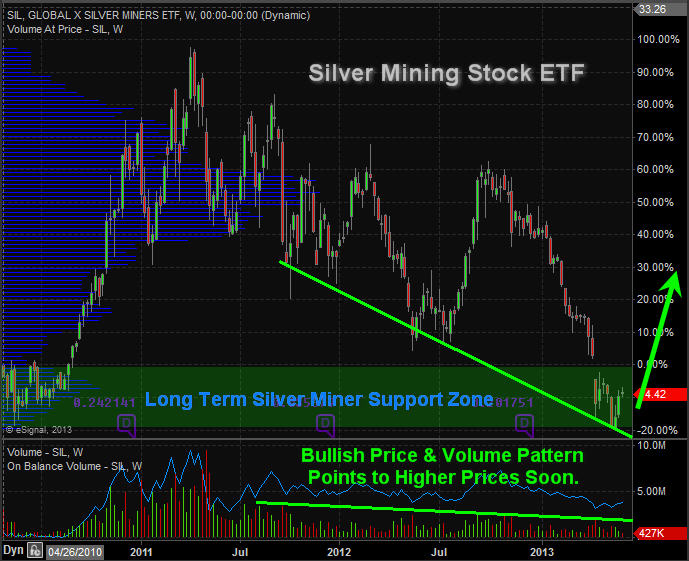
Silver Mining Stock ETF – Weekly Chart:
Silver miners are oversold and trading at both horizontal support and its down support trendline. Volume remains light meaning traders and investors are not that interested in them down where and it should just be a matter of time (weeks/months) before they build a basing pattern and start to rally.
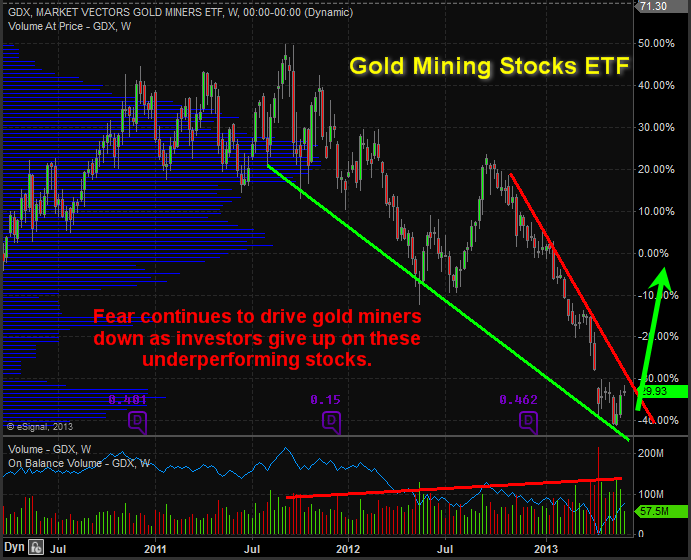
Gold Mining Stock ETF – Weekly Chart:
Gold mining stocks continue to be sold by investors with volume rising and price falls. Fear remains in control but that may not last much longer.
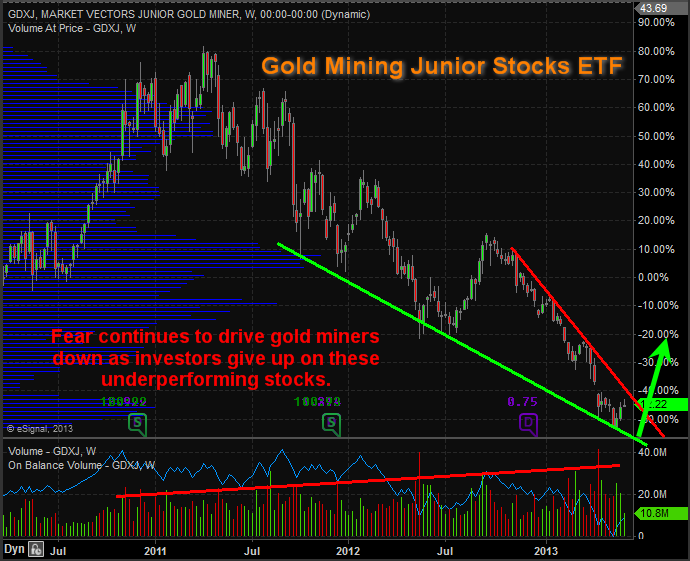
Gold Junior Mining Stock ETF – Weekly Chart:
Gold junior miners are in the same boat with the big boys. Overall gold and gold miners are still being sold while silver and silver stocks are firming up.
Precious Metals Trading Conclusion:
In the coming weeks we should see the broad stock market top out and for gold miners along with precious metals bottom. There are some decent gains to be had in this sector for the second half of the year but it will remain very dicey at best.
If selling in the broad market becomes intense and triggers a full blown bear market money will be pulled out of most investments as cash is king. Gold is likely to hold up the best in terms of percentage points but mining stocks will get sucked down along with all other stocks for a period of time. This scenario is not likely to be of any issue for a few months yet but it’s something to remember.
Get My Daily Precious Metals Report Each Morning And Profit! www.TheGoldAndOilGuy.com
Chris Vermeulen
http://www.thegoldandoilguy.com/wp-content/uploads/2014/11/tgaoglogo.png00adminhttp://www.thegoldandoilguy.com/wp-content/uploads/2014/11/tgaoglogo.pngadmin2013-06-06 18:45:042014-03-06 11:16:06Gold, Silver & Precious Metal Miners Signals
On April 12th I wrote a blog post titled Precious Metals Melt-Down, and How To Manage It.I talked about how gold, silver and gold mining stocks have been flying under the media radar for over a year and that they were not catching the attention of traders, investors and the public anymore. I also said it would take some sharp price action (breakdown or rally) for it to be front and center again on TV, Radio and Newspapers.
But since gold has plummeted 17.5% dropping from $1600 down to $1320 per ounce with silver and gold stocks falling also they are now headline news once again. This move has caused some serious damage to the charts when looking at it from a technical analysis point of view. Below are some basic analysis points that show a new swing trading entry point.
The Technical Traders Chart Analysis:
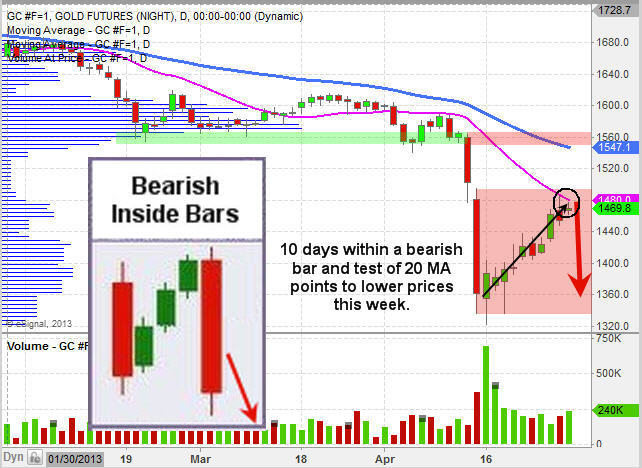
Broken Support – Once a support level has been broken it becomes resistance. Gold is trading under a major resistance level.
Momentum Bursts – Since the April 15th low, gold has been setting up for another short selling entry point. Remember the market tends to move in bursts of three, seven or ten days then price reverses direction or pauses. It has now been 10 days.
Moving Average Resistance – Gold has worked its way up to the 20 day moving average which can act as resistance.
Bearish Inside Bars – This type of chart pattern points to lower prices. When there is a big down day followed by 3, 7 or 10 up days inside the price action of the down bar we can typically expect another sharp drop which tests the recent lows as shown with the arrow on the chart.
Gold Short Selling Conclusion:
In short, gold is setting up for a low risk entry point that should allow us to profit from lower gold prices. Using an inverse ETF like DZZ or even the gold mining stock inverse ETF DUST could be played. These funds go up in value as the price of gold falls.
While I expect gold to pullback, I do not think it will make another leg lower. Instead, a test of the recent low or pierce of the low by a few bucks then reverse and start building a bullish basing pattern before going higher.
http://www.thegoldandoilguy.com/wp-content/uploads/2014/11/tgaoglogo.png00adminhttp://www.thegoldandoilguy.com/wp-content/uploads/2014/11/tgaoglogo.pngadmin2013-04-29 19:58:592014-03-06 11:42:00Gold Traders and Investors Get Ready To Rumble!
“WOW” Friday’s Precious Metals Meltdown is an understatement…. I love seeing all this fear in the market and panic selling volume jump through the roof. This is or is the “start” of the washout bottom in metals I have been talking about for a few months. Critical support levels have been broken on gold, silver and miner stocks today. This is running the stops juicing up the sell side volume.
This size of a move WILL trigger a wave of margin calls come the end of the session and it could start another strong wave of selling into the closing bell. While I like this prices for both gold and silver, I know this could be just the start of more selling. I sound like a broken record but I am not trying to catch a falling knife unless it looks like a perfect setup. I still feel we could get another 1-3 days of selling or chop down here before things go higher so I will just watch the gold and bugs get stepped on again.
Remember this chart I posted a while back… it’s now coming true:
Last day of the week is the most important for long term trends and investors. Today is going to be wild and may trigger a massive wave of selling which could be really good for those who know how to take advantage of it with me at: http://www.TheGoldAndOilGuy.com
Chris Vermeulen
http://www.thegoldandoilguy.com/wp-content/uploads/2014/11/tgaoglogo.png00adminhttp://www.thegoldandoilguy.com/wp-content/uploads/2014/11/tgaoglogo.pngadmin2013-04-12 11:35:022014-03-06 11:43:45Friday’s Precious Metals Melt-Down…. How to Manage It!
Silver and silver mining stocks are front and center for investors and active traders. Because of silvers high volatility (large price swings) it naturally attracts a lot of attention.
First you have seasoned investors who are waiting for the right opportunity to get long or short for the next move. Then you have the active traders playing the day to day price swings. Finally you get the gamblers who are salivating over the potential to double their accounts and are riding the commodity on pure emotions (Fear & Greed). All these things compound the volatility for the investment making it headline news and what everyone wants to be involved in.
The focus of this report is show you where the price of gold, silver and miner stocks are currently trading and what to lookout for in the coming days/weeks. Below is a chart of gold but silver has a similar pattern and will follow or should I say lead the price of gold in percentage terms because of its volatility.
Gold Weekly Chart:
Gold has been testing its long term support level for three weeks. I expect we see price start to move quickly sooner than later but there is potential for it to tread water here until the second half of April. We all know the saying “Sell in May and Go Away” and as we get closer to that date we should start to see money flow into the “Safe Havens” being gold, silver, and miners. While this has not happened many times on the charts I am thinking beyond them and of what the masses are likely to flock to when stocks lose their luster.
Also if you have been following the price of the dollar index you know that its getting a little overbought and when it starts to correct the falling dollar should help send precious metals higher.
Gold & Silver Miners VS Gold Bullion Performance:
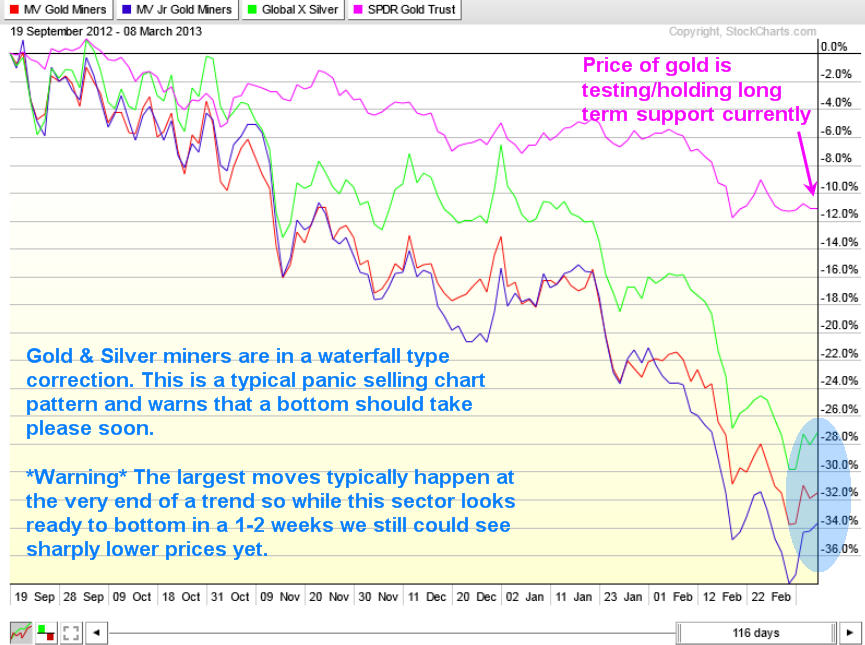
The stock market has certain chart patterns that tell chart readers what the holders of that particular investment is feeling emotionally. Knowing how to read these extreme patterns can yield some big gains and works for most investments types (stocks, bonds, commodities and currencies).
Without getting into the boring technical details precious metal stocks are starting show signs of panic selling which typically happens before a major bottom is put in place. A bottom generally takes a week or two for some type of bottoming pattern or base building to form. This is the most volatile time to be trading these investments so trade with caution.
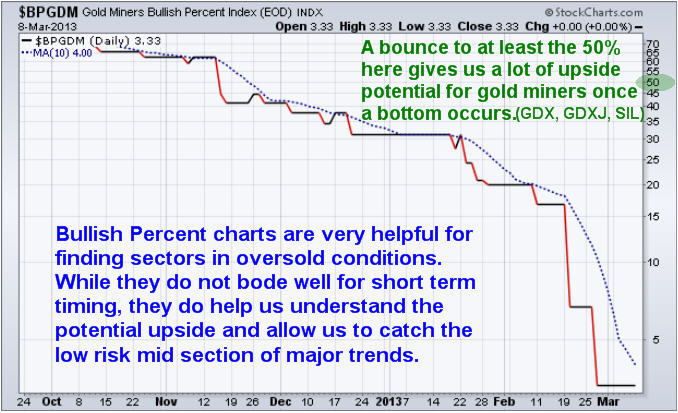
Gold Miners Bullish Percent Index:
Bullish percent indexes are a great way to see how popular an investment is. If you do not know what a bullish percent chart is then you can look it up online and learn more. The way I read it is when it’s up over 75-80 it’s a popular investment and everyone is buying it. It also means it’s in a major uptrend. But you must be aware that when everyone is buying something once price starts to turn down you better be one of the first few out the door before everyone else runs for the door and price crashes.
It’s similar but reversed for investments that are below 20. Everyone is selling, no one wants to own it but once the selling momentum stops price should rebound and rally. Keep in mind this indicator is not great for timing, but confirms that what you are looking at is either oversold, neutral or overbought in the BIG picture.
Weekend Precious Metals Trading Conclusion:
In short, I still like gold, silver, and their related mining stocks. I am watching them very closely for signs of a bottom and will be jumping on that train when the selling momentum looks to have stalled. Keep in mind that all these investments are still in a VERY STRONG DOWN TREND and trying to catch a falling knife is not what I do. Waiting for momentum to shift is my focus as there should be big upside if metals and stocks can find a bottom soon. If gold breaks down below key support as posted on the weekly chart then the uptrend may be over and it will be time to start looking for short positions.
http://www.thegoldandoilguy.com/wp-content/uploads/2014/11/tgaoglogo.png00adminhttp://www.thegoldandoilguy.com/wp-content/uploads/2014/11/tgaoglogo.pngadmin2013-03-10 21:54:052014-03-06 11:51:03Silver Miners, Gold Miners and the Price Of Gold
Over the past year my long term trends and outlooks have not changed for gold, oil or the SP500. Though there has been a lot of sideways price action to keep everyone one their toes and focused on the short term charts.
As we all know if the market does not shake you out, it will wait you out, and sometimes it will do both. So stepping back to review the bigger picture each weeks is crucial in keeping a level trading/investing strategy in motion.
The key to investing success is to always trade with the long term trend and stick with it until price and volume clearly signals a reversal/down trend. Doing this means you truly never catch the market top nor do you catch market bottoms. But the important thing is that you do catch the low risk trending stage of an investment (stage 2 – Bull Market, Stage 4 Bear Market).
Lets take a look at the charts and see where prices stand in the grand scheme of things…
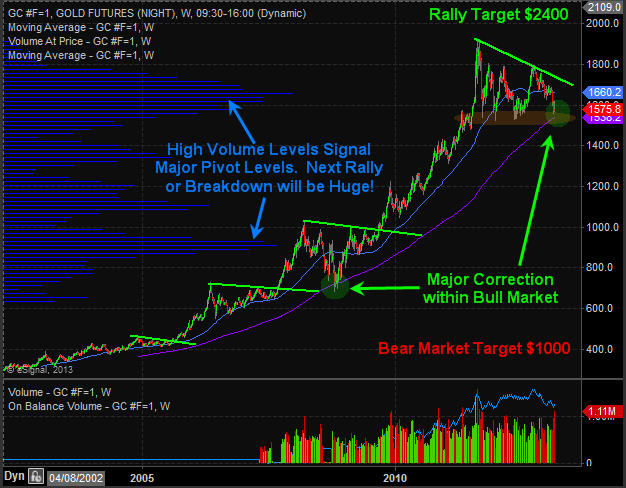
Gold Weekly Futures Trading Chart:
Last week to talk about about how precious metals are nearing a major tipping point and to be aware of those levels because the next move is likely to be huge and you do not want to miss it.
Overall gold and silver remain in a secular bull market and has gone through many similar pauses to what we are watching unfold over the past year. As mentioned above the gold market looks to be trying to not only shake investors out but to wait them out also with this 18 month volatile sideways trend.
A lot of gold bugs, gold and stock investors of mining stocks are starting to give up which can been seen in the price and selling volume for these investments recently. I am a contrarian in nature so when I see the masses running for the door I start to become interested in what everyone is unloading at bargain prices.
Gold is now entering an oversold panic selling phase which happens to be at major long term support. This bodes well for a strong bounce or start of a new bull market leg higher for this shiny metal. If gold breaks below $1500 – 1530 levels it could trigger a bear market for precious metals but until then I’m bullish at this price. I think we could see another spike lower in gold to test the $1500- $1530 level this week but after that it could be off to the races to new highs.
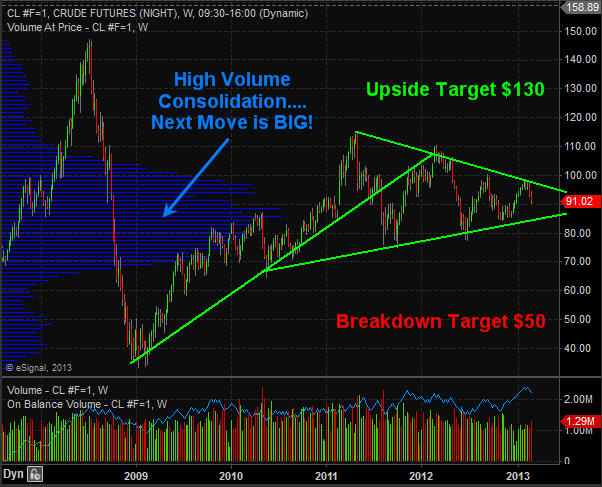
Crude Oil Weekly Trading Chart:
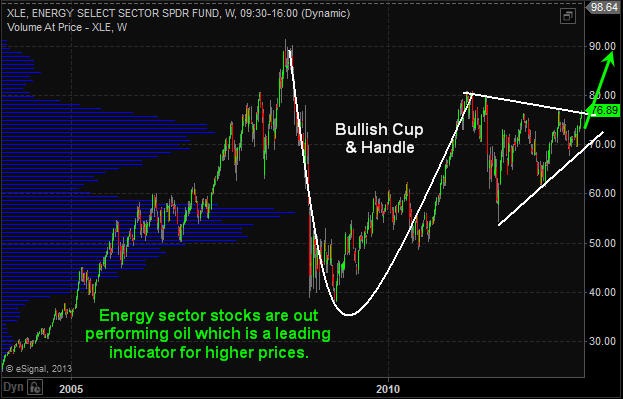
Oil had a huge bull market from 2009 until 2011 but since then has been trading sideways in a narrowing bullish range. I expect some big moves this year for oil and technical analysis puts the odds on higher prices. If we do get a breakout and rally then $130 will likely be reached. But if price breaks down then a sharp drop to $50 per barrel looks likely.
The utility sector has done well and continues to look very bullish for 2013. This high dividend paying sector is liked by many and the price action speaks for its self… If the overall financial market starts to peak then these sectors should hold up well because they are services, dividend and a commodity play wrapped in one.
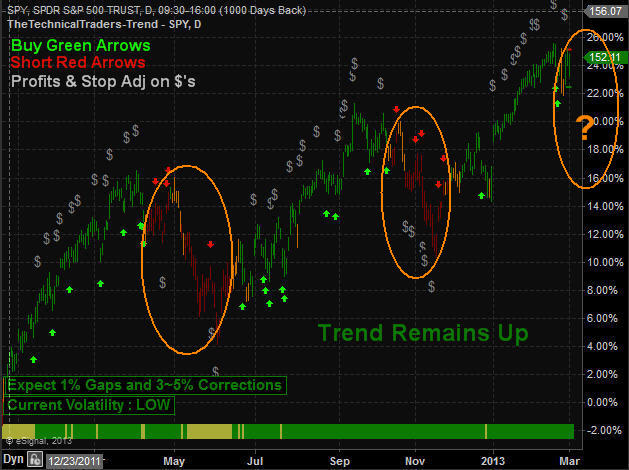
SP500 Trend Daily Chart:
The SP500 continues to be in an uptrend which I am trading with until price and volume tell me otherwise. But there are some early warning signs that another correction or a full blown bear market may be just around the corner.
Again, sticking with the uptrend is key, but knowing what to look for and prepare for is important so that when the trend does change your transition from long positions to short positions is a simple measured move in your portfolios.
Weekend Trend Conclusion:
In short, I remain bullish on stocks and commodity related stocks until I see a trend change in the SP500.
Energy sector is doing well and looks bullish for the next month. As for gold and gold miners, I feel they are entering a low risk entry point to start building a new long position. Risk is low compared to potential reward.
When the price of a commodity or index trade near the apex of a narrowing range or major long term support/resistance level volatility typically increases as fear and greed become heightened which creates larger daily price swings. So be prepared for some turbulence in the coming weeks while the market shakes things up.
If you like my work then be sure to get on my free mailing list to get these each week on various investments for investment ideas at www.GoldAndOilGuy.com
Chris Vermeulen
http://www.thegoldandoilguy.com/wp-content/uploads/2014/11/tgaoglogo.png00adminhttp://www.thegoldandoilguy.com/wp-content/uploads/2014/11/tgaoglogo.pngadmin2013-03-03 15:38:492014-03-06 11:54:08Gold, Oil & the SPX Trends and Setups