For the first time since the last week of December of 2011, the S&P 500 Index closed lower on the weekly chart. Recently I have been discussing the overbought nature of stocks based on a variety of indicators. However, the real question that should be asked is whether last week was just a short term event or if we see sustained selling in coming weeks.


The issues occurring in Greece spooked the markets somewhat on Friday as Eurozone fears continue to permeate in the mindset of traders. The U.S. Dollar Index is the real driver regarding risk in the near and intermediate term future. If the Dollar is strong, market participants will likely reduce risk. However a weakening Dollar will be a risk-on type of trading event which could lead to an extended rally in equities, precious metals, and oil.


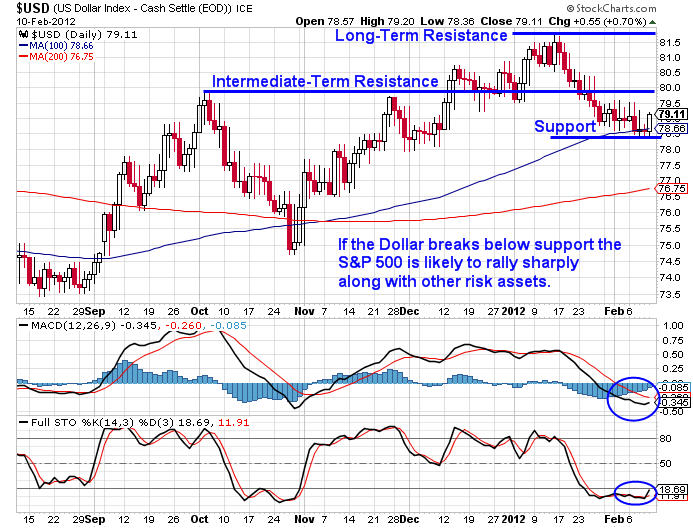
Friday marked an important day for the U.S. Dollar Index futures as for the first time in several weeks the Dollar held higher prices into a daily close. The U.S. Dollar appears to have carved out a daily swing low on the daily chart from Friday. Furthermore, the potential for a weekly swing low at the end of this week remains quite possible. The chart below illustrates how the 100 period simple moving average has offered short term support for the past few weeks.


U.S. Dollar Index Futures Daily Chart


I would also point out that the MACD is starting to converge which is a bullish signal and the full stochastics are also demonstrating a cross on the daily time frame. As long as the 100 period moving average holds price, a rally is likely in the U.S. Dollar Index in coming weeks.


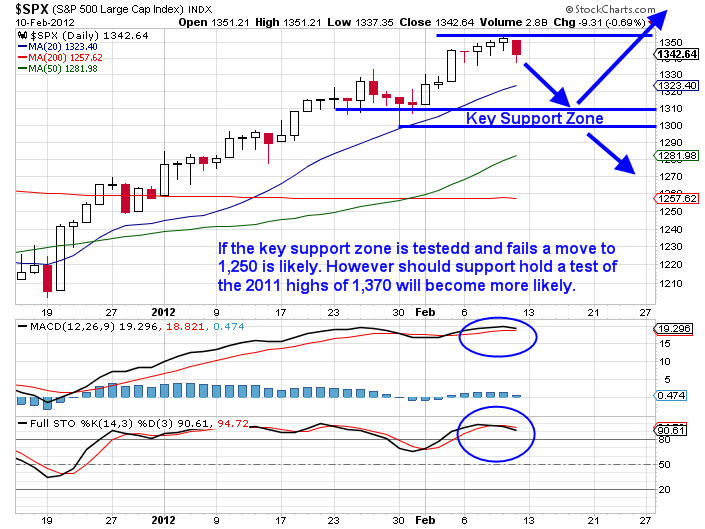
Should that rally play out, it will likely push risk assets lower. My primary target for the S&P 500 would be around the 1,300 – 1,310 price range if the selloff transpires. It is important to note that  headlines coming out of Europe could derail this analysis in short order.


Assuming that a selloff in the S&P 500 occurs it will present a difficult trading environment for market participants. Market participants are going to be in a tough position around the 1,300 price level. A rally from 1,300 could  serve to test the 2011 highs. In contrast, a confirmed breakdown of the 1,300 price level could initiate a more significant selloff towards the 1,250 area.


Should price move towards the 1,300 price level the bulls and bears will be battling it out for intermediate control of price action. This is my preferred scenario for the short-term time frame, but I would only give it about a 60% chance of success at this point in time. We simply need more time to see how price action behaves the first few session of the forthcoming week.


S&P 500 Index Bearish Scenario


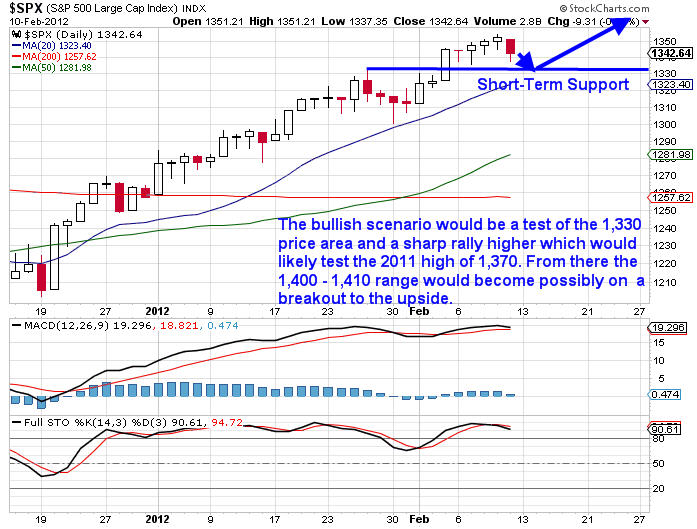
The alternate scenario which has about a 40% chance of success would be a sharp rally higher which likely would be produced by news coming out of Greece and/or the Eurozone that pushes the Euro higher. Right now risk is high due to the sensitivity of price to headline risk. With that said, the bullish alternative scenario is shown below.


S&P 500 Index Bullish Scenario

At this point we just do not have enough price information to give us clarity regarding the most probable outcome. The price action in the Euro is going to drive price action for the S&P 500 and other risk assets in weeks ahead.


Anything is possible in the short-term, but I have to give a slight edge to the bears simply based on the price action Friday and the fact that almost every indicator I follow is screaming that the equities market is severely overbought. The price action this week should be telling. Headline risk is excruciatingly high, trade safely in the coming week!

By: Chris VermeulenFree Weekly ETF Reports & Analysis: www.GoldAndOilGuy.com
Co-Author: JW JonesFree Weekly Options Reports & Analysis: www.Optionnacci.com

This material should not be considered investment advice. J.W. Jones is not a registered investment advisor. Under no circumstances should any content from this article or the OptionsTradingSignals.com website be used or interpreted as a recommendation to buy or sell any type of security or commodity contract. This material is not a solicitation for a trading approach to financial markets. Any investment decisions must in all cases be made by the reader or by his or her registered investment advisor. This information is for educational purposes only.

You can’t feel the heat until you hold your hand over the flame.

You have to cross the line just to remember where it lays.”

~ Rise Against. “Satellite” Lyrics ~

Friday morning traders and market participants awaited the key January employment report from the U.S. Bureau of Labor Statistics. The reaction to the supposedly wonderful report was a surge in the S&P 500 E-Mini futures contracts as well as several other key equity index futures.

The overall tenor among the financial punditry was predictable as wildly bullish predictions permeated the morning session on CNBC and in the financial blogosphere. However, after the report had been out for several hours notable independent voices such as Lee Adler of the Wall Street Examiner came out with information that suggested the numbers were an apparition of manipulated statistics.

I am not going to spend a great deal of time discussing the report, but the reaction to the news was decisively bullish on Friday. The question I want to know is whether Friday was a blow off top? In the recent past the S&P 500 has seen several key inflection points and intermediate-term tops form on non-farm payroll monthly announcements.

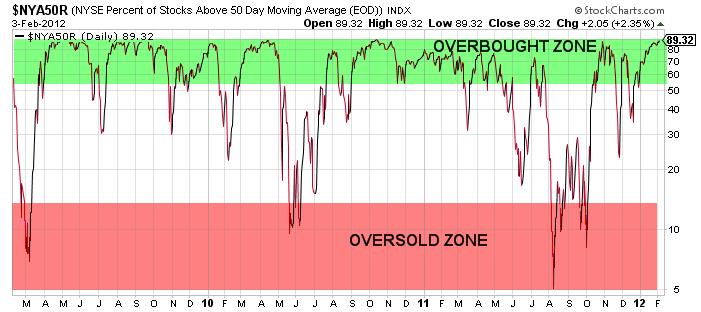
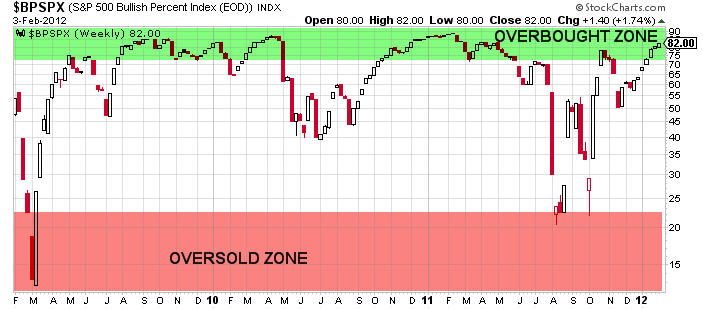
I follow a variety of indicators to help me decipher more accurately when the market is getting overbought or oversold. For nearly two weeks the market has been extremely overbought, but now we are reaching truly astonishing levels. The following charts represent just a few signals that the market is due for a pullback and a top is likely approaching.


Percentage of NYSE Stocks Trading Above Their 50 Period Moving Average

The chart above clearly illustrates that as of Friday’s closing bell (02/03) over 89% of stocks were trading above their 50 period moving averages. Consequently that reading is one of the highest levels that we have seen in the past 3 years. In addition, over 73% of stocks that trade on the NYSE are currently priced above their longer-term 200 period moving averages. Another extremely overbought signal.


S&P 500 Bullish Percent Index Weekly Chart

The S&P 500 Bullish Percent Index is another great tool for measuring the overall position of the S&P 500. It is without question that the longer term time frame is reaching the highest level of overbought conditions in the past 3 years.


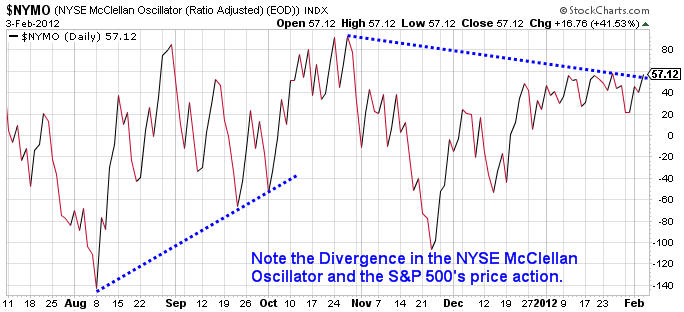
McClellan Oscillator Divergence with S&P 500 Price Action

The two charts shown above present an interesting situation regarding the divergence in the McClellan Oscillator and the price action in the S&P 500. The most recent example of this type of divergence occurred in October of 2011 and prices immediately reversed to the upside after several months of selling pressure. In fact, this correlation between reversals in the S&P 500 and divergences in the McClellan Oscillator works relatively well historically.

Clearly there are bullish voices arguing for the 2011 S&P 500 Index high of 1,370.58 to be taken out to the upside in the near future. Additionally, several market technicians in the blogospere have been pointing to the key resistance range between 1,350 and 1,370 on the S&P 500 as a likely price target. Obviously if those price levels are met strong resistance is likely to present itself. However, as a contrarian trader I have found that the more obvious price levels are the more likely it is that they either will not be tested or they will not offer significant resistance.

It is obvious that Chairman Bernanke and the Federal Reserve have embarked on a massive fiat currency printing campaign which has helped buoy risk assets to the upside. Through a combination of reducing interest rates on safety haven investments like Treasury’s and CD’s, the Federal Reserve has forced conservative investors and those living on a fixed income into riskier assets in search of yield.

This process helps elevate stock prices and creates the desired outcome for the Federal Reserve which involves the perception by average individuals that they are wealthier. The Fed calls this the “wealth effect” and they seem poised to insure that U.S. financial markets continue to ride upon a see of cheap money and liquidity.

Ultimately the Federal Reserve’s most recent announcements have served to help flatten the short end of the yield curve further while providing a launching pad for equities and precious metals. However, issues persisting in Europe could have an adverse impact on the short to intermediate term price action of the U.S. Dollar.

Right now everywhere I look I hear market prognosticators commenting on how hated the U.S. Dollar is and how Chairman Bernanke will not allow the Dollar to appreciate markedly in order to protect U.S. exports and financial markets. I think that the Dollar has the potential to rally in the short to intermediate term. Right now the U.S. Dollar Index appears to be trying to form a bottom.


U.S. Dollar Index Daily Chart

Obviously there is good reason to believe that the U.S. Dollar Index could reverse to the upside here. Whether it would have the strength to take out recent highs is unclear, but a correction to the upside not only seems unexpected by most market participants, but it seems plausible based on the weekend news coming out of Greece.

Monday morning the Greek government is set to determine if they will agree to the demands of the Troika in exchange for the next tranche of bailout funds. If the Greek government and the Troika do not come to an agreement, the Euro could sell-off violently.

Additionally there are already concerns about the next LTRO offering from the European Central Bank. The measure is to help provide European banks with additional liquidity, but there are growing concerns that the size and scope of the LTRO could have a dramatic impact on the Euro’s valuation against other currencies. Time will tell, but there are certainly catalysts which could help drive the U.S. Dollar higher.

Another potential indicator that the Dollar could see higher prices in coming days was the largely unnoticed bearish price action on Friday of precious metals. Both gold and silver have been on a tear higher over the past several weeks. Both precious metals have surged since the Federal Reserve announced that interest rates would remain near zero on the short end of the curve through 2014.

However, on Friday gold and silver were both under extreme selling pressure. The move did not get much attention by the financial media. The price action in gold and silver on Friday could be another indication that the U.S. Dollar is set to rally. The daily chart of gold is shown below.


Gold Futures Daily Chart

Obviously the reversal on Friday in gold futures was sharp. The move represented nearly a 2% decline for the session on the price of gold. However, as long term readers know I am a gold bull. I just do not see how gold and silver do not rally in the intermediate to longer term based on the insane levels of fiat currency printing going on at all of the major central banks around the world. The macro case for gold is very strong, but the short term time frame could reveal a brief pullback.

At this point, I suspect a pullback will present a good buying opportunity for those that are patient. However, I think it is critical to point out that this move in gold on Friday could be a signal that the U.S. Dollar is going to find some short to intermediate term strength. If the Dollar does start to push higher, it will likely put downward pressure on risk assets like equities and oil

While Friday’s price action may not mark a top, nearly every indicator that I follow is screaming that stocks are overbought across all time frames. Pair that with the Greece uncertainty and LTRO considerations and suddenly the Dollar starts to look a bit more attractive. Ultimately I am not going to try to pick a top, but the evidence suggests that it might not be too many days/weeks away.

By: Chris VermeulenFree Weekly ETF Reports & Analysis: www.GoldAndOilGuy.com
Co-Author: JW JonesFree Weekly Options Reports & Analysis: www.Optionnacci.com

This material should not be considered investment advice. J.W. Jones is not a registered investment advisor. Under no circumstances should any content from this article or the OptionsTradingSignals.com website be used or interpreted as a recommendation to buy or sell any type of security or commodity contract. This material is not a solicitation for a trading approach to financial markets. Any investment decisions must in all cases be made by the reader or by his or her registered investment advisor. This information is for educational purposes only.
The stock markets had a very solid session. Most charts shot higher after Apple beat estimates Tuesday night surging over 10%. This set the tone for stocks Wednesday. Also the FOMC said they would keep interest rates low until mid 2014 and projected a 2% inflation rate which took the market by surprise. Looking at the 10 minute intraday charts of gold, silver, oil, and the SP500 you would think it was the 4rth of July with everything shooting higher.

My gut feeling before the FOMC meeting was that there would be no QE3 announced. This I figured would trigger the dollar to rise which in turn would put pressure on stocks and commodities. But the low interest rates until mid 2014 was the wild card trumping that scenario.

Trading around FOMC meetings always brings a heightened level of uncertainty to traders and investors. The news is unpredictable making that much more of beast to try and out smart. I personally do not trade on any news because of the added risk involved.

Let’s take a quick look at gold and silver…

The Weekly Gold Chart:

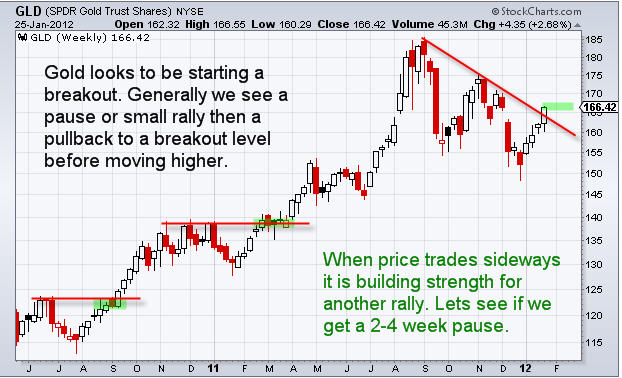
Gold has started to break out of its down trend and if it can hold up into Friday’s close then it will be a very positive sign for the shiny metal. It is still mid week and a lot can happen, so let’s see how it holds up and go from there.


The Weekly Silver Chart:

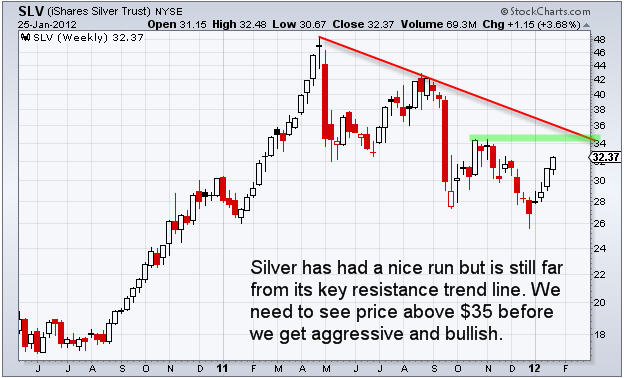
Silver has some work to do before it’s back in an uptrend on the weekly chart. I would not be surprised to see it catch up with gold and run toward the $35 resistance level in the next couple days.


Mid-Week Trend Conclusion:

In short, gold is on the move and in the next few weeks I figure we will be getting involved. Silver I think will unfold a little different from a chart pattern point of view, but I do feel there will be a buying opportunity soon also.

Looking more broad based we are seeing the stock market continue to make new highs with solid volume behind it while Crude oil continues to tread water.

Get my free weekly reports and videos here: www.GoldAndOilGuy.com

Chris Vermeulen

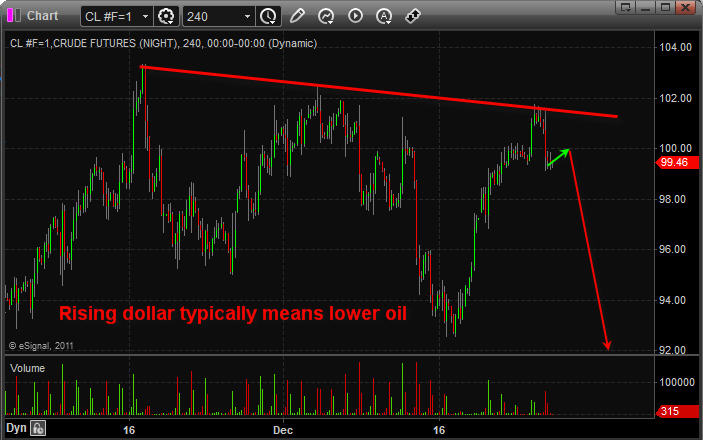
Over the past five months gold has fallen sharply and is no longer headline news which it once dominated back in 2011 when it was making new highs every day. The shiny metal has been under pressure because traders and investors started to pull some money off the table to lock in gains. Gold prices had surged so fast most advanced traders knew that final high volume surge was not sustainable. But the main reason gold topped out in my opinion was because the US Dollar index had put in a bottom and started to build a base. As we all know a rising dollar typically means lower stocks and commodity prices.

I have posted some charts below covering gold in detail using multiple time frames. The weekly which is long term, daily which is the intermediate trend and the 4 hour chart which shows gold momentum and intraday action. At the very bottom I talk about the US Dollar and what is happening with that.

Gold Weekly Long Term Trend Analysis

The weekly chart is not the most exciting time frame to follow as you will grow old watching it. That being said it is crucial for understanding the long term trend, price and volume analysis.

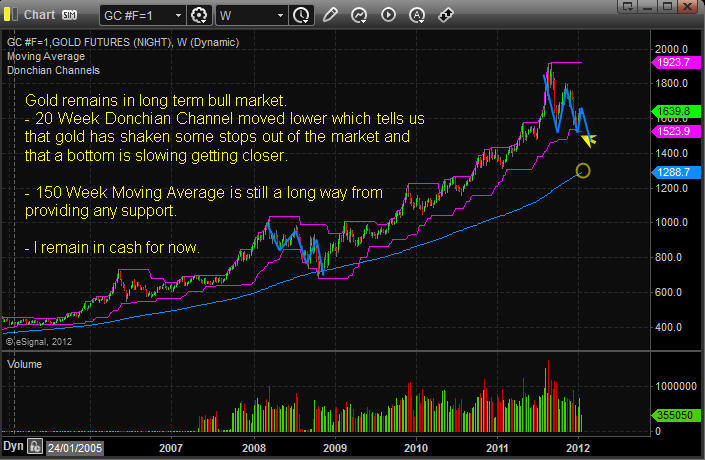
Below you can see that gold’s recent pullback has been a 3 wave correction, which is a normal pullback for any investment. But taking into account the rally from 2008 – 2011 I feel this pullback will have one more low put in before bottoming out. This would make for a 5 wave correction much like what happened in 2008.

Gold Trend Forecast


Daily Chart of Gold Showing the Intermediate Trend

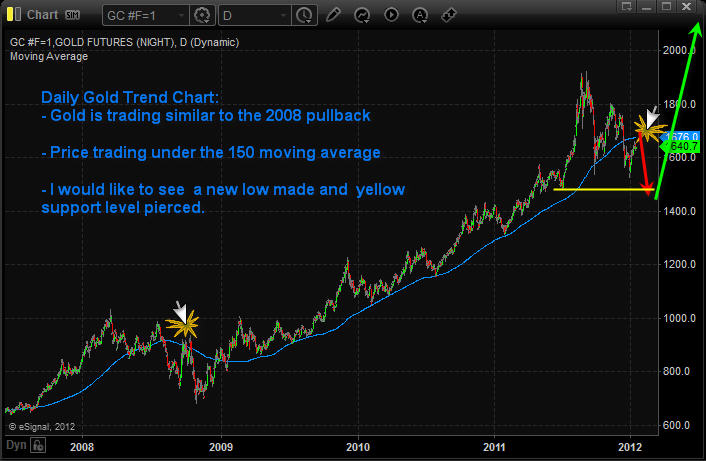
The daily chart allows us to see gold intra-week price action and use the 150 moving average which is my preferred daily moving average. As you can see we are getting a similar pullback as 2008 with gold now trading under the 150 MA.

I would like to see gold make another lower low in the next 2-3 months. If that happens I feel it complete the correction and trigger a strong multi month or multiyear rally in gold.

Gold Price Forecast


4 Hour Intraday Chart of Gold

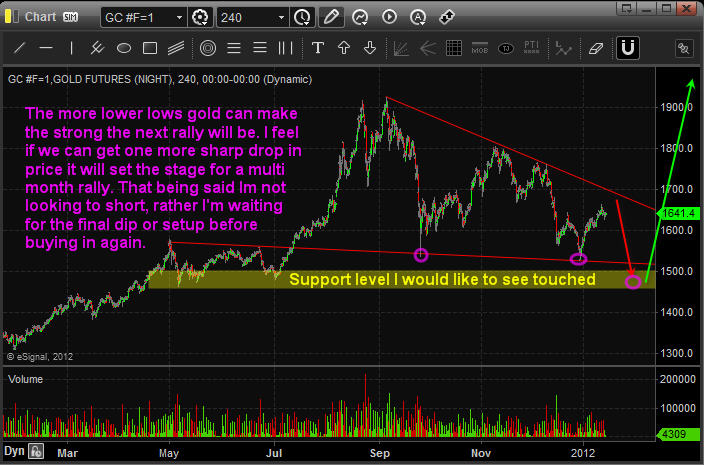
The 4 hour chart of gold allows us to see all the intraday price action which would normally not be seen with a daily chart. It also gives us enough data to build our analysis upon.

My preferred setup for gold which I feel if happens will trigger major buying in the yellow metal. If/when we get a rally in gold would also likely mean some more economic uncertainty has entered the market either from within the USA, Europe or China…

Gold Trading Newsletter Forecast


Weekly Dollar Index Long Term Analysis

The dollar has the potential to rally to the 87 – 88 level before putting in a major top. For this to happen we will need to see the Euro crumble (both currency and countries divide) in my opinion.

If you look at the weekly chart of gold and this chart of the dollar index you will notice that gold topped when the dollar bottomed. Over the past couple year’s gold and the dollar have had an inverse relationship to each other.

With all kinds of crap about to hit the fan overseas I think it’s very possible gold will rally with the dollar. Reason being there is way more people overseas who want to unload their euro’s and with all the negative talk and doubt with the US Dollar individuals will naturally want to buy more gold.

Dollar Index Trend


Weekend Trend Trading Conclusion:

In short, I expect a bumpy ride for both stocks and commodities in the first quarter of 2012. With any luck gold will pull back into my price zone shaking the majority of short term traders out just before it bottoms.  And we will be positioning ourselves for a strong rally buying into their panic selling.

To just touch base on the general stock market quickly. I have a very bearish outlook for stocks. If the dollar continues to rise it is very likely the stock market will fall into a bear market. So I am VERY cautious with stock at this time.

If you would like to receive my Weekly reports, updates and trading education videos each week join my free newsletter here: www.GoldAndOilGuy.com

Chris Vermeulen

The last week of the year volume tends to be light due to the fact that big money traders are busy enjoying the holidays and waiting for their yearend bonuses.

I was not planning on doing much this week because of the low volume but after reviewing some charts and risk levels on my top 5 trading vehicles I could not help but share my findings with everyone last Friday.

You can see what I talked about on Friday here: http://www.thegoldandoilguy.com/articles/holiday-short-squeeze-oil-trade-idea/

This Wednesday turned out to be an exciting session with all 5 of my trade ideas moving in our favour right on queue.

Charts of the 5 investments moving in the directions we anticipated …
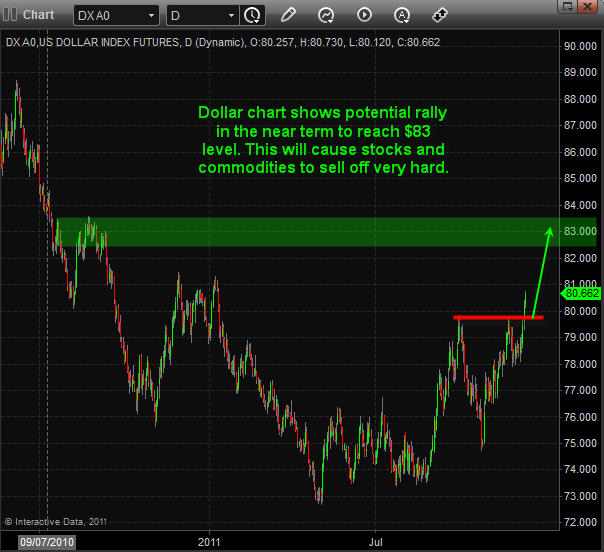
– Dollar bounced off support

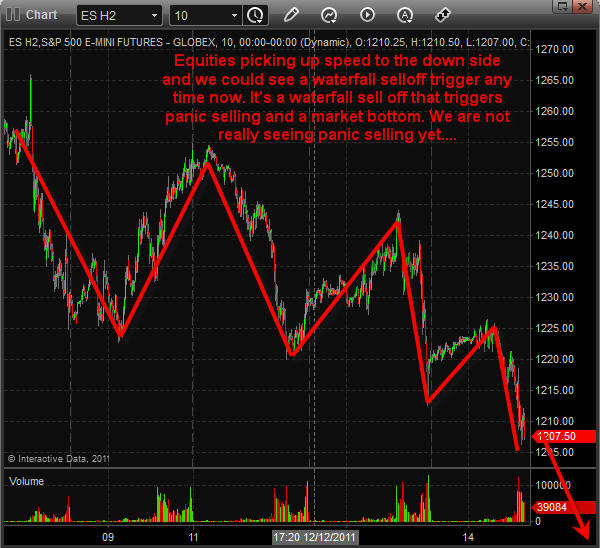
– Stocks are topping and selling off today

– Oil looks to have topped and is selling off

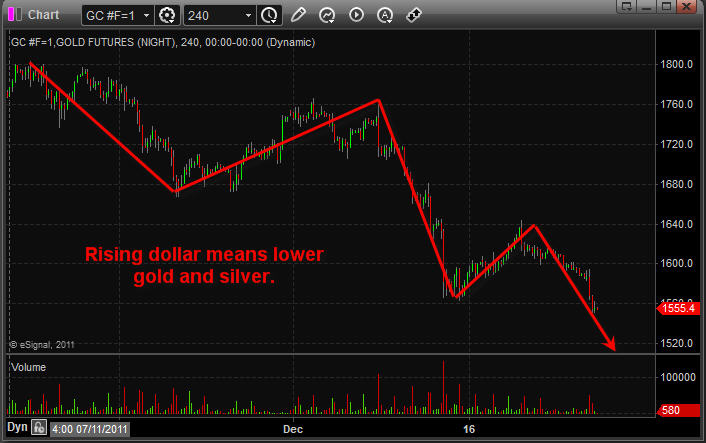
– Gold and Silver are moving lower

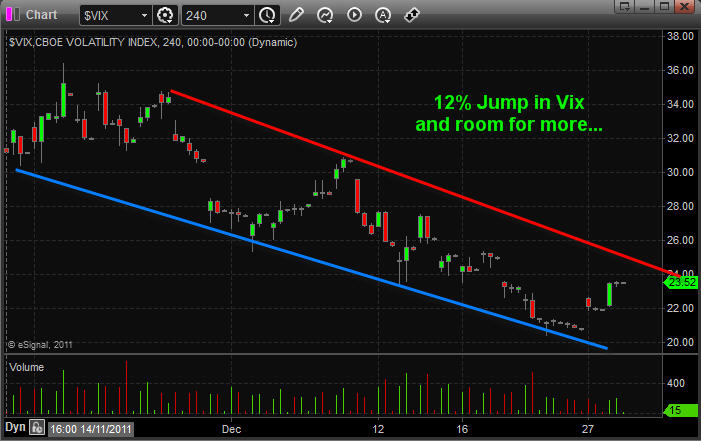
– VIX (Volatility Index) just bounced


Many of my readers took full advantage of my recent analysis and trade ideas which is great to hear.  All the different ways individuals used to make money from Friday’s analysis is mind blowing…

The most common trade is the oil one with most traders adding more to Tuesday when the price reached its key resistance level on the chart. Also many traders took partial profits Wednesday locking in 3% or more in two days using the SCO ETF.

It’s amazing how many people like to trade the vix using ETFs. The best trade from followers thus far was an 8% gain in TVIX which was bought 4 days ago anticipating the pop in volatility which I had been talking about last week. Keep in mind ETFs for trading the vix are not very good in general. I stay away from them, but TVIX is the best I found so far.

Currently stocks are oversold falling sharply from the pre-market highs. Meaning stocks have fallen too far too fast and a bounce is likely to take place Thursday.

Also we saw some panic selling hit the market today with 14 sellers to 1 buyer. That level tells me that the market needs some time to recover and build up strength for another selloff later this week or next. We will see this pause unfold when the SP500 drifts higher for a session or two with light buying volume. This will confirm sellers are in control and give us another short setup.

In my Wednesday morning video I explained how/where to set stops when using leveraged ETFs because I know 90% of traders using them do not have a clue as to how to do this and they get shaken out of their trades just before a top or bottom. So if you want to learn more about it watch this morning’s video please: http://www.youtube.com/watch?v=lDagN5Vpvys

I hope this helps you understand things more… Over time you will pickup on a lot of new trading tips, tools and techniques with this free newsletter so just give it time and keep trades small until you are comfortable with my analysis.

ONE TIME OFFER for 2012!
Learn to Trade While Making Money
http://www.thegoldandoilguy.com/specialoffer/2012TradeIdeas.html


Yet another major market correction has begun to unfold over the past couple of weeks.

I have a much different outlook on the markets than most everyone else. This likely includes you as well. However, before you stop reading what I have to say, hear me out. My outlook and opinions are based strictly on price, volume, inter-market analysis, and crowd behavior. I hope you will consider my ideas and how they might affect your current positions.

My fundamental thinking is contrarian in nature. I feel that gold and silver have risen because of obvious reasons, those mainly being the printing of money. Also, fears that fiat currencies will become obsolete in the next 5 years continue to push the metals higher.

The flaw with that thinking is that most or all of the bad news has come out with European crisis. We know there are still major issues to resolve, however, the end of the world did not happen. Looking forward 5 years, countries will likely have stopped acting like teenagers who spend more money than they have on their credit cards. Hopefully they start creating budgets which they can and will abide by.

Should this happen, it would mean that the global economy as a whole will be stronger than ever before. We may have a few bumps along the way, but I feel countries and individuals will be better positioned than ever a scant 5 years from now.

Two weeks ago, I sent my “big picture” outlook to my subscribers, followers, and financial websites in which I warned of a major pullback. You can take a quick look at what the charts looked like 2 weeks ago: http://www.thegoldandoilguy.com/articles/the-currency-war-big-picture-analysis-for-gold-silver-socks/

Since my warning we have seen the financial markets fall:
SP500 down 2.6%
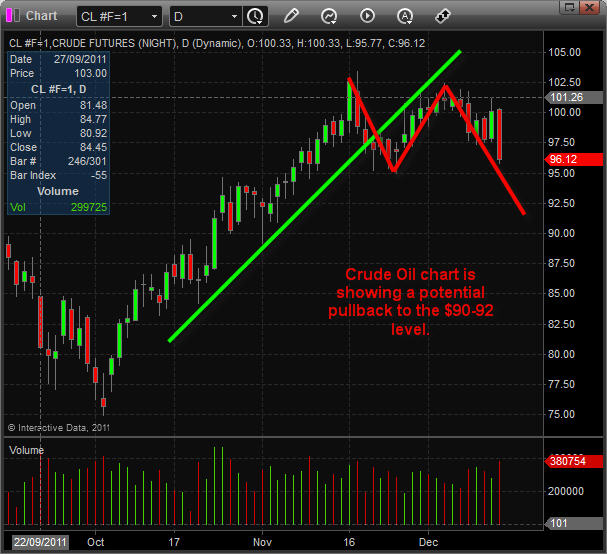
Crude Oil down 4.4%
Gold down 9.6%
and Silver down 12.2%

If you had invested in any of the leveraged exchange traded funds of these items, you could have doubled or tripled your returns. The numbers of those who have been cashing in on my advice about these recent pullbacks, have been very gratifying to hear about. The exciting part about trading is the fact that moves like this happen all the time. So if you missed this one, don’t worry because there is another opportunity just around the corner.

While my negative views on stocks and precious metals may rub the gold and silver bugs the wrong way, I just want to point out what is unfolding in an objective way in order for everyone to see both sides of the trade. I also would like to mention that this analysis can, and likely will change on a weekly basis as the financial markets and global economies evolve over time. The point I am trying to get across is that I am not a “Gloom and Doom” kind of guy. I don’t always favor the down side. Rather, I am a technical trader simply providing my analysis and giving odds for what to expect next.

Let’s take a look at some charts and dig right in…

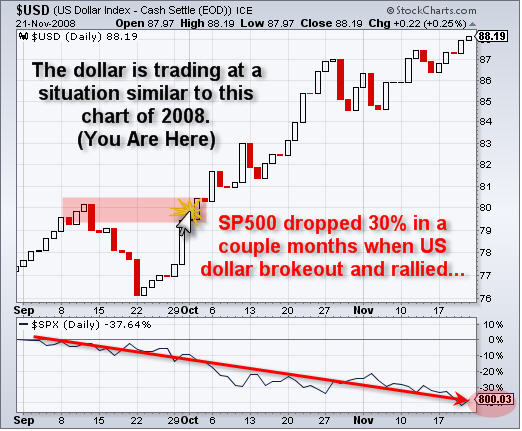
Dollar Index Daily Chart:


SP500 Futures Index Daily Chart:

Silver Futures Daily Chart:

Gold Futures Daily Chart:

Crude Oil Futures Daily Chart:

Mid-Week Market Madness Trend Analysis Conclusion:

In short, stocks and commodities are under pressure from the rising dollar. We have already seen a sizable pullback but there may be more to come in the next few trading sessions.

Overall, the charts are starting to look very negative which the majority of traders/investors around the world are starting to notice. With any luck they will fuel the market with more selling pressure pushing positions that my subscribers and I are holding deeper into the money.

Now that the masses are starting to get nervous and are beginning to sell out of their positions, I am on high alert for a panic washout selling day. This occurs when everyone around the world panics at the same time and bails out of their long positions. Prices drop sharply, volume shoots through the roof, and my custom indicators for spotting extreme sentiment levels sends me an alert to start covering my shorts and tightening our stops.

Hold on tight as this could be a crazy few trading sessions….

Get these Free Weekly Reports EVERY WEEK


Thus far in 2011 the overall stock market movement has been much different from what we had in 2010. This year we have seen nothing but sideways to lower prices with wild price swings on a day to day basis. There just has not been any really solid trends to take advantage of this year. Instead we had to actively trade the oversold dips and sell into the overbought rallies to just pull money out of the market on a monthly basis. Last year we saw 3 major rallies that lasted several months making it easy for anyone who bought into the trend to make money if managed properly.

Looking forward to 2012 it looks as though we are going to see some major changes unfold globally that will change the way we do things live our lives. Unfortunately its a very negative outlook but I do have hope that something will be done to perserve are somewhat normal lifestyles. I’m not one to talk doom and gloom, there are enough of those guys out there already so lets stick with the charts and focus on what is unfolding now in the present and how to take advantage of it…

The charts below show what I feel is likely to happen going into the new year IF we don’t get any major headline news in Europe that triggers another selloff.

Intermarket Analysis:

There are a lot of different things unfolding within stocks, commodities, currencies and bonds right now. And it is imporatnt to know that investments are inter-connected in some way. For example,  if one investment moves sharply in one direction it will have an effect on other investment classes.

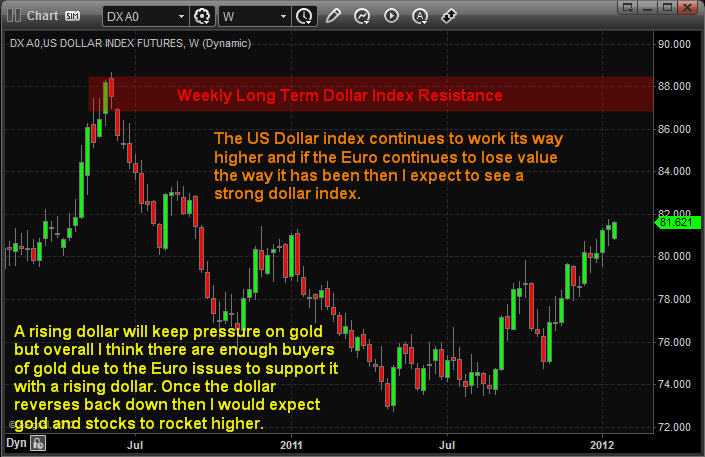
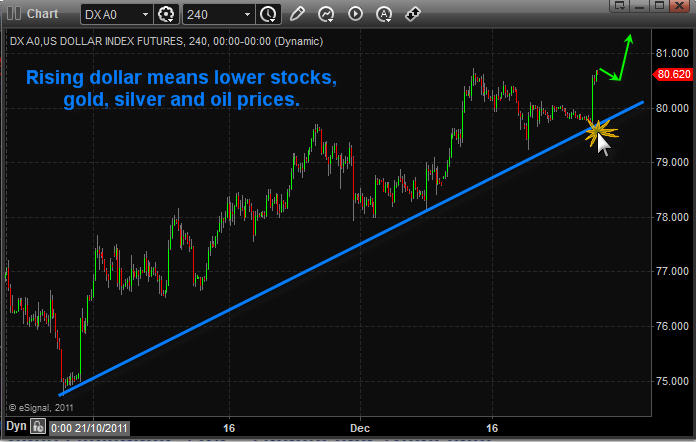
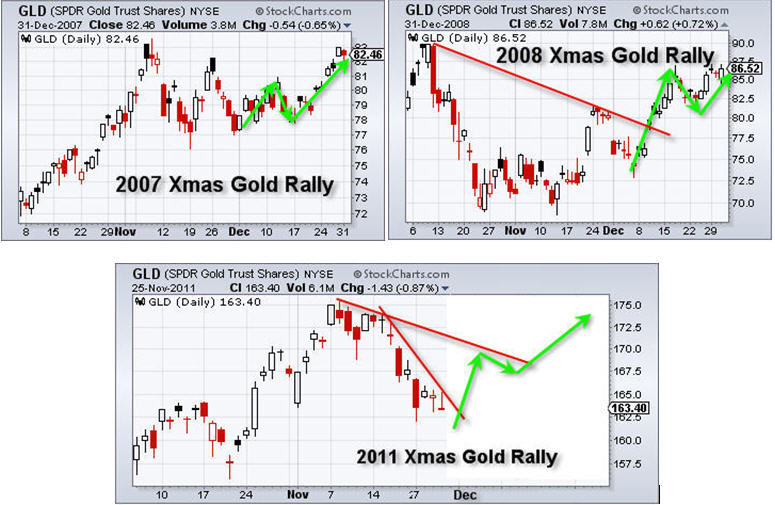
My eye is focused on the US Dollar Index which has recently had a strong run up in price. For the past couple years we have seen stocks fall when the dollar moves up. So with the dollar index now trading at a key resistance level we should see the dollar top out for a few weeks and spark a Christmas rally into year end. After that, all bets are off and we re-analyze…

On the flop side of things, if Europe comes out with major negative headline news we could see the dollar index continue its rally and breakthrough this resistance level. If the dollar moves higher from here we could easily see a multi month run up in the dollar. You do not want to be long stocks if this happens, get short stocks and hold on tight.

Dollar ETF Trading


Gold Daily Chart Analysis:

Here is my positive out look for gold and what I feel is likely to unfold near term. But keep in mind what I just said about the US dollar index above. If the dollar continues its rally and breaks out it could actually put some pressure on gold. I know gold is a safe haven so I do expect it to hold up, but a strong dollar will neutralize a lot of the buying in gold in my opinion.

Gold Christmas Rally


SP500 Daily Charts:

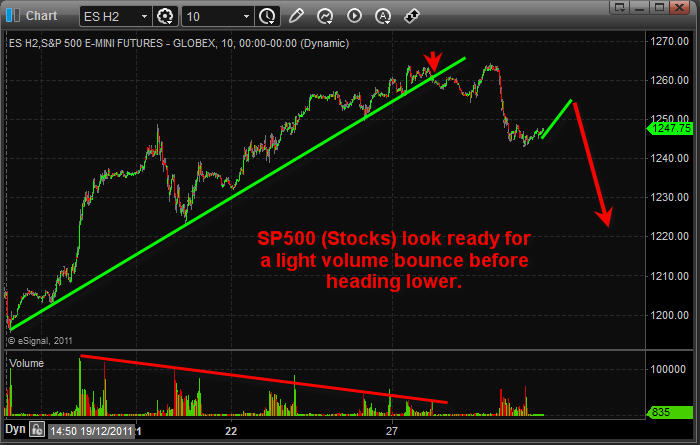
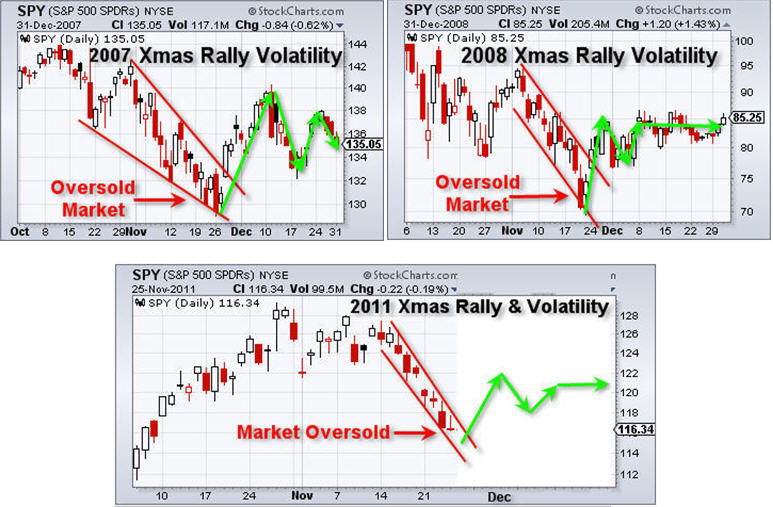
Stocks should have a solid bounce this December if the dollar finds resistance and pulls back in the coming weeks. I am expecting a bounce of 5-10% if all goes as planned.

SP500 Christmas Rally


Christmas Holiday Rally Trading Conclusion:

In short, we are entering a tough time to trade the market. Volatility is low, there are a few holidays and typically we see volume thin out as December unfolds. Light volume generally favors higher prices for stocks and commodities which is one of the reasons we get the holiday lift in prices.

The recent selloff in stocks is looking overdone to the down side and ready to bounce any day. So I am looking for signals to get long the SP500. Overall risk remains very high as sellers are still in control of the market and because we are looking to put on a trade against the intermediate trend which is down.

On Friday morning myself and my followers exited our short position on the SP500 at the open locking in 13.5% profit. We exited the position because the intraday charts are showing signs of a potential bottom and we want to avoid the tear your face off short covering rally that I feel is just around the corner. Now we are waiting for a another low risk setup and will take action to go long or short depending how things unfold in Europe.

I hope this report helped shed some light on the current market condition for you. Remember you can Get my daily pre-market trading videos, intraday updates , and trade alerts with my premium newsletter: www.TheGoldAndOilGuy.com

Chris Vermeulen

Get these Free Weekly Reports EVERY WEEK

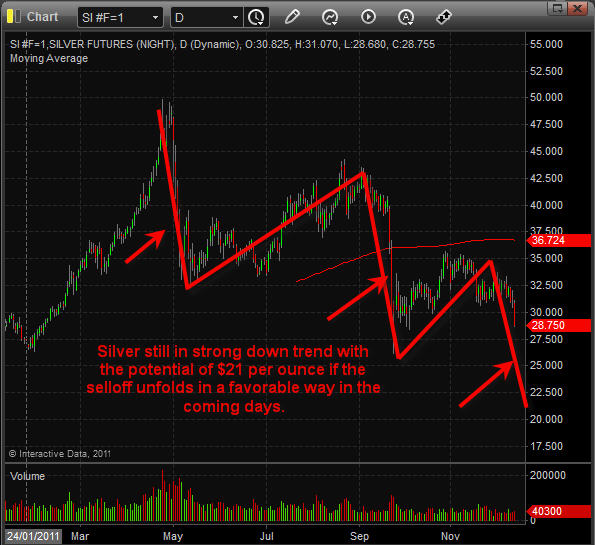
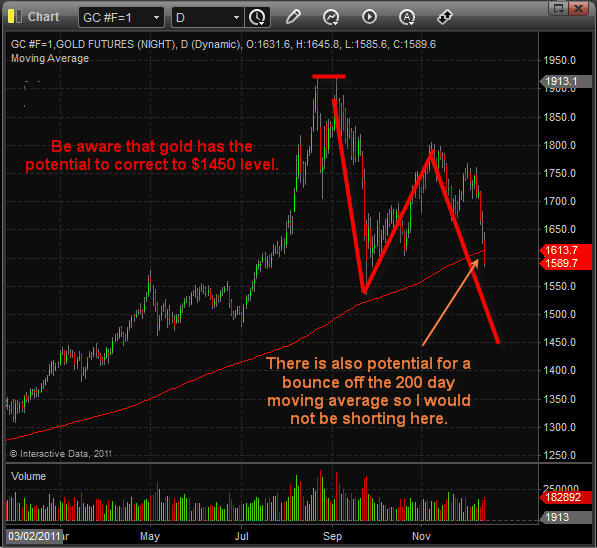
Over the recent couple months the precious metals charts have made some sizable moves. Most investors and traders were caught off guard by the sharp avalanche type selloff and lost a lot of hard earned capital in just a few trading sessions. Gold dropped over 20% and silver a whopping 40%.

The crazy thing about all this is that these types of moves in precious metals can be avoided and even taken advantage of in certain situations. There is no reason for anyone to continue holding on to those positions after they pullback 6% of more because of the type of price and volume action both gold and silver had been displaying in the past few sessions.

I warned investors on Aug 31st that precious metals were about to top any day and that protective stops should be tightened or taking profits was also a smart move. It was only 2 trading sessions later that precious metals topped and went into a free fall. You can get my detailed analysis if you read my report Dollar’s On the Verge of a Relief Rally Look Out!”.

A couple weeks later once precious metals has found support and the uneducated investor’s were licking their wounds wondering what the heck just happened to their trading accounts… I put out another report but this time with a bullish outlook. Silver was currently trading at $29.96 and I had a $35-$36 price target over the next two months. Gold was trading down at $1611 and I saw it heading back up to $1750-$1775 area before finding resistance and pulling back. Both these forecasts were reached over the next two months. You can quickly review the report called “Precious Metals Charts Point to higher Prices” for more info.

With all that said, what exactly are the charts saying right now?

Current Precious Metals Charts Summary:

The past 6 weeks we have been watching both gold and silver struggle to hold up but they have managed to grind their way to my price targets. After reaching those targets a couple weeks ago sellers have stepped back into the precious metals market and put pressure these metals.

Last week gold and silver started to pullback in a big way with rising volume. This could just be the start of something much larger which I will cover in just a moment.

The wild card for precious metals and for every stock and commodity for that matter is Europe. Every other day there seems to be headline news moving the market and most of takes place in overnight trading for those of us living in North America. It’s this wild card which is keeping me from getting aggressive in the market right now.

Let’s take a look at the charts…

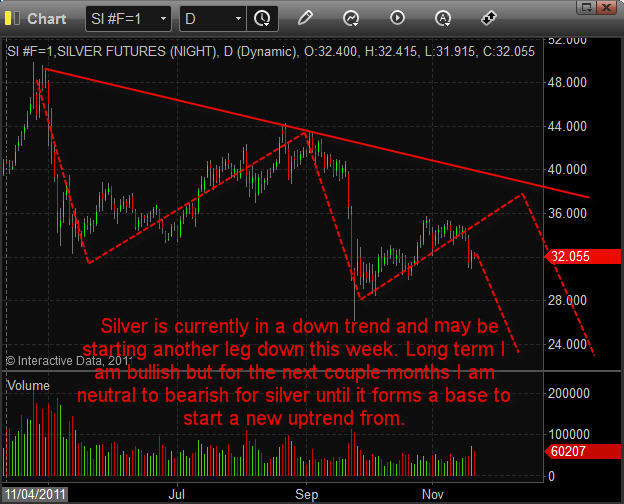
Silver Precious Metals Chart:

Silver is currently in a down trend and may be starting another leg down this week. Long term I am bullish but for the next couple months I am remain neutral to bearish for silver until it forms a base to start a new uptrend from.

Precious Metals Charts

Precious Metals Charts


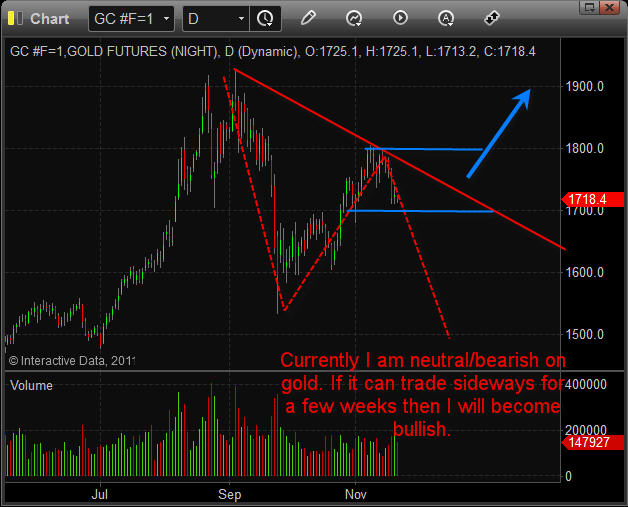
Gold Precious Metals Chart:

Currently I am neutral/bearish on gold. If it can trade sideways for a few weeks then I will become bullish.

Precious-Metals-Charts

Precious-Metals-Charts


Precious Metals Charts Conclusion:

In short, I feel there is a good chance the US dollar will continue higher and if that happens we should see strong selling in North American equities, commodities and likely on the precious metals charts.

Financial markets around the world are at a tipping point meaning something really big is about to take place. The question is which way will investment move. The only thing we can do is trade with the current trends, price patterns and volume.

At this time I still see a higher dollar and that means lower stocks and commodities. This could change at the drop of a hat depending on the news that comes out of Europe so the key to trading right now is to remain cash rich and taking only small positions in the market.

If you would like learn more about etf trading and receive my daily pre-market videos, intraday updates and detailed trade alerts which even the most novice trader can follow then join my FREE trading education newsletter and my premium trading alert service here: http://www.GoldAndOilGuy.com

Chris Vermeulen

With all eyes on the unemployment report and Europe, the CME Group’s PR Department nearly created an all out panic with their announcement after the market close on Friday relating to futures maintenance margin. The original statement was vague and I was quite concerned until I checked out the CME Group’s web-page and the PR Department sent an update clarifying their position. At this point I think the crisis has been averted, but this is just another reminder that we live in “interesting times.”

Keep in mind that if the CME starts raising margin rates across the board for futures contracts in order to protect themselves stocks and commodities could collapse. Silver recently has is margin rates increased and silver since then dropped 25% in value. So imagine if they raised the rates for more commodities…

The current price action in the marketplace pales in comparison to the world’s geopolitical tensions and deteriorating social mood. In my trading career, I have never seen the price action in the indices react so violently to intraday headlines and rumors. Risk is high and the types of traders profiting from this market are day traders and very short term traders with trades lasting  just a couple hours to 24 hours in length. Aggressive trading which small position sizes is all that can be done right now. This is not meant to be investment advice, but more as a function of the market environment in which we find ourselves currently trading within.

Right now it is hard to say where price action in the broader indices heads in the short-run.  One headline out of Greece or Italy could dramatically alter economic history. In the intermediate term I remain neutral to bearish for a number of reasons. One indicator I follow is the bullish percent index on the S&P 500 which at this point is arguing for lower prices.

The chart below illustrates the S&P 500 Bullish Percent Index:

How to trade S&P 500 Headline Driven Market

As can be seen above, the S&P 500 Bullish Percent Index is presently at an overbought status. When looking at the relative strength and full stochastics indicators one would argue that a pullback is warranted. Historically when the S&P 500 Bullish Percent Index is this overbought, a pullback ensues which ultimately sees the S&P 500 Index selloff. The more arduous task is trying to determine just how deep the pullback on the S&P 500 Index might be.

It is critical to point out that while I do believe a pullback is likely, I will not rule out a rally into the holiday season. Much of the near-term price action is going to be dictated by headlines coming out of Greece and the rest of Europe. In addition to Greece, Italy is also starting to see increased concern regarding an unsustainable fiscal condition. Depending on how the European Union handles the varying degrees of risk in the near term, we could see price action react violently in either direction.

With the market capable of moving in either direction, I wanted to point out some key price levels which should act as clues regarding potential future price action in the S&P 500. The two key support levels to monitor on the S&P 500 Index are the 1,240 and 1,220 price levels.

The daily chart of the S&P 500 Index below illustrates the price levels:

How to Trade Large Cap Stocks

For bullish traders and investors the key price level to monitor is the recent highs on the S&P 500 around the 1,290 area. The weekly chart below demonstrates why this price level is critical and which overhead levels will offer additional resistance should the recent highs be taken out to the upside.

SP500 Weekly Chart Analysis:

How to Trade Weekly Charts

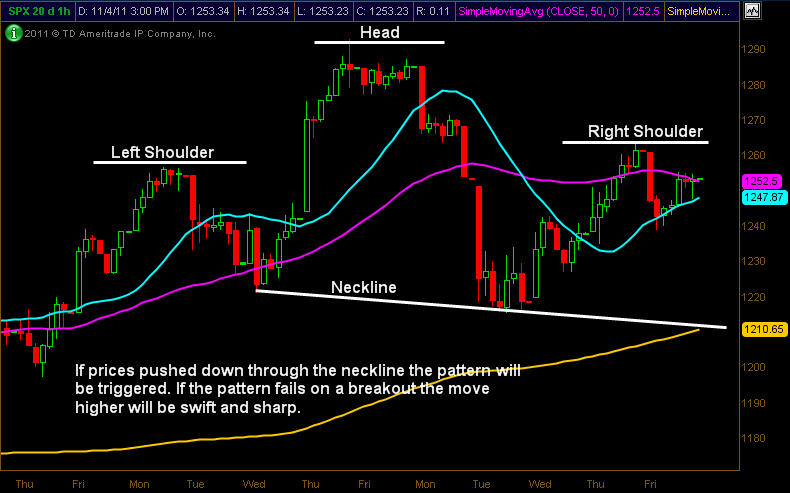
While I am neutral in the intermediate to longer term presently, in the short run I have to lean slightly bearish simply because of the future headline risk and also because a major head and shoulders pattern has been carved out on the hourly chart of the S&P 500 Index. This type of chart pattern is synonymous with bearish price action.


The hourly chart of the S&P 500 Index is shown below:

How to Trade Hourly Chart

Right now I remain slightly bearish, but should the head and shoulders pattern fail and/or we begin to see multiple positive reactions to news coming out of Europe a strong rally into the holiday season is likely. Unfortunately all we can do is monitor the key price levels and wait patiently for Mr. Market to tip his hand.

Until we see a breakout in either direction, we could see price action inhabit the 1,220 – 1,290 price range for several weeks before we get any more clarity of future direction. Until I see a breakout, I will remain relatively neutral with a slight short term bias to the downside based on price patterns in the shorter term time frames. This is a tough market to trade in, and I don’t want to get chopped around or do any heavy lifting. I’m going to focus my attention on high probability, low risk trade setups until directional biased trades make more sense.

In closing, I will leave you with the thoughtful muse of the late Texas Congresswoman Barbara Jordan,

For all of its uncertainty, we cannot flee the future.

Market Analysis and Thoughts By:

Chris Vermeulen – ETF Trading Videos & Trade Alerts

JW Jones – Options Trading videos & Options Alerts


This material should not be considered investment advice. Under no circumstances should any content from this article be used or interpreted as a recommendation to buy or sell any type of security or commodity contract. This material is not a solicitation for a trading approach to financial markets. Any investment decisions must in all cases be made by the reader or by his or her registered investment advisor. This information is for educational purposes only.
How To Trade Gold & Oil – The past couple weeks have been tough for most investors. The recent light volume rallies which have taken place in gold, oil and stocks has been generating mixed signals for technical analysts like myself. In order avoid a large draw down on your trading capital you must focus on the long term intraday charts.

What is a long term intraday chart you ask? It is simply a 4 or 8 hour candlestick or bar chart. For example the charts below in this report are 4 hour charts. So each candlestick represents 4 hours.

Why should you use these long term intraday charts instead of say a daily chart? There are four main reasons for this:

  1. If you used a daily chart then this information would be condensed showing you the daily high, low, open and closing prices. While the 4 hour futures chart shows you large multi intraday chart patterns that most traders would never see…  Patterns not seen by the average investor have a higher probability of working in your favour. Also these patterns are much larger than just normal intraday patterns which you see on the 5, 10, or 60 minute charts. Remember the larger the pattern the more potential profit there will be.
  2. These longer time frames allow us to follow gold, silver, oil and stock indexes around the clock 24/7 using futures contracts. Think about it… regular trading hours from 9:30am – 4pm ET only allows you to see 1/3rd of the price action each day. That means you are only seeing parts of larger patterns while the 24/7 contracts show you ALL Price Action.
  3. The last reason you must use futures charts is for the volume readings. Futures show real volume levels which can be used for trading. So the volume you see on ETFs will not have the proper volume levels for that specific commodity or index. More times than not it almost the opposite…
  4. My last reason for trading long term intraday futures charts is because the price of the underlying commodity or index moves true while the ETFs which try to shadow these commodities generate false breakouts and breakdowns on a regular basis. Watch my video about this here: http://www.thetechnicaltraders.com/ETF-trading-videos/TTTOct19Oil/index.html


Let’s take a look at the charts…

Gold Futures Contract – 240 Minute (4 Hour) Chart

Gold finally broke down from the bearish rising wedge which it had been forming through late September until mid October. I know the majority of traders, investors, and financial newsletters have already positioned themselves either long or short the metal as they anticipate the next major move.

I will agree that a large move either up or down is just around the corner but what sets me apart from others is the fact that I don’t bet my hard earned money when the odds are 50/50. I don’t pick tops or bottoms; rather I wait for a clean break out or low risk entry point. Only then will I take action. Until the blue box on the chart has been broken with some type of retest I will continue to observe and analyze the chart of gold.

How To Trade Gold


Crude Oil Futures Contract – 240 Minute (4 Hour) Chart

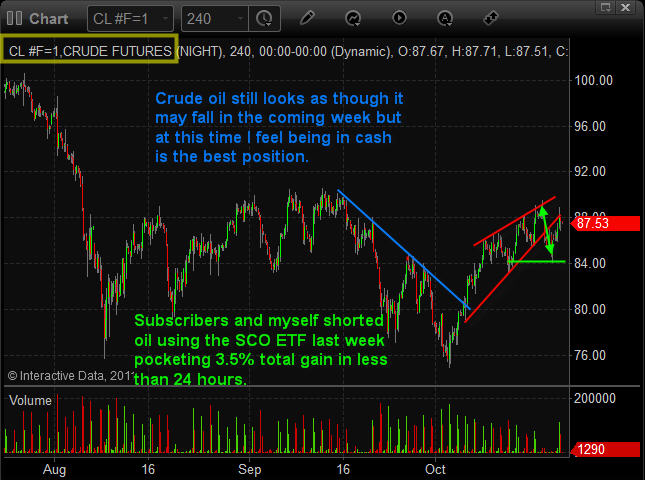
The past month crude oil trading has been very profitable for subscribers and me. We shorted crude oil using an inverse etf in September which moved over 20% in our favour within a few trading sessions. And just last week we shorted it again for a 7.5% move in less than 24 hours.

Overall I am still bearish on oil but have moved to cash until I see another high probability setup unfolding. The recent price action in crude oil makes the odds about a 50/50 bet as to which way it will break next. This is why I have moved back to cash and pocketed the quick gain.

How To Trade Oil


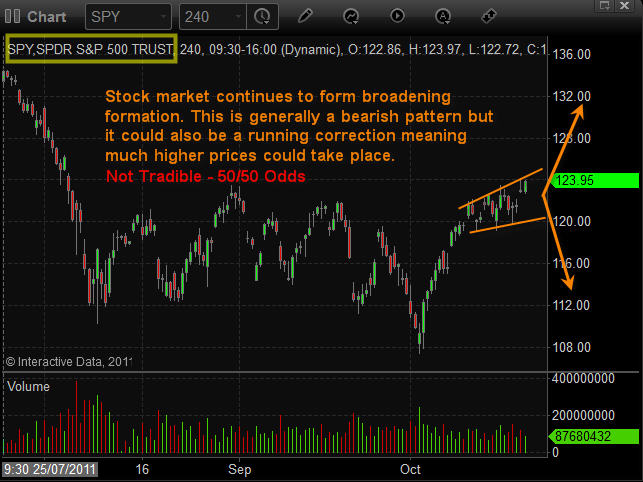
SP500 Exchange Traded Fund – 240 Minute (4 Hour) Chart

This chart is not the SP500 futures contract. This is just the SPY ETF but what I wanted to show was how the market was showing mixed signals. The past couple weeks price has been broadening and this can be taken two different ways…

More times than not it is seen as a bearish pattern and price generally falls afterwards. But in rare situations which I think we could be experiencing now this broadening price action can be very bullish, meaning much higher prices ahead. So I continue to observe and prepare for a possible trade setup.

How To Trade Indexes


Weekend Gold, Oil and Stocks Trend Conclusion:

In short, I feel the market is on the verge of a strong move. The problem is that price action, market sentiment and economic news are all giving mixed signals…

The best position right now is in cash and if something unfolds this week to our favour, then we will get involved but I am not going to take a 50/50 guess on what the next move is until the odds are in favour to one side or the other.

August until now (October 24) the SP500 is down -3.7% and Gold is up 1.1%, Silver is down 20% and oil is down -7.2. Subscribers of my newsletter have pocketed over 38.5% in total gains using my simple low risk ETF trading alerts.

Get My FREE Bi-Weekly Trading Reports and Videos by joining my free newsletter here: www.GoldAndOilGuy.com

Chris Vermeulen

If you have a website and would like these reports and videos displayed instantly on your financial website use my Best Free Financial RSS Feeds.