How to trade Gold and other precious metals related investments is not that complex. But you must be willing to wait for price to provide low risk entry points before getting involved. Precious metals are like any other investment in respect to trading and investing in them. There are times when you should be long, times to be in cash and times to be short (benefit from falling prices).

Since 2011 when gold and silver started another major bull market correction the best position has been to move to cash or sell/write options against your positions to protect your investment until the next trend resumes.

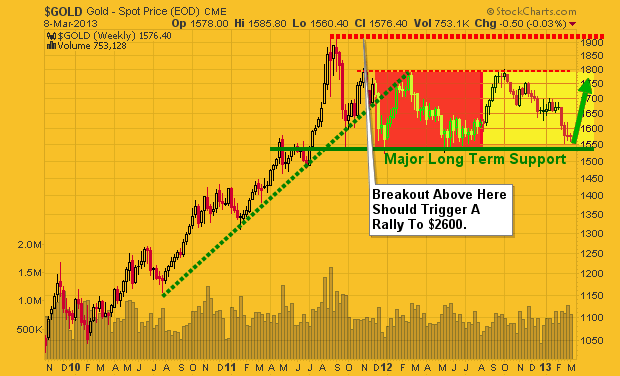
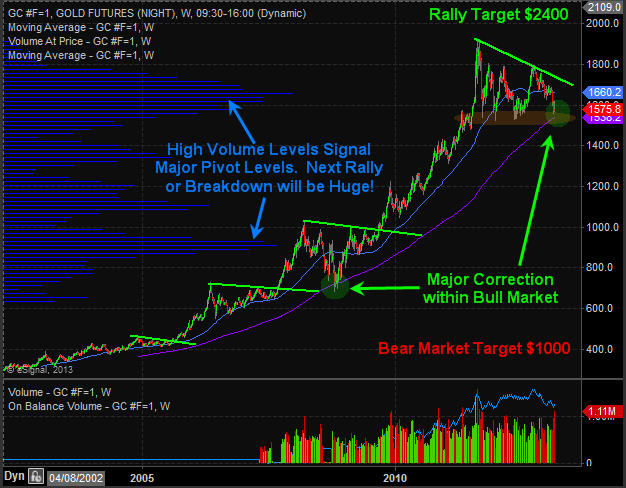
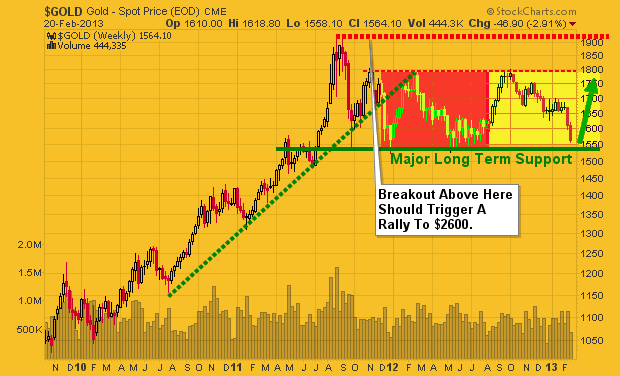
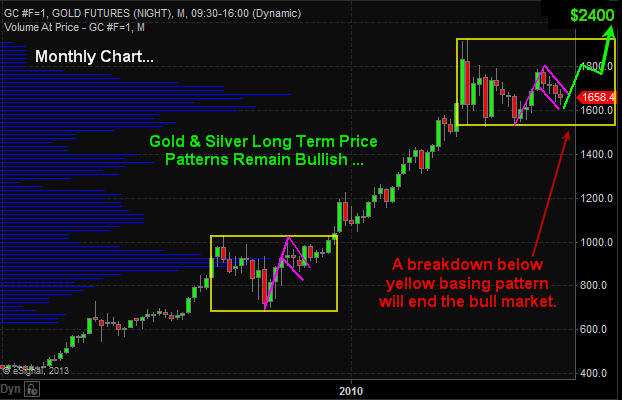
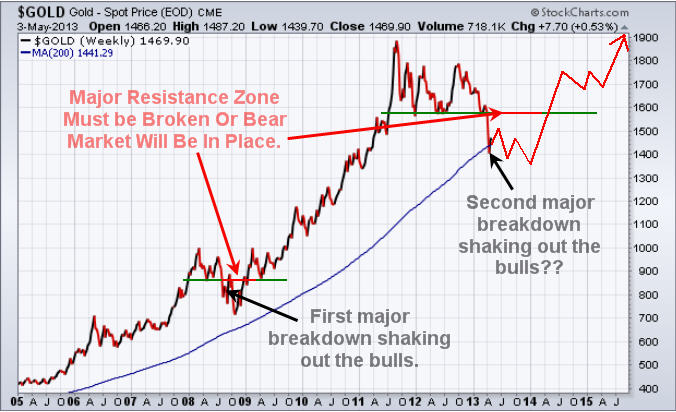
If you take a look at the chart below of gold you will notice that in 2008 we had a similar breakdown in price which purged the market of investors who where long gold. And if you compare the last two breakdowns they look very much the same. If price holds true then much higher prices are likely to unfold at the end of 2013.

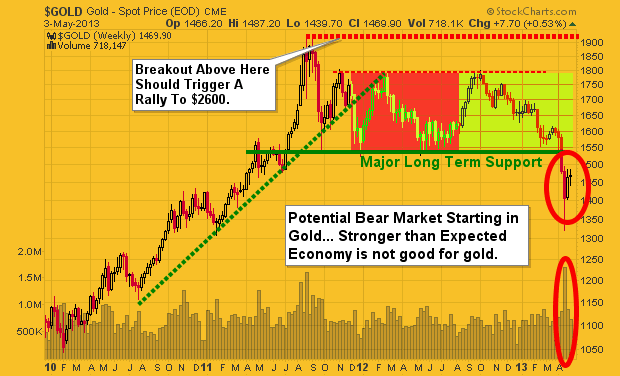
The key here is for the price to move and hold above the major resistance line. If it can do that then we are looking at a possible breakout to $2600 – $3500 gold. With that being said gold and silver may just be starting a bear market. Depending what the price of gold does when my resistance level is touched, my outlook may change from bullish to bearish.

Also with last weeks economic numbers getting better in the USA I do have concerns that gold may be starting a bear market but we will not know for several more months yet.

LongTermWeeklyGold


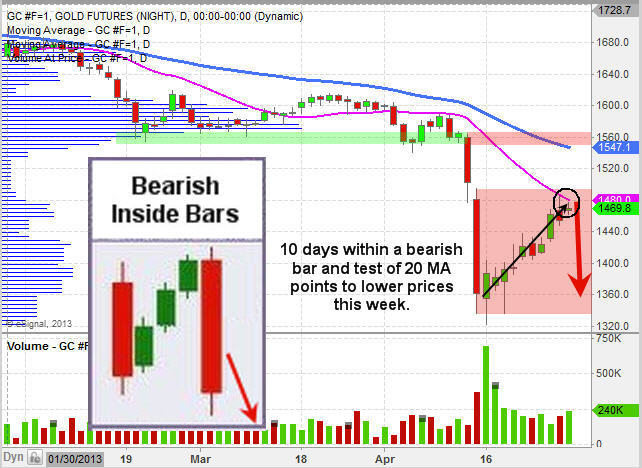
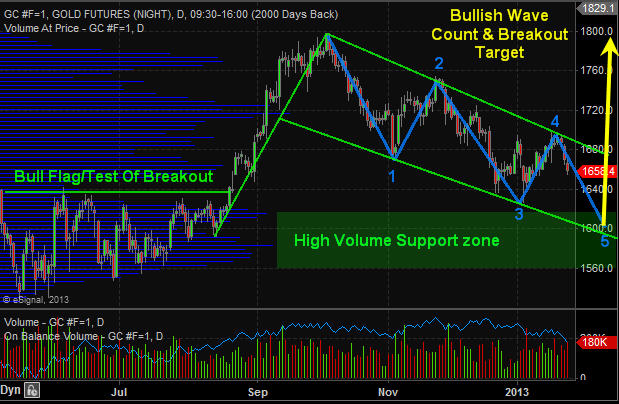
How to Trade Gold Daily Technical Chart:

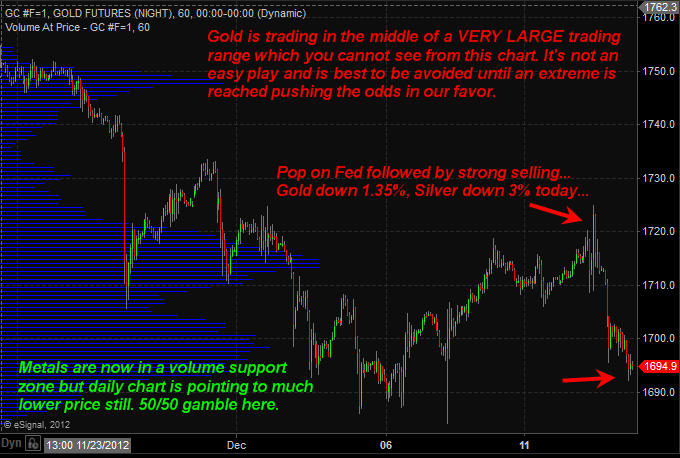
Major technical damage has been done to the chart of gold. This can be seen as bullish or bearish price action but until price and volume pattern unfolds which puts the odds on the bullish or bearish side I remain neutral.

LongTermGold


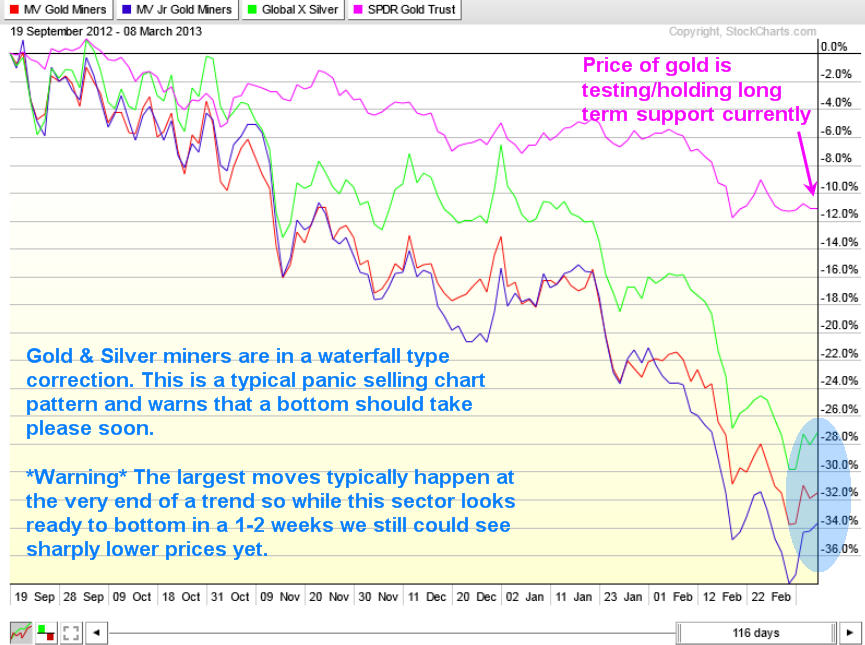
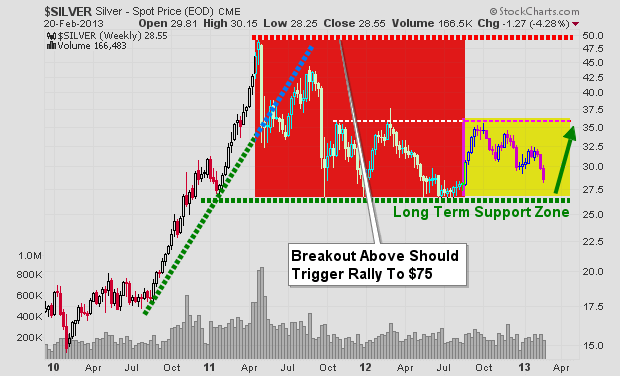
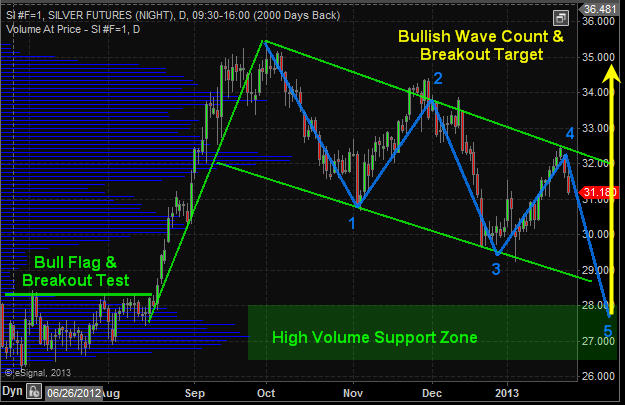
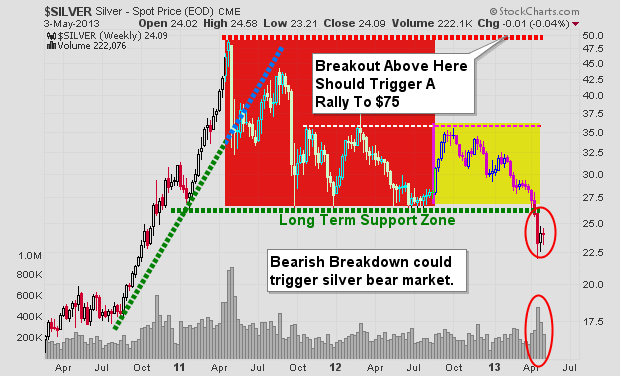
How to Trade Silver Daily Technical Chart:

Silver is in the same position as gold. The question is if this is a shakeout or breakdown…

LongTermSilver


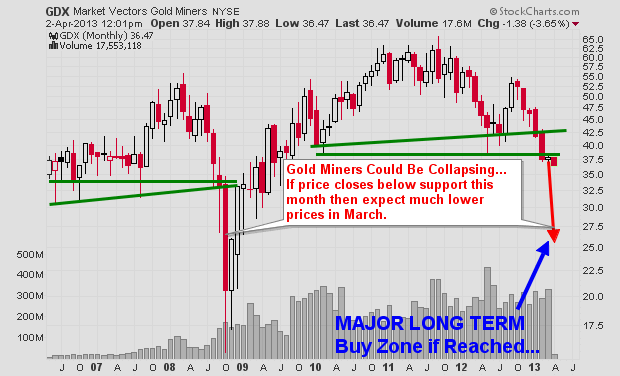
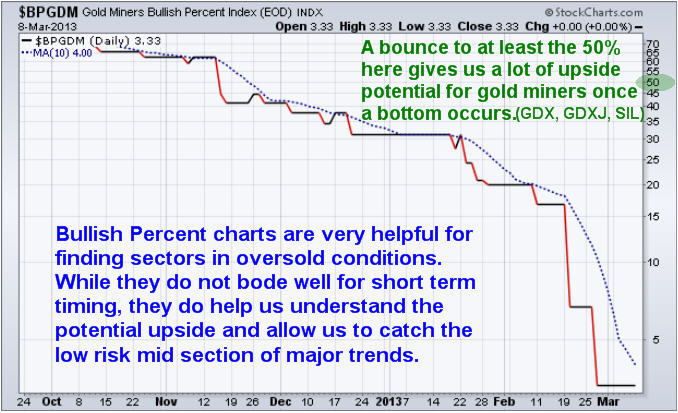
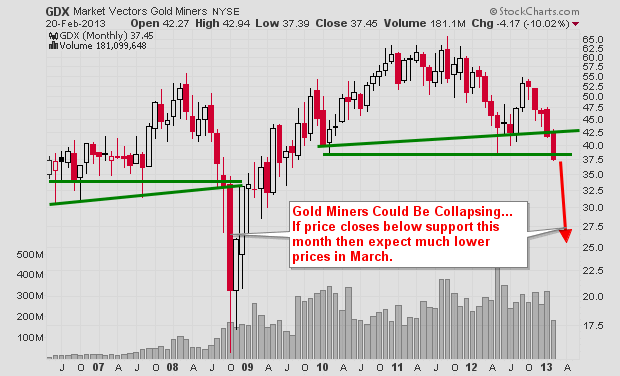
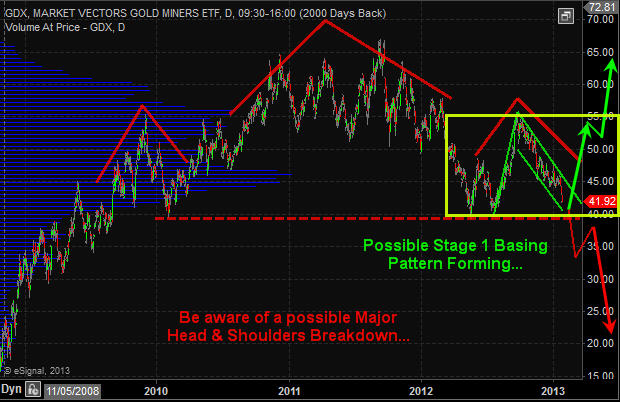
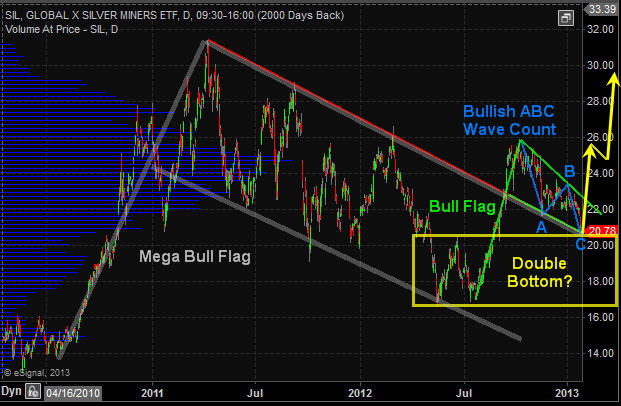
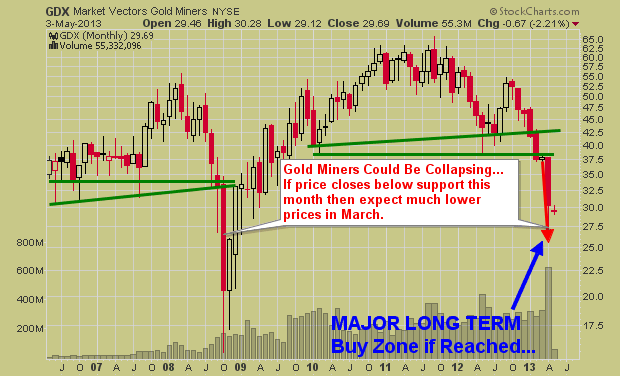
How to Trade Gold Mining Stocks Monthly Chart:

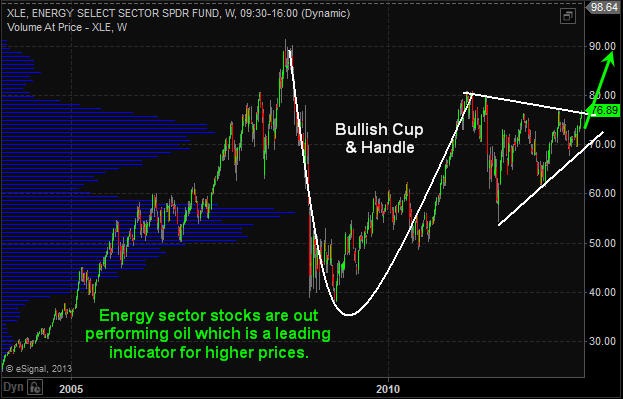
Gold mining stocks broke down a couple months ago and continue to sell off. If precious metals continue to move lower then mining stocks will continue their journey down. The chart below made in February and it has in most part played out as expected. While I do not try to pick bottoms (catch falling knives) I do like to watch for them so I am prepared for a new position when the time and chart become bullish.

LongTermMiners


How to Trade Gold, Silver and Mining Stocks Conclusion:

In short, precious metals continue to be in a down trend. While they look to be trying to bottom it is important to remember that the largest moves take place in the last 10% of a trend. So we may be close to a bottom but there could be sharply lower prices yet.

The time will come when another major buy or short signal forms and when it does we will be getting involved. The exciting part is that it could be just around the corner. If you want to keep current and take advantage of the next major move be sure to join me free newsletter here: http://www.GoldAndOilGuy.com/

Chris Vermeulen

On April 12th I wrote a blog post titled Precious Metals Melt-Down, and How To Manage It. I talked about how gold, silver and gold mining stocks have been flying under the media radar for over a year and that they were not catching the attention of traders, investors and the public anymore. I also said it would take some sharp price action (breakdown or rally) for it to be front and center again on TV, Radio and Newspapers.

But since gold has plummeted 17.5% dropping from $1600 down to $1320 per ounce with silver and gold stocks falling also they are now headline news once again. This move has caused some serious damage to the charts when looking at it from a technical analysis point of view. Below are some basic analysis points that show a new swing trading entry point.

The Technical Traders Chart Analysis:

Broken Support – Once a support level has been broken it becomes resistance. Gold is trading under a major resistance level.

Momentum Bursts – Since the April 15th low, gold has been setting up for another short selling entry point. Remember the market tends to move in bursts of three, seven or ten days then price reverses direction or pauses. It has now been 10 days.

Moving Average Resistance – Gold has worked its way up to the 20 day moving average which can act as resistance.

Bearish Inside Bars – This type of chart pattern points to lower prices. When there is a big down day followed by 3, 7 or 10 up days inside the price action of the down bar we can typically expect another sharp drop which tests the recent lows as shown with the arrow on the chart.

GoldBear


Gold Short Selling Conclusion:

In short, gold is setting up for a low risk entry point that should allow us to profit from lower gold prices. Using an inverse ETF like DZZ or even the gold mining stock inverse ETF DUST could be played. These funds go up in value as the price of gold falls.

While I expect gold to pullback, I do not think it will make another leg lower. Instead, a test of the recent low or pierce of the low by a few bucks then reverse and start building a bullish basing pattern before going higher.

Get My Book Free and Learn How To Manage Your Trades, Money & Emotions: http://www.thegoldandoilguy.com/trade-money-emotions.php

Chris Vermeulen

“WOW” Friday’s Precious Metals Meltdown is an understatement…. I love seeing all this fear in the market and panic selling volume jump through the roof. This is or is the “start” of the washout bottom in metals I have been talking about for a few months. Critical support levels have been broken on gold, silver and miner stocks today. This is running the stops juicing up the sell side volume.

This size of a move WILL trigger a wave of margin calls come the end of the session and it could start another strong wave of selling into the closing bell. While I like this prices for both gold and silver, I know this could be just the start of more selling. I sound like a broken record but I am not trying to catch a falling knife unless it looks like a perfect setup. I still feel we could get another 1-3 days of selling or chop down here before things go higher so I will just watch the gold and bugs get stepped on again.

Remember this chart I posted a while back… it’s now coming true:

WATCH VIDEO ABOUT TODAY’S SILVER & GOLD SELLOFF: http://youtu.be/7dnM33V8dIo

Last day of the week is the most important for long term trends and investors. Today is going to be wild and may trigger a massive wave of selling which could be really good for those who know how to take advantage of it with me at: http://www.TheGoldAndOilGuy.com

Chris Vermeulen

Silver and silver mining stocks are front and center for investors and active traders. Because of silvers high volatility (large price swings) it naturally attracts a lot of attention.

First you have seasoned investors who are waiting for the right opportunity to get long or short for the next move. Then you have the active traders playing the day to day price swings. Finally you get the gamblers who are salivating over the potential to double their accounts and are riding the commodity on pure emotions (Fear & Greed). All these things compound the volatility for the investment making it headline news and what everyone wants to be involved in.

The focus of this report is show you where the price of gold, silver and miner stocks are currently trading and what to lookout for in the coming days/weeks. Below is a chart of gold but silver has a similar pattern and will follow or should I say lead the price of gold in percentage terms because of its volatility.

Gold Weekly Chart:

Gold has been testing its long term support level for three weeks. I expect we see price start to move quickly sooner than later but there is potential for it to tread water here until the second half of April. We all know the saying “Sell in May and Go Away” and as we get closer to that date we should start to see money flow into the “Safe Havens” being gold, silver, and miners. While this has not happened many times on the charts I am thinking beyond them and of what the masses are likely to flock to when stocks lose their luster.

Also if you have been following the price of the dollar index you know that its getting a little overbought and when it starts to correct the falling dollar should help send precious metals higher.

Gold3

Gold & Silver Miners VS Gold Bullion Performance:

The stock market has certain chart patterns that tell chart readers what the holders of that particular investment is feeling emotionally. Knowing how to read these extreme patterns can yield some big gains and works for most investments types (stocks, bonds, commodities and currencies).

Without getting into the boring technical details precious metal stocks are starting show signs of panic selling which typically happens before a major bottom is put in place. A bottom generally takes a week or two for some type of bottoming pattern or base building to form. This is the most volatile time to be trading these investments so trade with caution.

Gold1


Gold Miners Bullish Percent Index:

Bullish percent indexes are a great way to see how popular an investment is. If you do not know what a bullish percent chart is then you can look it up online and learn more. The way I read it is when it’s up over 75-80 it’s a popular investment and everyone is buying it. It also means it’s in a major uptrend. But you must be aware that when everyone is buying something once price starts to turn down you better be one of the first few out the door before everyone else runs for the door and price crashes.

It’s similar but reversed for investments that are below 20. Everyone is selling, no one wants to own it but once the selling momentum stops price should rebound and rally. Keep in mind this indicator is not great for timing, but confirms that what you are looking at is either oversold, neutral or overbought in the BIG picture.

Gold2


Weekend Precious Metals Trading Conclusion:

In short, I still like gold, silver, and their related mining stocks. I am watching them very closely for signs of a bottom and will be jumping on that train when the selling momentum looks to have stalled. Keep in mind that all these investments are still in a VERY STRONG DOWN TREND and trying to catch a falling knife is not what I do. Waiting for momentum to shift is my focus as there should be big upside if metals and stocks can find a bottom soon. If gold breaks down below key support as posted on the weekly chart then the uptrend may be over and it will be time to start looking for short positions.

You can get my free weekly reports and ideas here: www.GoldAndOilGuy.com

Chris Vermeulen

Over the past year my long term trends and outlooks have not changed for gold, oil or the SP500. Though there has been a lot of sideways price action to keep everyone one their toes and focused on the short term charts.

As we all know if the market does not shake you out, it will wait you out, and sometimes it will do both. So stepping back to review the bigger picture each weeks is crucial in keeping a level trading/investing strategy in motion.

The key to investing success is to always trade with the long term trend and stick with it until price and volume clearly signals a reversal/down trend. Doing this means you truly never catch the market top nor do you catch market bottoms. But the important thing is that you do catch the low risk trending stage of an investment (stage 2 – Bull Market, Stage 4 Bear Market).

Lets take a look at the charts and see where prices stand in the grand scheme of things…

Gold Weekly Futures Trading Chart:

Last week to talk about about how precious metals are nearing a major tipping point and to be aware of those levels because the next move is likely to be huge and you do not want to miss it.

Overall gold and silver remain in a secular bull market and has gone through many similar pauses to what we are watching unfold over the past year. As mentioned above the gold market looks to be trying to not only shake investors out but to wait them out also with this 18 month volatile sideways trend.

A lot of gold bugs, gold and stock investors of mining stocks are starting to give up which can been seen in the price and selling volume for these investments recently. I am a contrarian in nature so when I see the masses running for the door I start to become interested in what everyone is unloading at bargain prices.

Gold is now entering an oversold panic selling phase which happens to be at major long term support. This bodes well for a strong bounce or start of a new bull market leg higher for this shiny metal. If gold breaks below $1500 – 1530 levels it could trigger a bear market for precious metals but until then I’m bullish at this price. I think we could see another spike lower in gold to test the $1500- $1530 level this week but after that it could be off to the races to new highs.

GoldWeekly


Crude Oil Weekly Trading Chart:

Oil had a huge bull market from 2009 until 2011 but since then has been trading sideways in a narrowing bullish range. I expect some big moves this year for oil and technical analysis puts the odds on higher prices. If we do get a breakout and rally then $130 will likely be reached. But if price breaks down then a sharp drop to $50 per barrel looks likely.

OilWeekly

Utility & Energy Stocks – XLU – XLE – Weekly Investing Chart

The utility sector has done well and continues to look very bullish for 2013. This high dividend paying sector is liked by many and the price action speaks for its self… If the overall financial market starts to peak then these sectors should hold up well because they are services, dividend and a commodity play wrapped in one.

XLURally

XLERally


SP500 Trend Daily Chart:

The SP500 continues to be in an uptrend which I am trading with until price and volume tell me otherwise. But there are some early warning signs that another correction or a full blown bear market may be just around the corner.

Again, sticking with the uptrend is key, but knowing what to look for and prepare for is important so that when the trend does change your transition from long positions to short positions is a simple measured move in your portfolios.

SPYTrend


Weekend Trend Conclusion:

In short, I remain bullish on stocks and commodity related stocks until I see a trend change in the SP500.

Energy sector is doing well and looks bullish for the next month. As for gold and gold miners, I feel they are entering a low risk entry point to start building a new long position. Risk is low compared to potential reward.

When the price of a commodity or index trade near the apex of a narrowing range or major long term support/resistance level volatility typically increases as fear and greed become heightened which creates larger daily price swings. So be prepared for some turbulence in the coming weeks while the market shakes things up.

If you like my work then be sure to get on my free mailing list to get these each week on various investments for investment ideas at www.GoldAndOilGuy.com

Chris Vermeulen

Since silver and gold topped in 2011 investors have been struggling with these positions hoping this cyclical bull market for metals continues. The simple truth is no one knows for sure if prices will continue and make new highs and those who say its a for sure thing we all know deep down is full of bull crap.

All investments move in cycles, waves or trends which ever you want to call it. The market has 4 simple yet distinct stages each require a completely different skill set and trading tactics to navigate.

Stage 1 – After a period of decline a stock consolidates at a contracted price range as buyers step into the market and fight for control over the exhausted sellers. Price action is neutral as sellers exit their positions and buyers begin to accumulate the stock.

Stage 2 – Upon gaining control of price movement, buyers overwhelm sellers and a stock enters a period of higher highs and higher lows. A bull market begins and the path of least resistance is higher. Traders should aggressively trade the long side, taking advantage of any pullback or dips in the stock’s price.

Stage 3 – After a prolonged increase in share price the buyers now become exhausted and the sellers again move in. This period of consolidation and distribution produces neutral price action and precedes a decline in the stock’s price.

Stage 4 – When the lows of Stage 3 are breached a stock enters a decline as sellers overwhelm buyers. A pattern of lower highs and lower lows emerges as a stock enters a bear market. A well-positioned trader would be aggressively trading the short side and taking advantage of the often quick declines in the stock’s price. More times than not all of stage 2 gains are given back in a short period of time. I do show some of my trade setups using these exact stages free here: https://stockcharts.com/public/1992897

Stages

Now that you know the stages and what it looks like its time to review the gold, silver and miners charts.


Gold Chart – Weekly

Gold has been in a bull market for several years but is starting to show its age in terms of the size of the price patterns, volume levels and extreme bullish sentiment. Back in 2011 a week before price topped we exited precious metals because the short term charts and volume levels were warning of a sharp drop. Since then I have not done many trades in either gold or silver because I do not like shorting in bull markets. Waiting for a bullish setup/price pattern before getting involved is my focus.

Gold has pulled back with a bullish 5 wave correction the last 5 months and at key support. While the long term charts are pointing to higher gold prices you must be aware that if gold and silver start to breakdown things will likely get ugly quickly. To be honest I do not care which way it goes, I just want it to either rally from support here and make new highs or breakdown and crash. Both will be very profitable if traded properly.

Gold


Silver Chart – Weekly

Silver has a very similar chart to that of its big sister (yellow gold).  This shiny metal has the energy of a 3 year old making it a very volatile investment. I have touched on the topic of gold and silver being so called safe havens and if you have been reading my work for a while you know that any investment that can move 18-45% in value within 1 month is NOT a safe haven.

While it has done well in the past decade and boosted a lot of retirement accounts the day will come with these things collapse and most people holding them will give back most if not all the gains they had simply because people get attached to large positions and most do not know when to just exit a position.

Silver


Gold Miners Chart – Monthly

This chart gives me cold sweats because I know how many people own gold mining stocks and I know how fast these things can move. If the price closed below the green support line the bottom could fall out and be very painful for those who get paralyzed by denial and do nothing but watch their accounts lose value week after week.

Miners


Precious Metals Investing Conclusion:

In short, this report is to show you the very basics of how investments move in stages. It is also to show a warning that precious metals are technically very close to a major breakdown which the big money players are watching closely. This thinly traded sector can move extremely fast when everyone rushes for the door.

Do not get me wrong, I am not saying a crash is about to happen, actually it’s the opposite. All I am doing is planning the idea in your subconscious so that if prices continue to move lower you will remember that these price levels and take action with your investments. Remember, you can always buy the investment back at any time again if the outlook changes in a week, month or year.

Get My FREE Weekly Gold, Silver and Mining Reports and Trade with the Stages: www.GoldAndOilGuy.com

Chris Vermeulen

Gold and silver along with their related miners have been under a lot of selling pressure the last few months. Prices have fallen far enough to make most traders and investors start to panic and close out their long term positions which is a bullish signal in my opinion.

My trading tactic for both swing trading and day trading thrive on entering and exiting positions when panic trading hits an investment. General rule of thumb is to buy when others are extremely fearful and cannot hold on to a losing position any longer. When they are selling I am usually slowly accumulating a long position.

Looking at the charts below of gold and silver you can see the strong selling over the past two weeks. When you get drops this sharp investors tend to focus on their account statements watching the value drop at an accelerated rate to the point where they ignore the charts and just liquidate everything they have to preserve their capital. A few weeks ago I posted my outlook on precious metals which seems to be unfolding as expected: http://www.thegoldandoilguy.com/precious-metals-miners-making-waves-and-new-trends/

Gold Bullion Weekly Chart:

The price and outlook of gold has not really changed much in the past year. It remains in a major bull market and has been taking a breather, nothing more. Stepping back and reviewing the weekly chart it’s clear that gold is nearing long term support. With panic selling hitting the gold market and long term support only $20 – $30 dollars away this investment starts to look really tasty.

But if price breaks below the $1540 level and closed down there on a weekly basis then all bets are off as this would trigger a wave of selling that would make the recent selling look insignificant. And the uptrend in gold would now be over.

Gold1


Silver Bullion Weekly Chart:

Silver price is in the same boat as its big sister (Yellow Gold). Only difference is that silver has larger price swings of 2-3x more than gold. This is what attracts more traders and investors but unfortunately the masses do not know how to manage leveraged investments like this and end up losing their shirts.

A breakdown below the $26.11 price would likely trigger a sharp drop back down to the $17.50 level so be careful…

Silver2


Gold Mining Stocks – Monthly Chart:

If you wanna see a scary chart then look at what could happen or is happening to gold miner stocks. This very could be happening as we speak and why I have been pounding the table for months no to get long gold, silver or miners until we see complete panic selling or a bullish basing pattern form on the charts. We have not seen either of these things take place although panic selling is slowly ramping up this week.

There will be some very frustrated gold bugs if they take another 33% hair cut in value… You can view some of my trading charts, setups and analysis free at my stockcharts.com list. Be sure to vote for me chartlist each day so I know its of value: https://stockcharts.com/public/1992897

GoldMiners3


Precious Metals Trend and Trading Conclusion:

In short, the precious metal sector remains in a cyclical bull market. That being said and looking at the daily charts the prices have been consolidating and are in a down trend currently. Until we see some type of bottoming pattern or price action form it is best to sit on the side lines and watch the emotional traders get caught up and do the wrong thing.

The next two weeks will be crucial for gold, silver and miner stocks. If metals cannot find support and close below the key support levels things could get really ugly fast. If you would like to receive my daily analysis and know what I am trading then check out my newsletter at: www.TheGoldAndOilGuy.com

Chris Vermeulen

The precious metals sector has been dormant since both gold and silver topped in 2011. But the long term bull market remains intact. As long as we do not have the price of gold close below the lower yellow box on the monthly chart then technical speaking precious metals should continue much higher.

Large consolidation periods (yellow boxes) provide investors with great insight for investments looking forward 6-18 months upon a breakout in either direction (up or down). The issue with investing during these times is the passage of time. One can hold a position for months and sometimes years having their investments fluctuate adding extra stress to their life when they really do not need to.

Once a breakout takes place a powerful rally or decline will start putting an investors’ money to work within days of committing to that particular investment compared to money invested waiting months for the breakout and new capital gains to occur.

Gold Price Chart – Monthly

Gold Monthly Price Chart


Gold Price Chart – Daily

The chart of gold continues to form a large bull flag pattern with a potential 3 or 5 wave correction. If price reverses this week and breaks above the upper resistance trend line then it will be a 3 (ABC) wave correction which is very bullish. But there is potential for a full 5 wave correction which is still bullish, but it just means we have another month or two before metals bottom.

Gold Futures Trading Daily Chart


Gold Miner Stocks – GDX ETF Chart – Daily

Gold miners do not have the sexiest looking chart. It was formed a strong looking bull flag but has continues to correct and is not nearing a key support level. This level could act as a triple bottom (bullish) or if price breaks below then it would be breaking then neckline of a massive head and shoulders pattern which points to 50% decline. I remain bullish with the longer term gold trend until proven wrong.

GDX - Gold Miner ETF Trading


Silver Price Chart – Daily

Silver remains in a long term bull market much like the monthly chart of gold shown earlier in this report. Silver continues to work its way through a large bull flag pattern with a positive outlook at this time.

Silver Price Chart Daily


Silver Miner Stocks – SIL ETF – Daily Chart

Reviewing the precious metals sector it seems that silver miners have the sexiest looking chart. All price patterns are showing strength and are in proportion to one other. If this chart plays out to what technical analysis is pointing to then we could see the precious metals sector put in a bottom and rally within the next week or two. And if this is the case then silver miner stocks should provide the most opportunity going forward. Keep in mind you can view my actual watchlist of stock and ETFs I trade in real-time with my analysis free: https://stockcharts.com/public/1992897

SIL - Silver Miner ETF Trading


Precious Metals Trading Conclusion:

In short, what you need to focus on is the yellow consolidation box on the monthly gold chart. A breaking in either direction will trigger a massive move that should last 6-18 months. Until then long term investors can simply sit back and watch the sector while they put their money to work in other active sectors.

From a short term traders point of view, that f mine. I am looking for a signs of a bottom on the daily chart to get my money working earlier to play the bounce/rally that takes place and actively managing the position until a breakout occurs. The charts overall are not that clear as to when a breakout will take place. Metals could start to rally next week or in a few months and all we can do is wait for a reversal to the upside before we get active.

Knowing the big picture trends and patterns at play along with major support and resistance levels (breakout levels) is crucial for success and piece of mind.

Get my analysis, daily updates and trade alerts each day at www.TheGoldAndOilGuy.com

Chris Vermeulen

Yesterday’s price action was very bearish yet again and we are patiently waiting for a counter trend pullback to happen. While three are some good looking plays out there I really do not want to get long until the market clears the air with a bout or three of strong selling. Remember 3:4 stocks follow the market and the odds of picking a commodity or ETF that bucks the trend is unlikely. If you are interested in powerful stocks & ETFs the buck the trend check out my FREE Trading Ideas live Go Here: https://stockcharts.com/public/1992897

SP500 / Broad Stock Market:

We have seen a bug run up in stocks this month and things are looking a little long in the teeth. A large number of stocks are trading above their upper Bollinger band and the broad market is testing that key resistance level also. Typically when a Bollinger band is reached we see price reverse for a couple days at minimum.

While the equities market is in a new uptrend as seen by the moving averages I pullback seems imminient. The last two days has formed reversal candles and are pointing to lower prices.

Dec12SPY


Dollar Index Hourly Chart:

This chart shows a possible bottom forming in the dollar pointing to a 3-8 day pullback in stocks.

Dec13DXBottom


Gold Futures Hourly Chart:

Dec13Metals


Natural Gas Hourly Chart:

Dec13NatGas


Morning Trading Conclusion:

Looking at the charts on several different time frames, not all shown here, technical analysis shows a pullback in stocks is highly likely. This is what we are currently positioned for.

The US dollars downward momentum is slowing and if it can find a bid today it should trigger strong selling in both stocks and commodities. Gold and silver are down sharply along with miners.

We have been watching natural gas for a few months and know that it has been trading inverse to what stocks do. This bodes well for a bounce in natural gas if stocks start a sell off. That being said, natural gas is trading at a key tipping point that could spark a very fast and hard drop. This knife can fall at a speed that will take a slice out of your trading account if not traded and managed properly (tiny position and use of a stop). I actually like natural gas the more it moves down and could issue a buy alert on it today or this week. I would like to see volume decline at this level showing the momentum is slowing…

Get My ETF Trade Alerts Now: www.TheGoldAndOilGuy.com

Chris Vermeulen

We don’t hear much about gold and silver anymore on the news. This time last year you could not go 5 minutes without a TV or radio station talking about them. Why is this? Simple really, precious metals have been building a Stage 1 Basing Pattern for the last 12 months. This boring sideways trading range is how the market gets most of those long holders out of an investment before it starts another move up. The saying is “If the market doesn’t shake you out, it will wait you out”.

We all know time is money so the above statement makes a lot of sense doesn’t it? Instead of having your money sitting in an investment that has clearly displayed a large sideways range with month and possibly years before any significant breakout will occur, why would you want their money in it doing nothing? There are other opportunities which you could be putting your money into that could generate more gains until the precious metals sector sets up with a high probability trading pattern.

The good news is that gold, silver and precious metal miner stocks are forming a very large Stage 1 Accumulation pattern on the weekly chart. This points to a multi month rally in prices if they breakout above our resistance levels.


Gold & Gold Miner Stocks Weekly Analysis:

The chart below shows a lot of analysis and to the untrained eye this may look messy and confusing, so take your time to review it. In short, what I am showing are sideways price patterns using the previous highs and lows for support and resistance levels. The analysis shows the shift in prices from bearish (down), to Neutral (sideways). The exciting part about this pattern is that a new bull market should emerge if my analysis is correct. Now, I’m not talking about 5 -10% move here, I’m talking about a multi month and possibly a yearlong rally in precious metals that could allow some individuals to retire early if played properly…

A break above our red dotted resistance lines should trigger aggressive buying in gold miners along with physical gold bullion.

Gold Miners ETFs

In the past month I have been giving out some of my Stage 1 trading ideas which have generated some decent gains for those who follow along. All but one have generated gains with FSLR 12.5%, FB 12%, RIMM 54%, AAPL 5%, TLT 2.5%, XLU 1.5%, and KOL down -5.2%. Keep in mind that you can follow my trading charts live for free and get some of my stock and ETF trading ideas here: https://stockcharts.com/public/1992897


Silver & Silver Miner Stocks Weekly Analysis:

This chart of silver and silver miner stocks (SIL), shows a very similar pattern to that of its big shiny sister (Yellow Gold). Silver carries a lot more risk because of its industrial usage. Also this commodity is thinly traded and can move very quickly on a daily basis compared to gold. Because of these quick price movements it has attracted a lot of speculative money which also has increased the volatility. More often than not silver will move 2-3 times more on a percentage bases than that of yellow gold.

Silver Miners ETFs


Battle of the Miner ETFs Weekly Performance:

This chart compares three precious metals miner ETFS (GDX – Gold Miners, SIL – Silver Miners, NUGT 3x Leveraged Gold Miners).

Silver miners have held up the best because the herd saw how big the move was a year ago and are front running the next potential rally. But, depending on how you read the charts and sentiment it may be pointing to the dormant gold miners for a bigger than expected rally. But debating which one will breakout and run the most is a conversation/debate of its own and even I can argue both sides. The safe play is that even if gold miners (GDX & GDXJ) underperform the silver miners (SIL), the NUGT which is 3x leveraged gold miners should be the same if not outperform silver miners.

Precious Metals Mining Stocks


Precious Metals & Miners Trading Conclusion:

In short, I favor trading the miners over physical bullion simply because the charts show much more profit potential than if one was to buy the bullion exchange traded funds GLD and SLV.

The market seems to be setting up for some very large moves in 2013 and members of my trading newsletter should do very well. Be sure to join and follow along at www.GoldAndOilGuy.com

Chris Vermeulen