Over the past year we have had some really interesting things unfold in the market. Investing or even swing trading has been much more difficult because of all the wild economic data and daily headline news from all over the globe causing strong surges or sell offs almost every week.

For a while there you could not hold a position for more than a week without some type of news event moving the market enough to either push you deep in the money or get stopped out for a loss. This has unfortunately caused a lot of individuals to give up on trading which is not a good sign for the financial market as a whole.

The key to navigating stocks which everyone thinks are overbought is to trade small position sizes and focus on the shorter time frames like the 4 hour charts. This chart is my secret weapon and giving you both large price swings which daily chart traders focus on while also showing clear intraday patterns to spot reversals or continuation patterns with precise entry/exit points.

While I could ramble on about why the stock market is primed for major long term growth from this point forward I will keep things short and simple with some 4 hour and daily charts for you to see what I see and what I am thinking should unfold moving forward.

Keep in mind, the most accurate trading opportunities that happen week after week are the quick shifts in sentiment which only last 2-5 days at most which is what most of my charts below are focusing on…

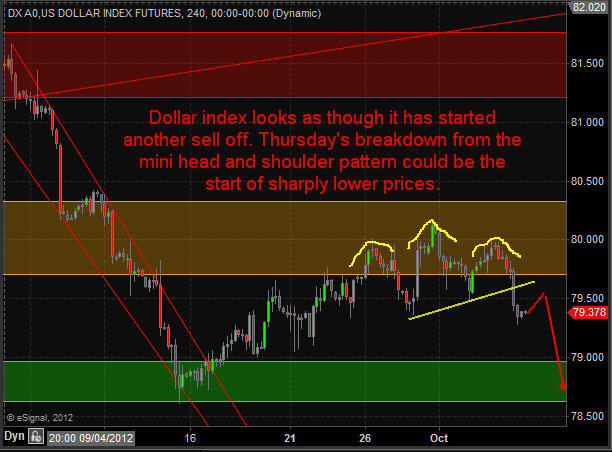
Dollar Index – 4 Hour Chart

This chart shows a mini Head & Shoulders reversal pattern and likely target over the next five sessions. The dollar index has been driving the market for the past couple years so a lower dollar means higher stock and commodity prices.

Dollar Index Trading

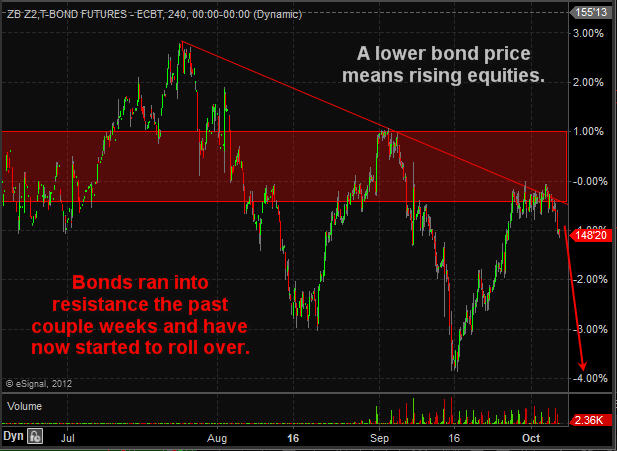
Bond Futures – 4 Hour Chart

Money has been flowing into bonds for the past couple weeks with most traders and investors expecting a strong correction in stocks. As you can see the price of bonds hit resistance this week and as of Thursday has now started selling off. Money flowing out of this “Risk Off” asset means money will move to the “Risk On” investments like stocks and commodities.

Bond Futures Trading

Gold Futures – Daily Chart

Gold is stuck in both categories in my opinion. It is a “Risk Off” safe haven when people are scared of falling stock prices, and it is also a “Risk On” speculative investment when people are feeling good about the market. Gold has been trading at key resistance for a couple weeks and looks as though it’s starting its next rally.

Gold Futures Trading

Silver Futures – Daily Chart

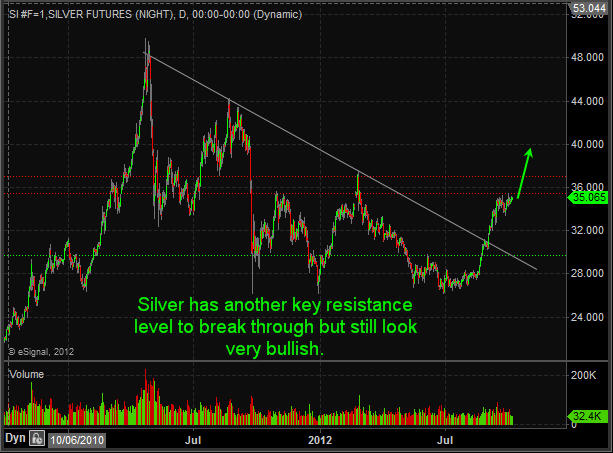
Silver is in the same boat as gold though it carries much more volatility than gold. Expect 2-4% swings regularly and sloppy chart patterns in this metal.

Silver Futures Trading

SP500 Futures – Daily Chart

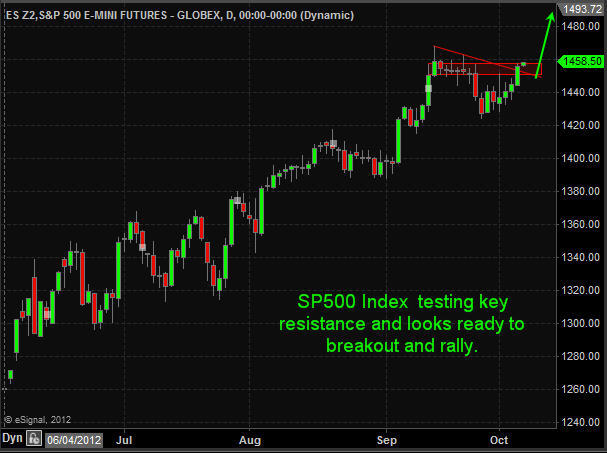
As much as everyone hates to buy stocks up at these lofty prices I hate to say it but I think they are going to keep going up and they could do this for a long time yet. If the dollar index continues to break down then I expect the SP500 to rally another 3% from here (1500) in the next 1-2 weeks.

SP500 Futures Trading

Crude Oil Futures – 4 Hour Chart

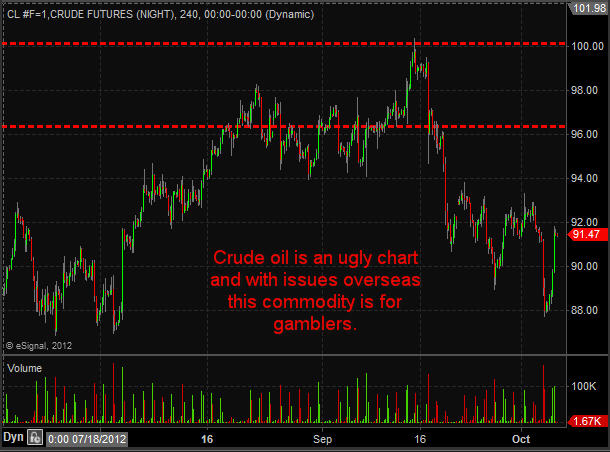
Crude oil has not had much attention from me in the past few months. While it has had big price action many of those big days took place on news causing an instant price movement making this extra dangerous to trade. I continue to watch rather than get attached to it.

Crude Oil Futures Trading

Natural Gas Futures – Daily Chart

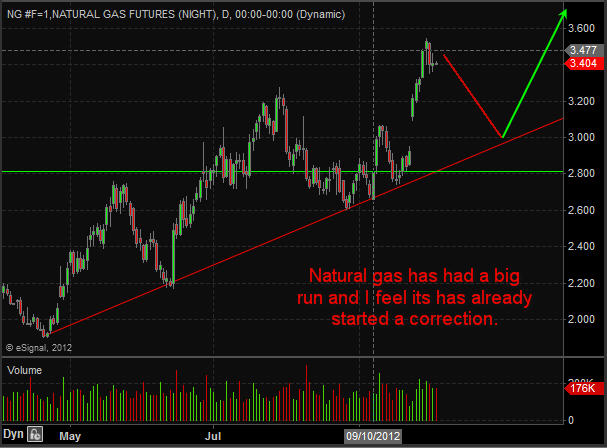
Natural gas has been a great performer for us in the past 6 months as all the short positions slowly get covered. I just closed out my natural gas ETF trade this week with a 31.9% gain and plan on getting back in once the chart provides another low risk setup.

Natural Gas Futures Trading

Trading Conclusion:

In short, I feel the dollar index along with bonds will correct over the next few weeks. That will trigger buying in stocks and commodities. Keep in mind natural gas dances to its own drum beat. The dollar does not have much affect on its price and most times natural gas is doing the opposite of the broad market. Get My Pre-Market Trading Analysis Video and Intraday Chart Analysis EVERY DAY – www.TheGoldAndOilGuy.com

Chris Vermeulen

The price of gold hit a record high this past week . . . in euro terms (at about 1380 euros). The record came after a number of actions by central banks around the world, trying to stimulate their respective economies. The actions, usually centered around money printing, once again had investors looking for refuge in gold.

Since the beginning of September, investors have bought about 75 tons of gold through exchange traded funds. Reuters says that gold ETFs, such as the largest gold ETF – the SPDR Gold Shares (NYSE: GLD), are on track for their biggest quarterly inflows in over a year, of 3.285 million ounces. Finally, according to UBS, investors have also raised their bullish bets on gold futures to the highest level in more than a year.

All the world’s major central banks took action recently including the Bank of Japan which launched a fresh round of monetary stimulus. The main action though was centered in Europe and the United States. The European Central Bank has promised to buy an unlimited quantity of eurobonds going forward. And the Federal Reserve announced its third round of monetary stimulus, QE3, that promises to buy $40 billion of mortgage-backed securities monthly on top of its ongoing Operation Twist program of buying long-dated Treasuries.

Speaking about the monetary easing, Barclays precious metals analyst Suki Cooper put it this way to the Financial Times, “Gold finally found the catalyst it had been waiting for all year after the Fed announced open-ended quantitative easing.”

Another reason for gold’s rise in euro terms, it must be noted, is the continuing fiscal turmoil in Europe itself, particularly in Spain. Spain’s largest autonomous region, Catalonia, manages an economy as big as Portugal’s. The problem is that it has debts of 42 billion euros which it is struggling to service. Catalonia has requested a 5 billion euro temporary bailout from Spain’s central government, adding to its debt burden. In a real show of defiance, Catalonia is also refusing to implement austerity measures. Add to that, bank stress tests in Spain showed that the country’s 14 largest lenders will need 60 billion euros in new capital.

No surprise then that physical demand for gold bars and coins in Europe rose 15 percent in the second quarter, according to the World Gold Council!

Another positive fundamental reason in the corner of gold bulls is the recent currency appreciation in the Indian rupee. India is traditionally the world’s largest consumer of gold. Sales have been slow there this year due to the government trying to slow down gold sales there through rises in a gold import tax. However, the recent rise in the rupee has made gold purchases more palatable and gold sales to India have hit their highest level in two months.

So for now, many of the fundamentals look to favor a move higher for gold, although there is technical resistance at its 2012 high of $1791.

Know when to buy gold, silver, oil and stocks – www.TheGoldAndOilGuy.com

Chris Verneulen

For the first time in over 30 years, talk of a return to the gold standard has become part of mainstream politics in the United States. Part of the official Republican policy adopted it at the recent Republican Convention and called for the commission to look at reestablishing the link between gold and the U.S. dollar. No doubt that plank was added to soothe supporters of Texas Congressman Ron Paul.

However, gold bugs holding gold bullion or even those holding gold ETFs such as the SPDR Gold Shares (NYSE: GLD) shouldn’t hold their breath in anticipation of the gold standard returning. There was a similar commission – the Gold Commission – set up in 1981 by President Ronald Reagan. After a lot of ‘commissioning’, the decision was made to go with the status quo of using fiat Federal Reserve dollars.

Any commission set up under the current president would likely come to the same conclusion. There are simply too many practical obstacles to return to a full-fledged gold standard. Even pro-gold advocates including the World Gold Council and the Gold Anti-Trust Action Committee (GATA) don’t see a gold standard returning.

The key problem would be at what price of gold would the United States peg its currency. Great Britain returned to the gold standard in 1925, after going off it in 1914, at the 1914 peg price. This was a mistake made by Winston Churchill (he called it the biggest he ever made) since it basically ignored the vast inflation in the British pound in those intervening years. The result was a vast overvaluation of the pound and deflation and high unemployment soon followed.

What price would a new Gold Commission set as the “correct” price of the U.S. dollar versus gold? $1,000? $2,000? $5,000? The answer is that there is no “correct” price. Whatever price is set will eventually be tested by the financial markets and fail much as the pegged currencies system failed. So there will be no return to the gold standard.

But that does not mean there will not be a ‘back-door’ gold standard. The move to such as a system is already underway as central banks all over the world are rebuilding their stockpiles of gold. After two decades of heavy selling, central banks became net buyers of gold in 2010 and the momentum has built since. Gold will likely end up being used as ‘good’ collateral by global central banks, as opposed to the shaky collateral sovereign bonds are turning into.

Central bank purchases, led by the emerging markets, are on track this year to hit a record high according to the World Gold Council. China alone in 2011 bought around 490 tons of gold. Other countries including Russia, Turkey and South Korea have added gold to their official holdings in recent months. This buying showed up as central bank purchases in the second quarter of 2012 were more than double the level reported a year earlier at 157.5 metric tons. If the buying continues at current levels, central banks gold purchases would total around 500 tons this year, easily surpassing last year’s 458 tons.

The bottom line for investors from the global central banks’ buying of gold? The gold standard is working its way back into the international monetary system through the back door. This should, in the long-term, put a floor under gold and help maintain it on its steady upward path.

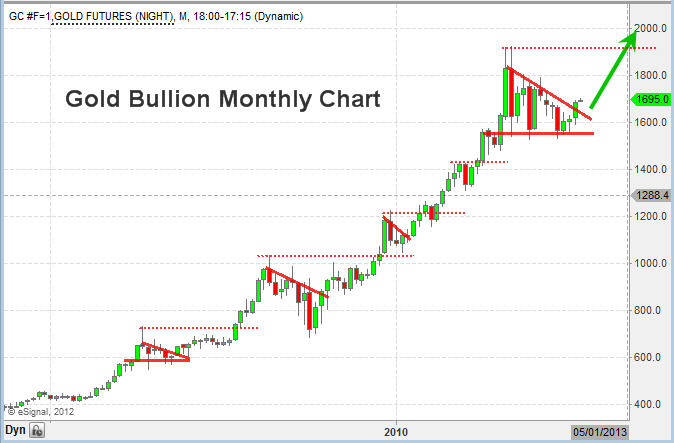
Just last week we started to see gold bullion, silver bullion and gold miner share prices start to breakout to the upside of a 12 month consolidation pattern. This could be the start of the next major rally in precious metals as future uncertainty fears continue to rise. The large bullish technical pattern we see on the gold chart points to much higher prices over the coming 24 months. But keep in mind this is a monthly chart and it could still take months to truly breakout to new highs and start another rally.

Gold Bullion Trading

If you would like to get my weekly analysis on precious metals
and the board market join my free newsletter at www.TheGoldAndOilGuy.com

Chris Vermeulen
 

It has been a year since the price of gold bullion topped out and even longer for silver. Many traders and investors have been patiently waiting for this long term consolidation pattern to breakout and trigger the rally for precious metals and miner stocks. Most of gold bullion is used for investment purposes.  As a result, it rises when there is economic weakness and investors lose confidence in the fiat currency of a country.

With continuing economic weakness in the United States it will almost certainly lead the Federal Reserve to act in way that is more powerful than Operation Twist which is the selling of short term securities to buy those with a longer term.   Based on the most recent data, economic growth in the United States is falling as the unemployment rate rises.  A recent statement by the Federal Reserve was unusually clear in calling for greater action in the future.


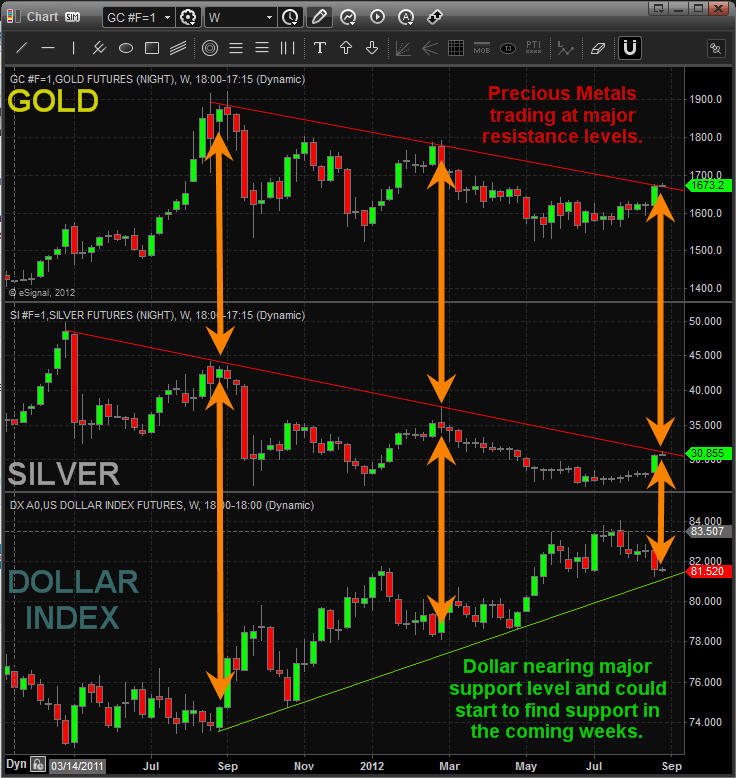
Gold, Silver and Dollar Weekly Price Chart:

Take a look at the weekly charts below which compare gold and silver to the US Dollar index. You will notice how major resistance for metals lines up with major support for the dollar. As this time metals are still in consolidation mode (down trend) and the dollar is in an uptrend.

Weekly Metals Outlook


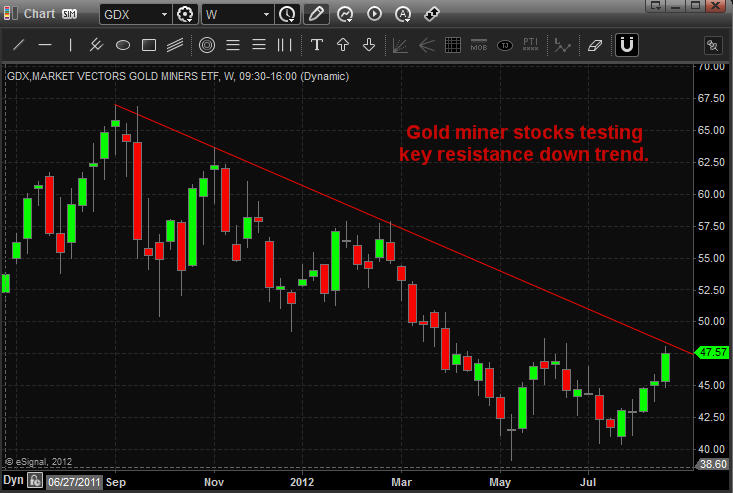
Gold Miners ETF Weekly Chart:

Gold miners have been under pressure for a long time and while they make money they have refused to boost dividends. That being said I feel the time is coming where gold miner companies breakout and rally then start to raise dividends in shortly after to really get share prices higher.

GDX - Gold Miner Stock ETF

On August 13th I talked about the characteristic’s and how to trade the next precious metals breakout and where your money should be for the first half of the rally and where it should rotate into for the second half. Doing this could double you’re returns. Read Part I: http://www.thegoldandoilguy.com/gold-mining-stocks-continue-to-disappoint-but-not-for-long/

Overall I feel a rally is nearing in metals that will lead to major gains. It may start this week or it still could be a couple months down the road. But when it happens there should be some solid profits to be had. I continue to keep my eye on this sector for when they technically breakout and start an uptrend.

If you would like to get my weekly analysis on precious metals and the board market be sure to join my free newsletter at www.TheGoldAndOilGuy.com

Chris Vermeulen
Chris Vermeulen – www.TheGoldAndOilGuy.com

One of the top stories in the financial markets in 2012 has to be the stagnation in the price of gold at around $1600 an ounce, which is down approximately 17% from its peak at $1920.30. Those bullish on the yellow metal have been disappointed in gold’s performance while those bearish on the shiny metal have reveled in its stagnation, saying that gold’s status as a safe haven is over.

What is behind gold’s sluggish performance in 2012? There are several reasons, but one of the key fundamental reasons has been the lack of demand from traditionally the largest buyer of gold on the planet – India (although China will surpass it this year). India bought only 181.3 tons in the second quarter of 2012, a 2-year low, according to the London-based World Gold Council.

There are several factors at play as to why Indian demand for gold has fallen. One reason is the sharp drop in the value of its currency, the rupee, which is down by 25% versus the U.S. dollar this year. This decline has kept gold prices high in relative terms while the actual dollar value of gold was falling. Perhaps even more important has been the ‘war’ declared on gold by its central bank which has blamed all of the country’s economic ills on Indian citizens’ traditional buying of gold. In an attempt to slow down gold and silver imports, the Indian government has imposed new taxes on the purchase of these precious metals.

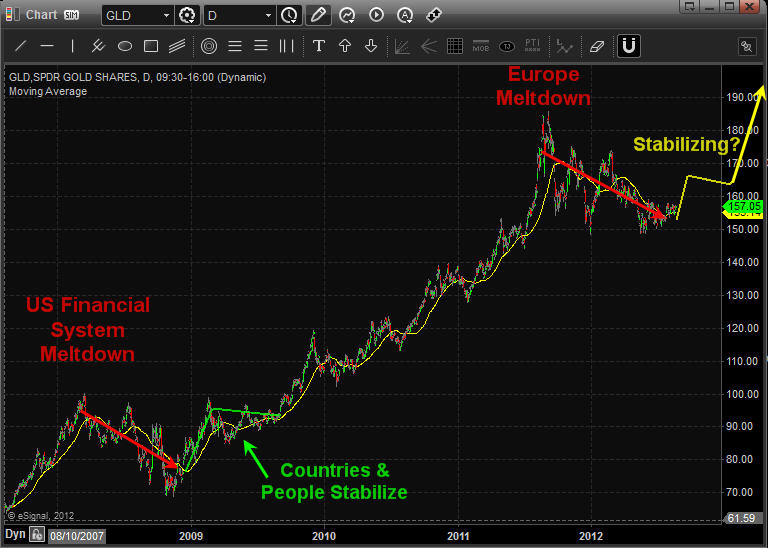
But even though demand for the precious metal is way down in India, the situation still offers hope for gold bulls. Why? Because we’ve been here before – in 2009 to be exact. In early 2009, the Indian economy and rupee tanked. Gold demand almost completely dried up. According to precious metals consultancy GFMS, Indian demand for gold in the first quarter of 2009 collapsed by 77%. For the full year GFMS said Indian consumption dropped by 19%.

Now with the Indian economy slowing to its weakest growth rate in nearly a decade and the rupee falling, we are seeing a replay of 2009. The monsoon season has been poor, hitting farmers – among the biggest buyers of gold – hard. Gold prices have hit a record high in rupee terms, and India is expected to purchase, as forecast by the World Gold Council, only 750 tons of gold, down 25% from 2011 levels. Meanwhile, the WGC forecasts that China will buy 850 tons of gold this year.

Investors should pay heed to the clues that recent history is giving us. The drop in Indian demand is simply a cyclical phenomenon due to the lousy state of the Indian economy. It will recover eventually. And when it does, look out for the fireworks from renewed Indian demand for gold added to the Chinese demand. In 2010, as pent-up demand for gold was unleashed, Indian gold consumption soared 74% to a record high of 1,006 tons according to GFMS.

Gold bulls surely hope we see something similar in 2013 and that is exactly what I talked about last week based around gold miner stocks and also what Dave Banister’s recent gold forecast was about at TheMarketTrendForecast.com sees in 2013.

Gold Chart Showing 2009 Collapse and Outcome and Current Gold Price Analysis:

Gold Forecast - India Gold demand

Gold Forecast - India Gold demand

Gold Trading & Investing Conclusion:

In short, gold and gold stocks have a lot of work to do before they truly breakout into the next major leg higher. I feel we are nearing that point and they may have bottomed already. Starting a small long position to scale in I think is a safe play. But I would only add more once the trend actually turns up and shows strength in terms of price and volume action.

If you would like to get my weekly analysis on precious metals and the board market be sure to join my free newsletter at www.TheGoldAndOilGuy.com

Chris Vermeulen

Chris Vermeulen – www.TheGoldAndOilGuy.com

It is an endless debate for investors interested in gold. Should they buy a direct play on the gold price, either gold bullion itself or even so-called paper gold with an ETF such as the SPDR Gold Shares (NYSEArca: GLD)? Or should they invest into gold equities, particularly the larger, higher quality gold mining companies?

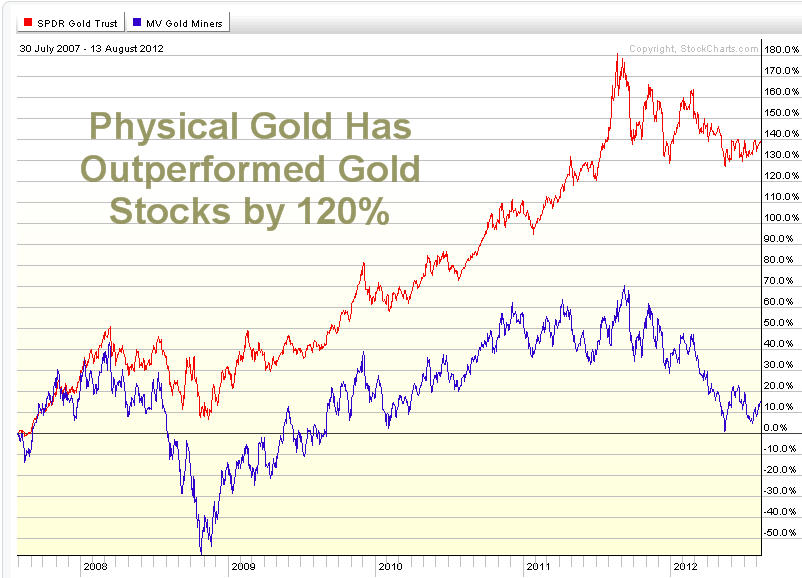
Recent history suggests the answer is gold itself. According to Citigroup, physical gold has outperformed global gold equities 120% percent of the time over the past 5 years. Stocks of the bigger gold mining firms seem to react adversely to bad news (which is normal), but the problem is they react with no more than a yawn to good news. These type of stocks are contained in the Market Vectors Gold Miners ETF (NYSEArca: GDX).

Gold Mining Stocks ETF - GDX

Gold Mining Stocks ETF - GDX

Evidence of this trend can been see in the latest news to hit the industry…the slowdown in expansion as recently signaled by the world’s largest gold producer, Barrick Gold (NYSE: ABX). The company’s stock has fallen by more than 30 percent over the last year due to cost overruns at major projects. The latest blowup in costs of up to $3 billion occurred in its estimate for development of its flagship Pascua-Lama project on the border of Chile and Argentina. The project may now cost up to $8 billion.

In addition, Barrick decided to shelve the $6 billion Cerro Casale in Chile and the $6.7 billion Donlin Gold project in Alaska. Barrick is not alone in its thinking among the major gold producers. The CEO of Agnico-Eagle Mines (NYSE: AEM), Sean Boyd, recently said “The era of gold mega-projects may be fading. The industry is moving into an era of cash flow generation, yields and capital discipline.”

Fair enough. But are gold mining companies’ management walking the walk about yields or just talking the talk? Last year, many of the larger miners made major announcements that they would be focusing on boosting their dividends to shareholders in attempt to attract new stockholders away from exchange traded vehicles such as GLD, which have siphoned demand away from gold equities. Barrick, for example, did boost its dividend payout by a quarter from the previous level. Newmont Mining (NYSE: NEM), which has also cut back on expansion plans, has pledged to link its dividend payout to the price of gold bullion.

So in effect, the managements at the bigger gold mining companies (which are having difficulties growing) are trying to move away from attracting growth-only investors to enticing investors that may be interested in high dividend yields. This is a logical move.

But rising costs at mining projects may put a crimp into the plans of gold mining companies’ as they may not have the cash to raise dividends much. And they have done a poor job of raising dividends for their shareholders to date. In 2011 the dividend yields for gold producers globally was less than half the average for the mining sector as a whole at a mere 1.3 percent. Their yields are below that of the base metal mining sector and the energy sector.

It seems like management for these precious metal companies have the similar emotional response shareholders have when they are in a winning position. When the investor’s brain has experienced a winning streak and is happy it automatically goes into preservation/protection mode. What does this mean? It means management is going to tight up their spending to stay cash rich as they do not want to give back the gains during a time of increased uncertainty. Smaller bets/investments are what the investor’s brain is hard wired to do which is not always the right thing to do…

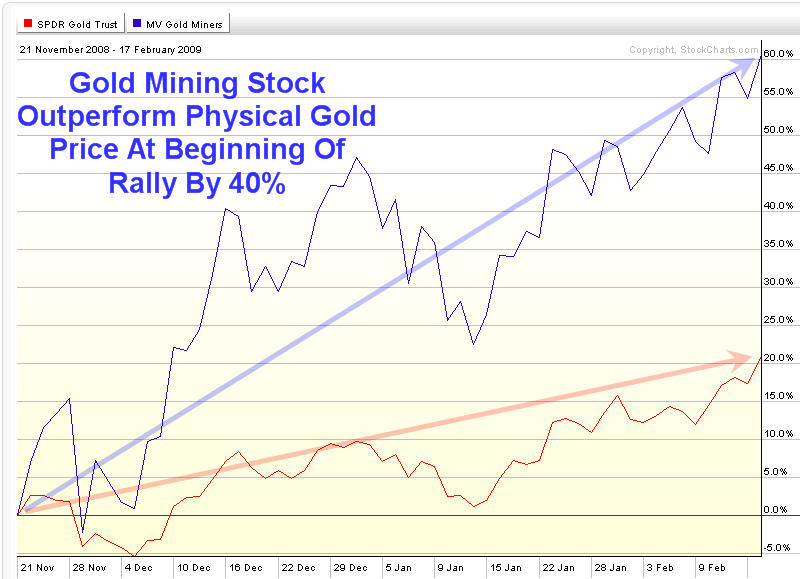
Looks like there is still a lot work to be done by gold mining companies’ to improve returns to their shareholders. But with all that set aside it is important to realize that when physical gold truly starts another major rally. These gold stocks will outperform the price of gold bullion drastically for first few months.

Gold Stock Rally

Gold Stock Rally


Gold Miner Trading Conclusion:

In short, last weeks special report on gold about how gold has been forming a major launch pad for higher prices over the past year. Gold bullion has held up well while gold miner stocks have given up over 30% of their gains. If/when gold starts another rally I do feel gold miner stocks will be the main play for quick big gains during the first month or two of a breakout. The increased price in gold could and value of the mining companies reserves could be enough to get management to start paying their investors a decent dividend which in turn would fuel gold miner shares higher.

Both gold and silver bullion prices remain in a down trend on the daily chart but are trying to form a base to rally from which may start any day now. Keep your eye on precious metals going into year end.

If you would like to get my weekly analysis on precious metals and the board market be sure to join my free newsletter at www.TheGoldAndOilGuy.com

Chris Vermeulen