Chris Vermeulen – www.TheGoldAndOilGuy.com

We all want new and exciting electronic gizmos and gadgets for the holiday season. Unfortunately they have the tendency to lose almost all their value within weeks because of newer versions etc… but what if you just got a lump of dirty old coal in your stocking, how would you feel?

The only individuals who would appreciate a dirty gift like that would be those forward looking investors who see major opportunities before they become the next big movers and headline news.

Knowing how to spot Stage 1 patterns is one of the most important bits of information you need to know as an investor. This one pattern is how I found RIMM which now up 100% in the past 30 days, ANR up 30% in two weeks, FSLR up 20% in 20 days and the list goes one. My main focus is on ETFs because of lower risk they provide but very powerful when applied to individual stocks.

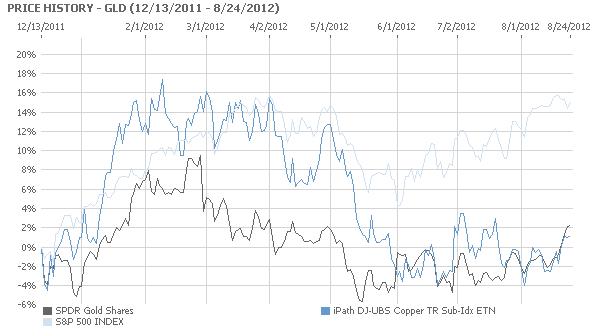
Coal and coal stocks have been out of favor for almost two years now. But these unwanted and hated shares may soon be owned by the masses, or at least by traders and investors. A few weeks ago to I talked about the four stages all investments go through and which patters you must be able to spot in order to make huge money investing while having very limited downside risk.

You can read about them here where I used Apple and Research In Motion shares as my example: http://www.thegoldandoilguy.com/collapse-of-apple-rise-of-the-blackberries-stock-market-cycle/

In summary, Trade with the BIG BOARD and only focusing on buying stocks, ETFs etc… as they are coming out of a Stage 1 Accumulation Basing Pattern. This puts the odds greatly in your favor for not only winning the majority of your trades but to generate above average returns.

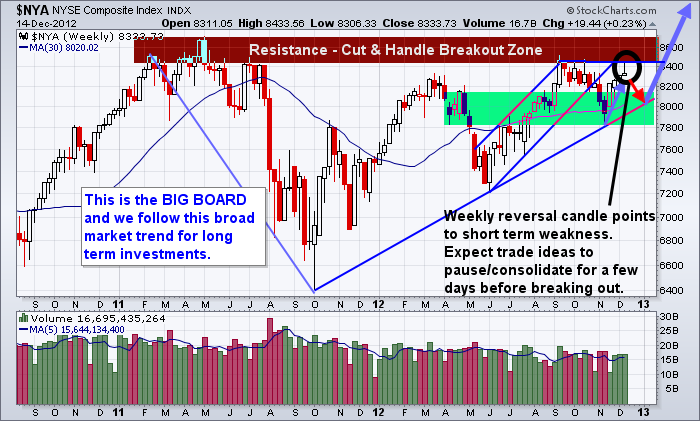
The BIG BOARD – NYSE – Weekly Major Stock Market Trend

The New York Stock Exchange is the big board. This chart formed a reversal candle last week which points to lower prices. Its likely we see a 1-2 week dip before buyers step back in. Until then individual stocks should pause or form mini bull flags until the sellers are finished and buyers step back into risk on assets (equities).

NYSEWeekly

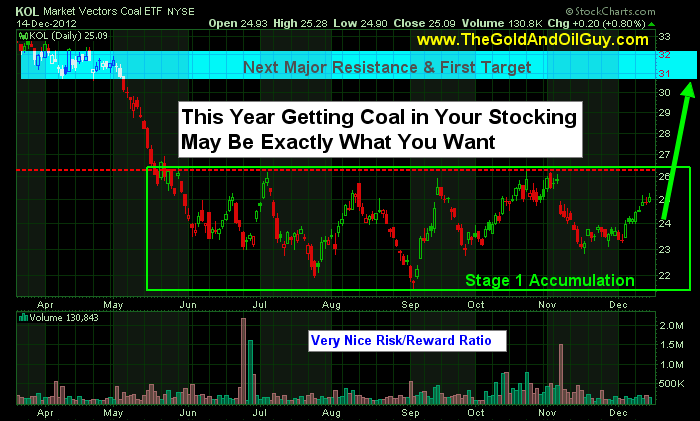
Coal Sector ETF Showing Stage 1 Basing Pattern

Coal stocks have been bouncing bottom for some time and if you did not review the Stages Report using the link above then do so now so you know what to expect in detail.

KOL coal exchange traded fund is a basket of coal companies and is starting to show signs of a new bull market. A breakout and close above $26.00 should trigger strong buying with the potential of a 21% gain before it hits my first price target. This could go way past that but one target at a time folks.

Naturally I would like to see a bull flag or pause in KOL over the next couple weeks, then look to get long using the pivot low of that pause/bull flag as my protective stop. I’m not jumping in here as the broad market looks ready to correct and ¾ stocks follow the big board which will pull KOL down.

KOLBase


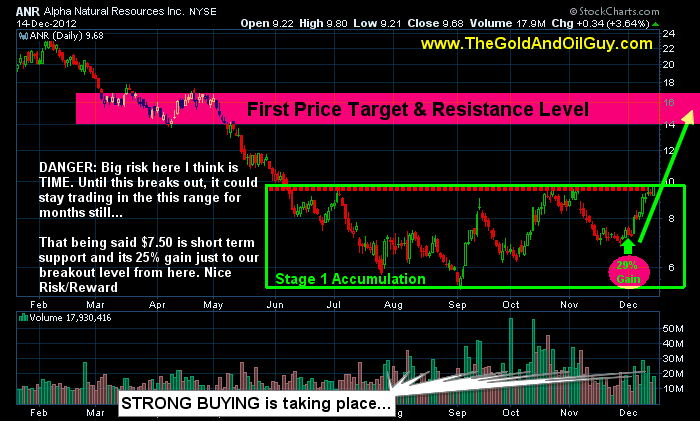
ANR – My Top Coal Stock Pick

I pointed out ANR at $7.50 at the beginning of December to followers as it was the best looking coal stock I could find. The two key indicators “Price” and “Volume” were clearly pointing to higher prices and the potential gain even if it was just played up to the Stage 1 Resistance Level still netted a 30% move. Crazy part is that there is the potential for a 100% rally to my first price target. Follow my free ideas here live: https://stockcharts.com/public/1992897

ANRCoal


You want Gizmos or Coal in You’re Stocking???

In short, I really like the coal sector for the first quarter of 2013. I’m not too worried about the fiscal cliff as it’s not the end of the world and the US along with most other countries are all bankrupt together in my opinion. New rules and ideas will be implemented and life and business will continue… I am not to worried.

I am expecting stocks to continue sideways or higher into May at which time a serious correction could take place. But not to worry as we take things one week at time and will be adjusting my outlook accordingly.

Get My Trade Ideas & Alerts Delivered To Your Inbox: www.TheGoldAndOilGuy.com

Chris Vermeulen

Crude oil prices hit a four-month high this week on the back of rising tensions in the Middle East and North Africa and the unfortunate murder of the U.S. ambassador to Libya. Added impetus on the upside was given to oil by the announcement of more money printing (QE3) by the Federal Reserve which said it would launch an open-ended  commitment to purchase $40 billion of mortgage-backed securities monthly.

The global benchmark for oil, Brent crude oil, jumped to about $117 a barrel. It maintained its roughly $18 premium to U.S.-based WTI crude oil which was trading at $100 a barrel on a couple days ago. Non-futures investors can easily participate in the oil market through the use of exchange traded funds. The ETF which tracks Brent crude oil futures is the United States Brent Oil Fund (NYSE: BNO) and the ETF which tracks WTI crude oil futures is the United States Oil Fund (NYSE: USO).

The real story behind the story in the oil market, however, is the ongoing Arab Spring which is sweeping throughout the Middle East and North Africa, pushing aside some regimes and threatening others. The countries whose governments, such as Saudi Arabia and the other Gulf states, feel threatened by popular uprisings are where investors should put their focus.

Saudi Arabia in particular is key because it accounts for more three-quarters of the world’s spare oil production capacity. So it is very important to note that the kingdom is no longer a price ‘dove’ in OPEC as it has been for decades. It has joined Iran, Venezuela and others in being a price ‘hawk’.

The reason behind the change in attitude is simple…Arab Spring.

Like its neighbors in the Gulf region, Saudi Arabia has gone on a public spending spree to appease its restless citizens. It has sharply increased outlays on subsidies for items like food, fuel and housing in an attempt to appease its citizens. In 2011, the kingdom raised its domestic spending by $129 billion – the equivalent of more than half its oil revenues.

Much of this increased spending will go toward upgrading the country’s infrastructure. Take electricity, for example. Saudi Arabia has revealed plans to spend more than $100 billion dollars on power plants and distribution networks by 2020. The kingdom has also set a goal to electrify 500,000 new homes that are being built in an attempt to mollify political unrest among its population of 27 million people.

This spending spree led the International Monetary Fund and other analysts to estimate that the kingdom and other Gulf countries need oil to be selling between $80 and $85 a barrel in order for the governments to balance their budgets. This is up, in Saudi Arabia’s case, from a mere $25 a barrel a few short years ago!

Unfortunately for oil consumers, this trend looks set to continue in years ahead. According to the Institute of International Finance, by 2015 the Saudi government will only be able to balance its budget if oil prices are at $115 a barrel if current spending trends remain in place.

So in effect, with the Arab Spring forcing governments to spend more on their citizens, it has put a floor under the price of oil. OPEC will do everything in its power to keep the price above the budget breakeven points for governments in the Gulf region.

Keep up to speed on the oil and precious metals markets with my free newsletter: www.GoldAndOilGuy.com

Chris Vermeulen

The price of silver reached a 5-month high this past week as investor interest seems to have been rekindled in both gold and silver as belief in financial markets increases that the latest round of monetary easing from the Federal Reserve – QE3 – will soon be on its way. Many investors had largely stayed away from silver in recent months after some had got caught up in its volatility. Silver had touched a 30-year high in April 2011 before plunging 35 percent in a few short weeks.

Now the volatility is back – but on the upside – as prices have climbed more than 20 percent in less than a month. The gains have outpaced that of gold which rose roughly 10 percent during the same time frame. Importantly for investors, the ratio between the two precious metals has moved about 10 percent in silver’s favor since mid-August. This is the first time silver has outperformed gold since the start of 2012.

For non-futures investors, the two precious metals can easily be tracked through the use of exchange traded funds (ETFs). The most liquid ETFs for the two precious metals are the iShares Silver Trust (NYSE Arca: SLV) and the SPDR Gold Shares (NYSE Arca: GLD) respectively.

Silver Bullion Spot Price

Gold Bullion Spot Price

You can take a look at my long term outlook analysis from last week here: http://www.thetechnicaltraders.com/gold-standard-to-be-reinstated-through-the-back-door/

Some may wonder why has silver outperformed gold in the past several weeks? The answer goes deeper than just confidence that QE3 is coming soon, but it is still rather a simple one. The sharp rally in silver was fueled largely by short-covering. That is, some investors (hedge funds, etc.) had made rather large bets that silver would continue falling and were caught off-guard by its recent rise. According to data from the Commodities Futures Trading Commission, the silver market during the week of August 27-31 saw the largest amount of short-covering since May 2011. At the same time. Bloomberg reported that hedge funds were the least bullish on silver in almost four years.

It is unknown for how long silver will outperform gold. But even some long-term fundamental investors such as legendary commodities investor Jim Rogers has said that he believes silver right now is a better investment than gold. He points to the fact that historically gold has been worth about 12 to 15 times what silver is worth, but that recently it has been worth roughly 50 times silver’s value. Silver is also the only major commodity not to have reached a new all-time high in the decade-long commodity bull market and is still cheaper than it was 32 years ago.

So it may be worth a look. But since silver is so volatile, wait for a downward spike before initiating or adding to a long position.

If you would like to get my weekly analysis on precious metals
and the board market join my free newsletter at www.TheGoldAndOilGuy.com

Chris Vermeulen

For the first time in over 30 years, talk of a return to the gold standard has become part of mainstream politics in the United States. Part of the official Republican policy adopted it at the recent Republican Convention and called for the commission to look at reestablishing the link between gold and the U.S. dollar. No doubt that plank was added to soothe supporters of Texas Congressman Ron Paul.

However, gold bugs holding gold bullion or even those holding gold ETFs such as the SPDR Gold Shares (NYSE: GLD) shouldn’t hold their breath in anticipation of the gold standard returning. There was a similar commission – the Gold Commission – set up in 1981 by President Ronald Reagan. After a lot of ‘commissioning’, the decision was made to go with the status quo of using fiat Federal Reserve dollars.

Any commission set up under the current president would likely come to the same conclusion. There are simply too many practical obstacles to return to a full-fledged gold standard. Even pro-gold advocates including the World Gold Council and the Gold Anti-Trust Action Committee (GATA) don’t see a gold standard returning.

The key problem would be at what price of gold would the United States peg its currency. Great Britain returned to the gold standard in 1925, after going off it in 1914, at the 1914 peg price. This was a mistake made by Winston Churchill (he called it the biggest he ever made) since it basically ignored the vast inflation in the British pound in those intervening years. The result was a vast overvaluation of the pound and deflation and high unemployment soon followed.

What price would a new Gold Commission set as the “correct” price of the U.S. dollar versus gold? $1,000? $2,000? $5,000? The answer is that there is no “correct” price. Whatever price is set will eventually be tested by the financial markets and fail much as the pegged currencies system failed. So there will be no return to the gold standard.

But that does not mean there will not be a ‘back-door’ gold standard. The move to such as a system is already underway as central banks all over the world are rebuilding their stockpiles of gold. After two decades of heavy selling, central banks became net buyers of gold in 2010 and the momentum has built since. Gold will likely end up being used as ‘good’ collateral by global central banks, as opposed to the shaky collateral sovereign bonds are turning into.

Central bank purchases, led by the emerging markets, are on track this year to hit a record high according to the World Gold Council. China alone in 2011 bought around 490 tons of gold. Other countries including Russia, Turkey and South Korea have added gold to their official holdings in recent months. This buying showed up as central bank purchases in the second quarter of 2012 were more than double the level reported a year earlier at 157.5 metric tons. If the buying continues at current levels, central banks gold purchases would total around 500 tons this year, easily surpassing last year’s 458 tons.

The bottom line for investors from the global central banks’ buying of gold? The gold standard is working its way back into the international monetary system through the back door. This should, in the long-term, put a floor under gold and help maintain it on its steady upward path.

Just last week we started to see gold bullion, silver bullion and gold miner share prices start to breakout to the upside of a 12 month consolidation pattern. This could be the start of the next major rally in precious metals as future uncertainty fears continue to rise. The large bullish technical pattern we see on the gold chart points to much higher prices over the coming 24 months. But keep in mind this is a monthly chart and it could still take months to truly breakout to new highs and start another rally.

Gold Bullion Trading

If you would like to get my weekly analysis on precious metals
and the board market join my free newsletter at www.TheGoldAndOilGuy.com

Chris Vermeulen


There should be an inverse relationship between gold (NYSEARCA: GLD) and copper (NYSEARCA: JJC).

Most of gold is used for investment purposes.  As a result, it rises when there is economic weakness and investors lose confidence in the fiat currency of a country.  Most of copper is used for industrial purposes.   Therefore, the price of The Red Metal should increase when economies are booming, as there is a greater demand for it from the factories operating at full throttle and for the buildings being constructed.

Gold Bullion Prices

Gold Bullion Prices

As the chart below evinces, the inverse relationship between the exchange traded for gold, SPDR Gold Shares, and the exchange traded fund for copper, iPath Copper, has broken down due to traders positioning themselves for the introduction of Quantitative Easing 3 when Federal Reserve Chairman Ben Bernanke speaks at Jackson Hole this Friday.

Continuing economic weakness in the United States will almost certainly lead the Federal Reserve to act in way that is more powerful than Operation Twist, the selling of short term securities to buy those with a longer term.   Based on the most recent data, economic growth in the United States is falling as the unemployment rate is rising.  A recent statement by the Federal Reserve was unusually clear in calling for greater action.

Both the JJC and the GLD have risen together as traders expect more economic stimulus from the United States Government.  This will weaken the US Dollar and raise the price of commodities, as happened with Quantitative Easing 2.  During the period of Quantitative Easing 2, from November 2010 to June 11, the US Dollar fell in value and the GLD and the JJC soared, along with other commodity prices, particularly oil.  This pattern is being repeated as traders are preparing for the initiation of Quantitative Easing 3 when Bernanke speaks Friday, or at the next Federal Open Market Committee meeting.

Gold Spot Price Chart

Gold Spot Price Chart


TheTechnicalTraders Analysis & Trade Idea Delivered To Your INBOX!