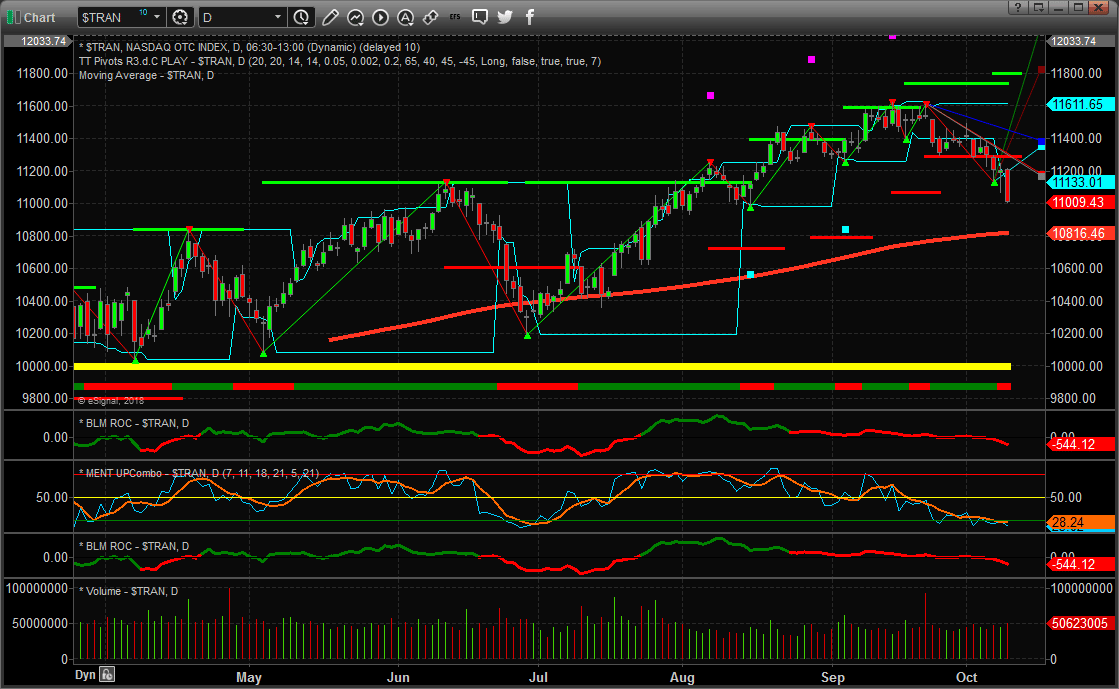
Our research team highlighted the recent breakdown in the Transportation Index ($TRAN) as a very strong sign that the global economy and US economy may be starting to show early signs of weakness.
The Transportation Index typically leads the markets by about 3 to 6 months (on average). When we see a big breakdown in the Transportation index, as we’ve seen recently, it immediately raises red flags that one or more component of the global markets may be crashing. At this point in the Seasonal Cycle, one could expect the Transportation Index to rotate lower a bit. Our concern is that global economic factors may be driving China and other markets into much deeper corrections – which could cause the US and other world markets to correct a bit further.
The recent price rotation is shown near the right side of this Daily Transportation Index clearly shows the recent downtrend and the current breakdown in price. This price breakdown cleared recent support near 11,290 and is currently resting near another support level near 10,980. Any further breakdown of the Transportation Index below the 10,980 level would suggest we could be looking at a very deep -10% to -15% price move.
Our research team will continue to monitor the Transportation Index, and all the other major US and Foreign markets, for additional signs of strength or weakness in the future. Right now, be prepared for what may become further price weakness in the US Indices as this breakdown in the Transportation Index suggests. Visit www.TheTechnicalTraders.com to learn more about our services for skilled traders and to see how we can help you navigate these markets.
Chris Vermeulen
http://www.thegoldandoilguy.com/wp-content/uploads/2014/11/tgaoglogo.png00adminhttp://www.thegoldandoilguy.com/wp-content/uploads/2014/11/tgaoglogo.pngadmin2018-10-10 21:54:482018-10-10 21:54:48Transportation Breakdown Hinting to Global Economic Weakness?
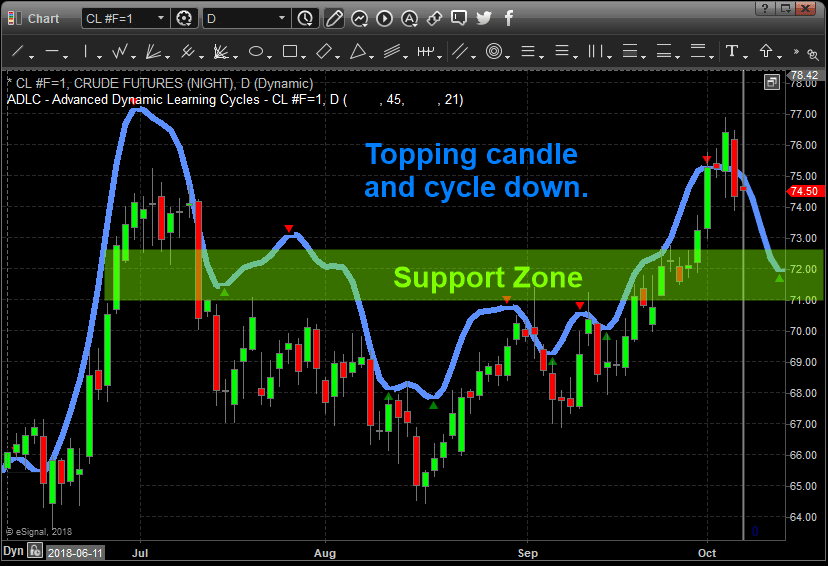
Our research team, at Technical Traders Ltd., has been very interested in Oil recently as the current rally appears to have rotated lower near a top. Our predictive modeling systems, predictive cycle analysis and other tools suggest Oil/Energy may be setting up for a downward price trend. This may be an excellent opportunity for skilled traders to identify profitable trades as this trend matures.
This Daily Crude Oil Chart shows our Predictive Cycle Modeling system and shows the projected price cycles out into the future. One can see the downside projected price levels very clearly. This cycle analysis tool does not predict price levels, it just predicts price trends. We can’t look at this indicator and think that $72 ppb is a price target (near the right side). We can only assume that a downward price cycle is about to hit and use historical price as a guide to where price may attempt to fall to.
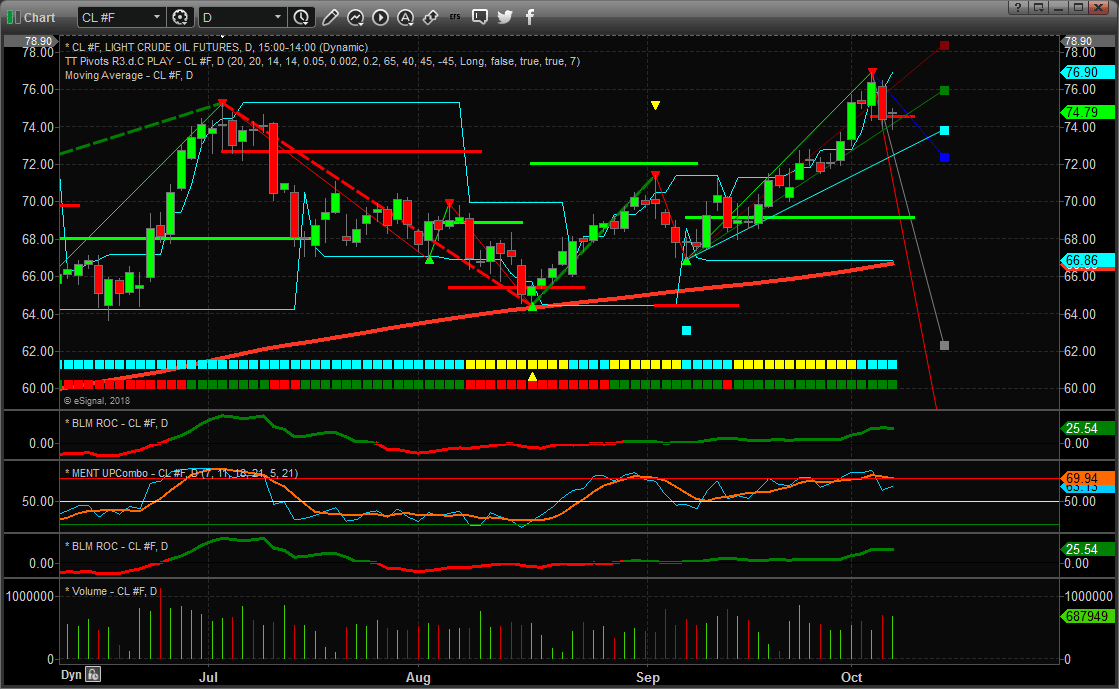
Using our adaptive Fibonacci price modeling tool, we can see from the chart below that downside price targets are currently near $72 ppb, $67 ppb and $65 ppb. Therefore, we believe the $72 price level will become the first level of support, where our price cycle tool suggests a small rotation may occur, and the $67 price level may become the ultimate downside target level.
We believe the current price rotation in Oil/Energy may be setting up for a decent downside price move with a lower price target at or below $67 ppb. Historical data shows that this type of price action, downward, at this time is historically accurate and predictable. If you want to know how you can profit from this move and learn how our research team continues to find and execute superior trades for our members, visit www.TheTechnicalTraders.com to learn more.
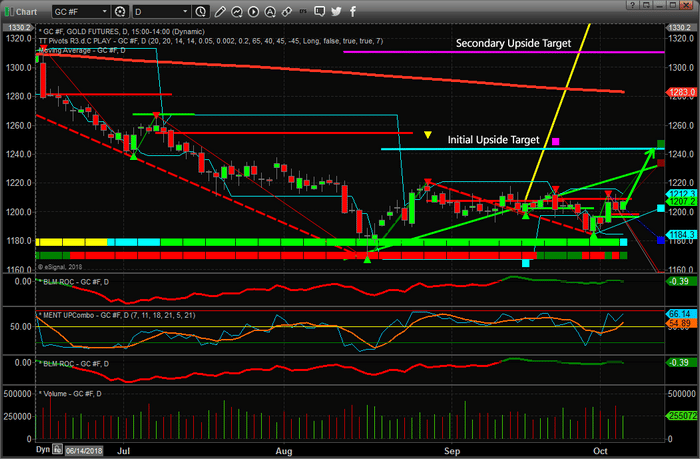
Our modeling systems are suggesting that Gold and Silver will begin a new upside rally very quickly. We wrote about how our modeling systems are suggesting this upside move could be a tremendous opportunity for investors over 2 weeks ago. Our initial target is near the $1245 level and our second target is near the $1309 level. Recent lows help to confirm this upside projection as the most recent low prices created a price rotation that supports further upside price action. What is needed right now is a push above $1220 before we begin to see the real acceleration higher.
The Daily Gold chart, below, shows our Fibonacci modeling system suggesting that $1235 to $1250 are the upside target ranges. Near these levels, we should expect some price rotation before another leg higher begins. Currently, support near $1180 is the floor in Gold.
If you are a fan of the shiny metals and want to know what we believe is likely to happen over the next 8+ months, then please take a moment to join the Wealth Building Newsletter to learn how we can help you find and execute better trades. We provide even more detailed research and predictive price modeling for our subscribers and we believe this bottom setting up in Gold may be the last time you see $1200 prices for a while. Check out www.TheTechnicalTraders.com today.
Chris Vermeulen
https://thegoldandoilguy.com/wp-content/uploads/2018/10/Chart_18-10-04_GOLD_Fib_D.png459700adminhttp://www.thegoldandoilguy.com/wp-content/uploads/2014/11/tgaoglogo.pngadmin2018-10-05 08:59:572018-10-05 08:59:57Prepare for a Gold/Silver Rally
Our focus is on developing and deploying very specialized price modeling and predictive analysis systems. Our objective is to inform our members of these potential price moves and to assist them in finding successful trading opportunities. We are alerting all of our followers of a potential move today, because we believe this move could frighten some investors as we expect price rotation as Q3 earnings data is released just before the November 2018 mid-term elections.
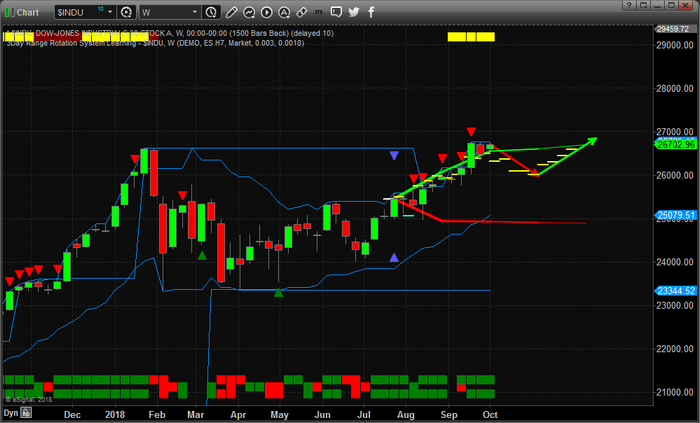
The weekly $INDU (Dow Industrial Average) chart shows our Adaptive Predictive Learning (ADL) modeling system at work. In this example, we asked our ADL system what it believed would be the most likely outcome originating from July 23, 2018. The reason we selected this date is because this weekly price bar prompted the current upside price move. This type of price trigger can often generate highly accurate future predictive price data. This bar consisted of 11 unique price markers that predict future price moves, first lower, then back to the upside, with a range of probability from 83% to 96%. The initial downside price move suggests that an initial -800 to -1000 pt move (-4%) will take place before November 10, 2018. Subsequently, price should begin to move upward again after the US mid-term elections and through the end of 2018.
In conclusion, October is known as a weak month for US equities so get ready for price volatility and expect the Tech-heavy NASDAQ to rotate in a larger range than the S&P and the $INDU. Additionally, expect the VIX to increase in value over the next 30+ days as October passes.
I will admit the charts in July/Early September were showing signs of a market correction in mind September but no bearish reversal pattern formed and price continued higher. During this time we closed out a position in YINN for 14% profit and another 4.3% in the IYT ETF. This goes to show how we can profit to the long side even when we are expecting a sell off the markets. We trade based on technical analysis and use our ADL and other forecasting analysis to add more conviction to a move, but we don’t trade based on predictions along.
If you want to know how we help our members find and execute for greater success, visit www.TheTechnicalTraders.com to see our completed trades for this year and learn how we can help you find great opportunities now and in the future.
Just in time for what appears to be a potentially massive market price rotation, our researchers have put together this post to highlight what we believe will become a surprise price correction in the US Equities markets. Our team of researchers believes the correlation of our predictive modeling tools, predictive cycle tools, and other indicators are set up for what may become a massive 5~8% price rotation over the next 60 days.
We were expecting this rotation to start unfolding around mid-September (now) but at this time the technical are still bullish so we are not betting against the market just yet.
The combination of new US tariffs ($200 Billion about to hit in the China trade war), as well as a combination of technical issues with regards to Technology Stocks and retail expectations, could jolt the market if a correction does take place as our predictive modeling tools suggest. A simple rotation of 2~3% is fairly common in the markets. These predictive modeling solutions are suggesting we are just 4~5 days away from the start of a much bigger correction in the US Equities and Indexes.
We believe the coming US elections in combination with the other aspects of the global economy are going to drive a downward price correction that many people are not expecting right now. But there is one pocket of stocks that could benefit from this tariff stuff which members or our Wealth Building Newsletter just got long today!
Anyway, Let’s take a look at some of our index charts to see how this will likely play out.
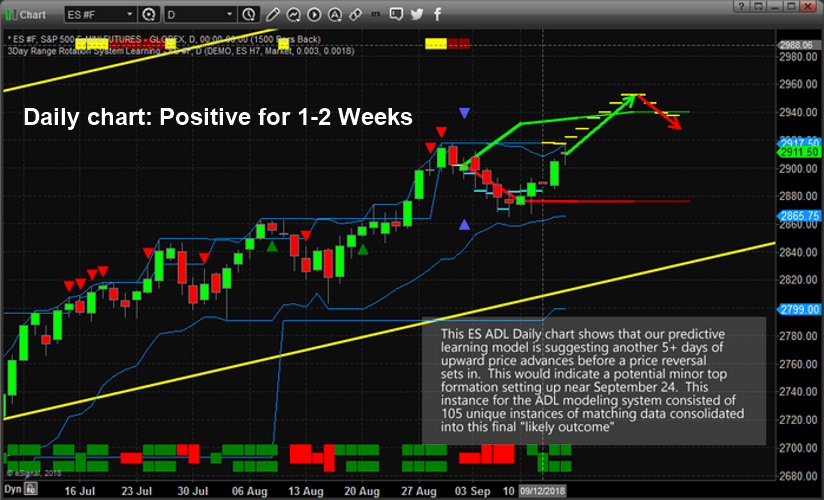
This first chart is a Daily ES chart showing our Adaptive Dynamic Learning (ADL) predictive price modeling tool. The YELLOW/CYAN dashed lines over the price bars and into the future show the highest probable outcome from the ADL predictive modeling analysis. This instance that predicts a 5~6 day price advance before a price peak sets up consisted of 105 unique instances of correlative price data making up this predictive analysis. In other words, 105 unique instances of similar predictive price patterns and predicts future price moves based on the highest likely outcome of all instances of data.
In this case, the ADL modeling system is suggesting we have about 4~6 more days of moderately higher price activity before a price top/peak will setup – prompting a new downward price trend.
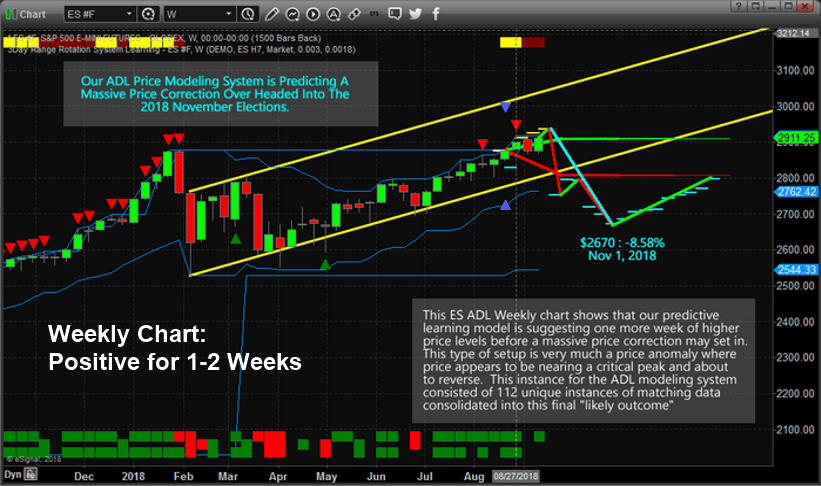
This ES Weekly ADL price chart correlates with the Daily chart almost perfectly. The Weekly chart predicts one additional week of upward price action before a massive 5~6% price decline drives prices lower. This massive price rotation executes over a 1 to 2-week span before briefly stalling, then an additional price decline of about 2% sets up driving prices to a predicted low near $2670 (-8.58%) on November 1, 2018 (just before the US elections).
This ADL analysis was generated by 112 unique instances of similar price data and the combined highest probability outcome is shown by the YELLOW and CYAN dashed lines on the chart. Simply put, we have a very high probability of a 5~8% price correction setting up over the next 20+ days in the US Equities markets with a projected bottom setting up near $2670.
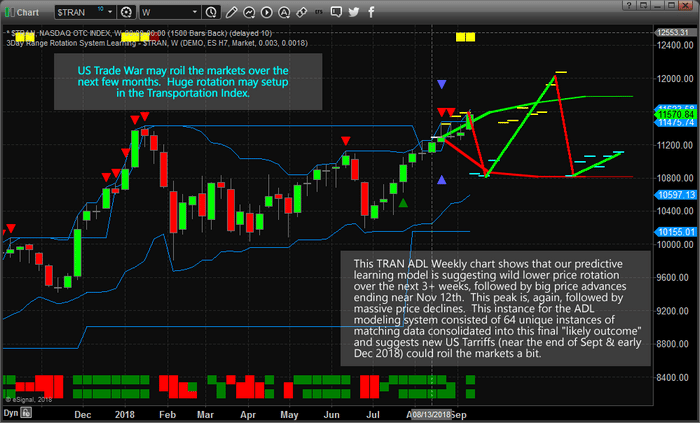
This last Weekly Transportation Index chart displaying the ADL predictive modeling system paints a very interesting picture when you combine it with the two earlier charts. The Transportation index typically leads the major markets by about 3 to 6 months. We have seen continued upside price advances in the Transportation Index over the past 6 months which leads us to think the US equities markets will continue to push higher overall. Yet, this Weekly ADL predictive modeling chart shows two massive price rotations are likely to unfold before the end of 2018. The first one is set up for a downside price rotation, ending near $10,800, starting the week of September 17, 2018, and lasting about 3~4 weeks. Then, the ADL predicts the Transportation Index will rocket higher, near $11,800, for about 5~6 weeks before falling again to retest the $10,800 lows near early December 2018.
We believe critical global news and expectations regarding global trade, banking and credit may become the catalysts for these moves. The US is expected to enact over $200 billion in trade tariffs this week with China. We believe the ADL predictive modeling system is capable of identifying these massive price rotations and predicting the future rotations simply because of the massive amounts of data that it is capable of crunching. This Weekly ADL prediction consisted of 112 unique price instances and displays only the highest probable outcome. In other words, our predictive modeling system is suggesting these price moves are likely to happen based on its analysis with a greater than 50% probability.
Please pay close attention to our research posts and other articles throughout the end of this year and early into 2019. As we have been attempting to warn our followers, expect increased volatility and wider price rotation throughout the end of this year.
We expect to find a number of incredible opportunities for our members over the next few months and we have already been incredibly successful throughout this recent price rally. Our ADL systems predicted this upside price move in February of 2018 and we have stuck with it. Now, the ADL is predicting a massive rotation is about to take place – somewhat similar to February 2018. If you want to learn how to profit from these moves, visit www.TheTechnicalTraders.com to learn how we help our members stay ahead of these types of market moves.
Chris Vermeulen
Technical Traders Ltd.
https://thegoldandoilguy.com/wp-content/uploads/2018/09/Chart1.png500824adminhttp://www.thegoldandoilguy.com/wp-content/uploads/2014/11/tgaoglogo.pngadmin2018-09-17 22:10:212018-09-17 22:10:21Predictive Trading Model Suggests Falling Stock Prices During US Elections
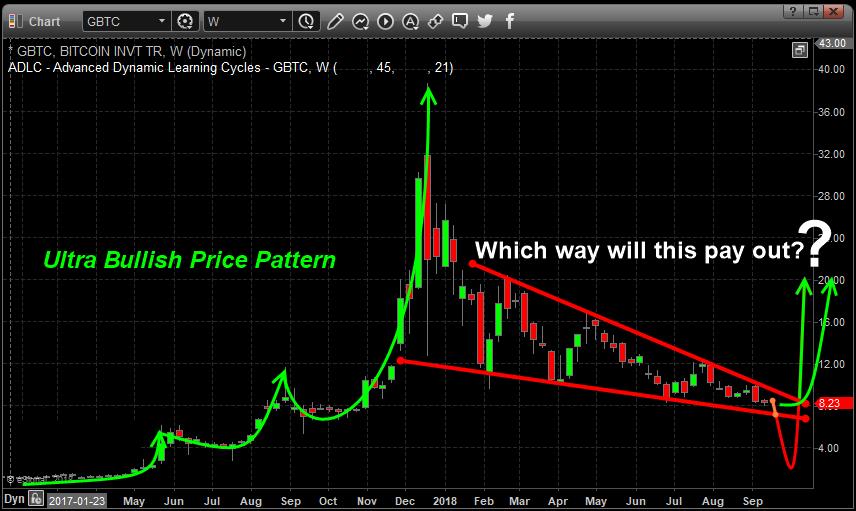
If you are a Bitcoin fan or looking for the next opportunity for a Bitcoin rally, you may not have long to wait before a price breakout takes place. Our research team, at www.TheTechnicalTraders.com, believes a price breakout may occur before the end of 2018 – the only question is will it be a breakout rally or a breakdown crash before the next mega rally?
Cryptos and, in particular, Bitcoin has increased in popularity and adoption over the past 24 months across the globe. Recently, Citigroup has announced new technology making Crypto transactions more secure and reducing the risk of such transactions. Additionally, Circle recently announced a US Dollar based Crypto-currency that is backed by Goldman-Sachs. News from Europe is that the EU has been urged to adopt common Crypto-Currency rules that will fuel more attention and enterprise on developing suitable Crypto solutions for the European markets.
All of this plays into our research that a breakout/breakdown is inevitable and it is just a matter of time before this coiling price consolidation “apexes” and expands.
This chart shows massive breakdown washout below $6000 taking it back to prices before crypto became popular in early 2017.
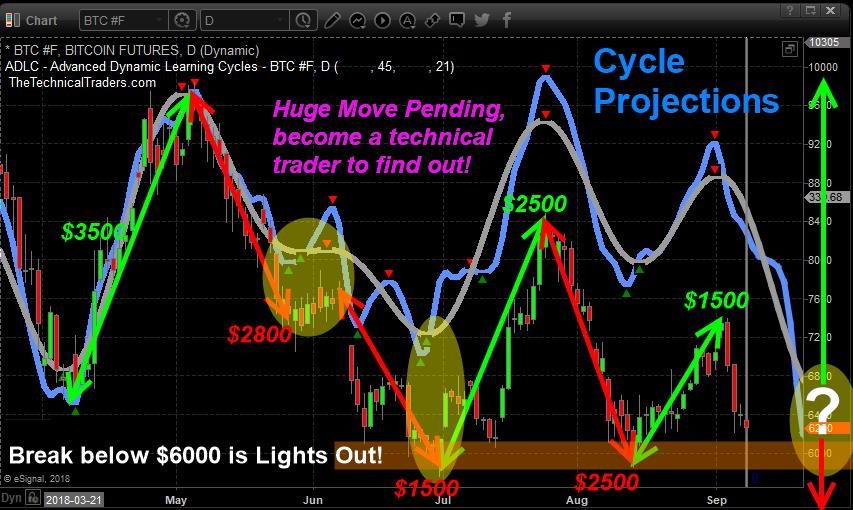
This next chart below shows our cycle analysis and how much bitcoin moved from our cycle bottoms to tops. We are now at NEARING a critical juncture of a $6000 breakdown which is clearly a support level, and a potential major cycle bottom or continuation down cycle. Huge money can be made from this extreme volatility that is about to unfold and savvy technical traders can see the profit potential unfolding.
We urge all traders to keep Cryptos in focus over the next few weeks and months. Our research team shares our proprietary analysis and research with our paid members regarding the Crypto-currency trends and trades.
If you want to learn what we believe will be the next big move in the Crypto markets, then visit www.TheTechnicalTraders.com to learn more. Our proprietary modeling systems are clearly showing us what we should expect over the next few weeks and months. As a member, you will have access to this research and benefit from our Daily Research Videos.
Chris Vermeulen
https://thegoldandoilguy.com/wp-content/uploads/2018/09/BtcHow1.jpg511856adminhttp://www.thegoldandoilguy.com/wp-content/uploads/2014/11/tgaoglogo.pngadmin2018-09-11 13:32:272018-09-11 13:32:27How Bitcoin Will Make You Big Money Again
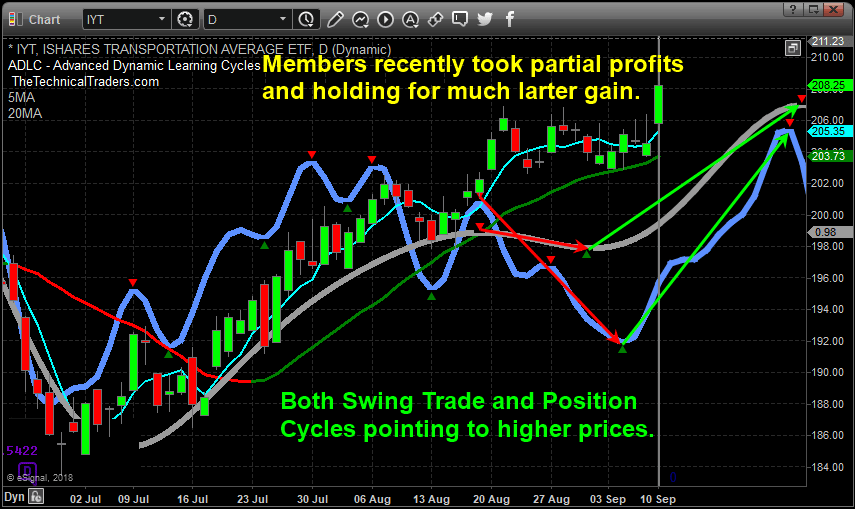
The recent upside breakout seen in the US Transportation Index is a very important signal for traders. Our research team has been following these moves for many months and we believe the recent upside breakout in the $TRAN is a strong sign of future US Equities price moves and all traders should be paying very close attention.
The Transportation Index typically leads the US Equities markets by about 3 to 6 months. Transportation is one of the core elements of economic activity. Items entering the US or distributed throughout the US must rely on transportation to ship/deliver these goods to resellers, wholesalers, and ports. When the Transportation Index rises, one should expect the economic activity to continue to increase.
Given that we are only three months from the Christmas holiday season and understanding that retailers, wholesalers, and warehouses have likely already been stocking up on the holiday items, it makes sense that the Transportation Index would have been climbing over the past few months. Remember, the Transportation Index leads equities by about 3 to 6 months. So, we would have expected the Transportation Index to rally about 6 months before December if the economy was strengthening.
The breakout rally currently exhibited in the Transportation Index paints a picture that many may not be aware of for early 2019. Should the Transportation Index rally continue into October or November, or possibly longer, this would indicate that the US Equities market could continue to rally well into March or April of 2019 – possibly much longer. This means traders looking for a massive top any time soon, or big short sellers could have some big soling positions as this rally continues for the next 6+ months. While many are bearish on stocks and short the market, we remain long IYT with our position with members.
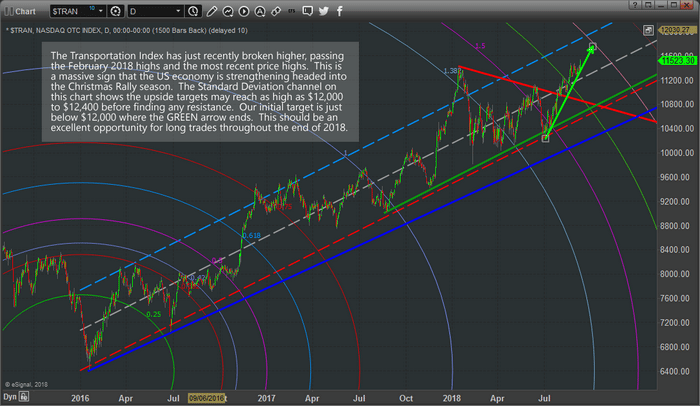
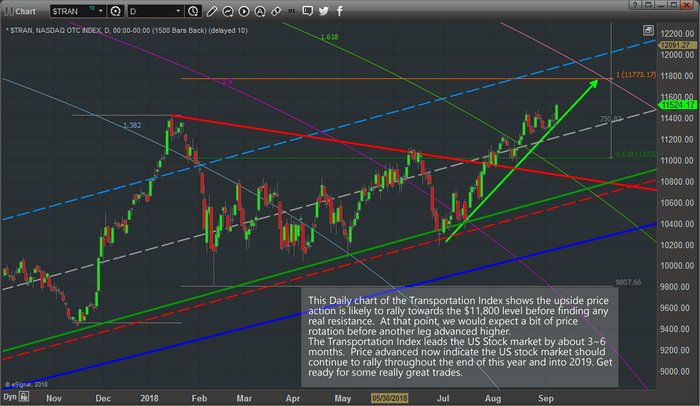
Let’s take a look at another chart. This Daily Transportation Index chart is very long term as we wanted to clearly illustrate the Standard Deviation channel that is in place going all the way back to 2016. The DASHED lines on the chart represent the Standard Deviation channel range that is likely to continue to operate as a price boundary going forward. The ARCs that appear on the chart are a unique tool we use to measure Fibonacci price acceleration and ranges. The upside price breakout points to an upside target of near $11,800 to $12,00 very quickly. From this level, we expect a bit of price rotation before another upside leg begins.
This next chart is the same Daily Transportation Index chart, just a closer view of the most recent 10+ months of price data. We can still see the Standard Deviation channel ranges and the upside breakout highlighted by our GREEN arrow. We’ve also added a Fibonacci price extension tool based on recent price rotation that points to an $11,773 upside target. We see confluence in multiple analysis techniques when multiple studies point to the same outcome. In this case, the Fibonacci Arcs, Fibonacci extensions and Standard Deviation channel all support the continued rally to near $11,800 for the Transportation Index.
As traders, this should be a very interesting and rewarding “look into the future” for many of you. These charts are suggesting the US Equities markets may continue to push much higher well into early 2019. As long as this upside trend in the Transportation Index continues, we should continue to expect a strengthening US economy, stronger economic and GDP levels and stronger consumer activities. In other words, get ready for some great long trades over the next few months and get ready to pick apart these opportunities as they play out.
Our team or researchers and professionals have been long the Transportation index for many weeks now. We identified this move months ago and alerted our followers to get into this trade early. If you want to know what our team of professional traders are telling our members now and how to find great opportunities throughout this move, visit www.TheTechnicalTraders.com to learn more.
Chris Vermeulen
https://thegoldandoilguy.com/wp-content/uploads/2018/09/iytprofits.png509855adminhttp://www.thegoldandoilguy.com/wp-content/uploads/2014/11/tgaoglogo.pngadmin2018-09-10 15:19:572018-09-10 15:19:57Transportation Index Leads Equities Higher
53 years experience in researching and trading makes analyzing the complex and ever-changing financial markets a natural process. We have a simple and highly effective way to provide our customers with the most convenient, accurate, and timely market forecasts available today. Our stock and ETF trading alerts are readily available through our exclusive membership service via email and SMS text. Our newsletter, Technical Trading Mastery book, and 3 Hour Trading Video Courseare designed for both traders and investors. Also, some of our strategies have been fully automated for the ultimate trading experience.
http://www.thegoldandoilguy.com/wp-content/uploads/2014/11/tgaoglogo.png00adminhttp://www.thegoldandoilguy.com/wp-content/uploads/2014/11/tgaoglogo.pngadmin2018-08-31 21:47:122018-08-31 21:47:12US Dollar, Canadian Dollar, and Mining Stocks
Our researchers at Technical Traders Ltd. have identified a potential in the markets that many people may have overlooked or are not prepared for. The recent strength in the markets has skewed many opinions toward the bullish perspective as the S&P, DOW, Transports and Nasdaq have all pushed towards new all-time highs.
We are writing this research post to alert our followers that we believe the US Indices and major markets may be setting up for a moderately deep price pullback that could be in excess of 5% or more.
Our proprietary price modeling systems and advanced learning models are warning us that the upside trend is likely still in place, yet there is a growing and stronger potential for a price pullback that could result in a 4~7% pullback in the near future. We want to alert all our followers that we believe an immediate price pullback is setting up and to protect your long positions.
The continued rally in the US majors has allowed many traders to become overly comfortable to the potential for a major pullback. Much like what happened in February 2018, when a bigger pullback did happen, all of the sudden traders were screaming that a massive top had formed and that everyone should watch out for a further breakdown in price values. We are not saying that right now and we want to be clear – so please read the following statement very clearly…
We believe a 4~7% price pullback is setting up in the US markets that will likely extend into September 2018 before forming a new price bottom and prompting the markets to rally to new all-time highs before the end of 2018. We believe this price pullback/rotation is healthy for the markets after such an extended rally and we believe many traders are discounting the potential for such a move and will surprise many traders. Protect your long positions and prepare for this type of price pullback. You will be able to re-enter your positions as the bottom sets up and a new rally begins.
Let’s take a look at some of the charts that support our research.
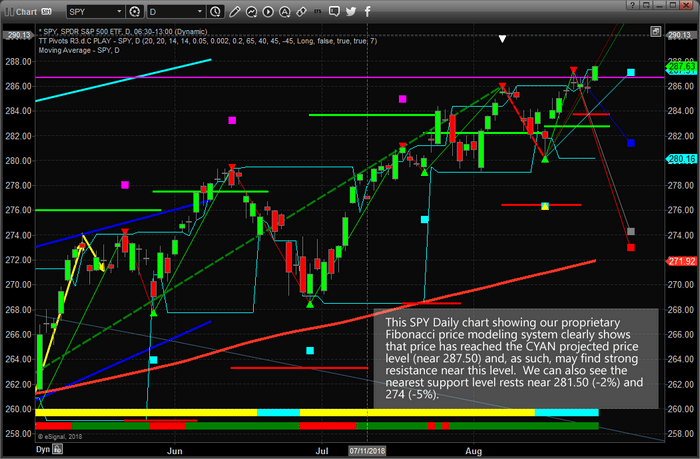
We’ll start with the SPY and highlight our proprietary Fibonacci price modeling system. The recent Daily price rotation in the SPY has illustrated that price has reached the CYAN projected price point. This should be the first level of resistance that price encounters within the current rally. The lower BLUE projected price point is the current major support level. The fact that we are currently breaching the all-time high levels adds greater weight to the fact that resistance should be relatively strong near these highs and that we could see a major price rotation setting up near these levels. The downside Fibonacci price targets suggest a 2~5% price decline is possible given current price ranges.
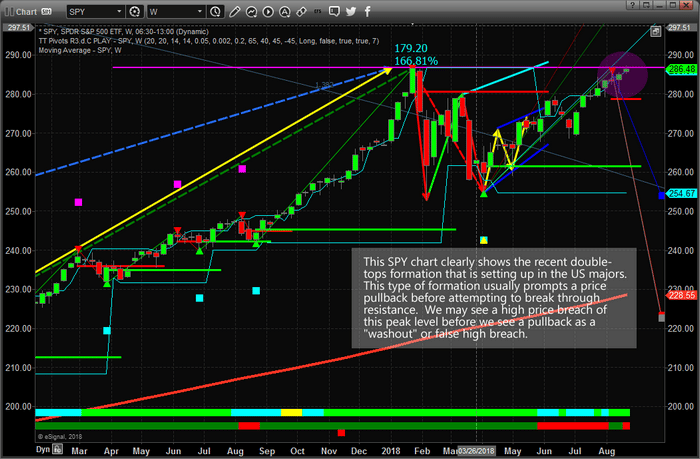
This Weekly SPY chart highlights the key resistance level that is currently at play in the markets from the February 2018 highs. Our proprietary Fibonacci price modeling system is suggesting that prices could, and should, continue to rally to well above the current highs over time. Yet, the current Weekly downside price projection levels show a potential for price to move to 254.65 as the nearest key Fibonacci support level – and possibly even lower to near $224. Yes, this Weekly chart is indicating the SPY could fall -12% on a medium-term pullback or as far as -22% with a deeper pullback and still have the potential for new highs before the end of 2018.
You might be asking, “how could this happen and what would prompt this move?”. We assume it would be some geopolitical or global economic mini-crisis that would prompt such a move, but it could be that investors simply rotate capital out of the US markets chasing opportunities in other foreign markets or debt instruments. The fundamentals for a continued US rally are still in place for at least 6+ months – we are just concerned that a moderately deeper pullback than many are expecting is right around the corner and about to hit the markets. We don’t believe this pullback will be the start of a new bearish price trend.
If you want to learn more about our research, services and how we can help you find and execute better trades, then please visit www.TheTechnicalTraders.com to learn about our team of researchers and products for traders. You can also review all of our past research posts to learn how we have been calling these market moves for the past 12+ months. We urge you to pay attention to our work because we believe we have some of the most advanced and accurate market timing tools on the planet. Time will tell if we are correct with Today’s call – bet we want you to understand the risks and potential rewards that are presented right now in the markets. Take a minute to see how we can help you become a better trader as these moves play out over the next 12+ months.
https://thegoldandoilguy.com/wp-content/uploads/2018/08/1.png459700adminhttp://www.thegoldandoilguy.com/wp-content/uploads/2014/11/tgaoglogo.pngadmin2018-08-26 10:53:342018-08-26 10:53:34Stock Market Setting Up For A Bigger Pullback – Part I
The recent downward price swing in Gold has kept Goldbugs frothing at what they believe is a very unusual and unexplained price function in the face of so much uncertainty throughout the globe. With Turkey, Russia, China and many others experiencing massive economic and currency crisis events, Gold has actually been creeping lower as the US Dollar strengthens. It is almost like a “Twilight Zone” episode for Gold Bulls.
The setup for a gold rally has been in place for over a decade. Much like in 2006 through 2008, the current price and volatility of Gold is simply mundane. For the past two years, Gold has rotated between $1190 and $1360 – within a $180 range. Certainly, Gold traders were able to find some profits within this range, but no breakout trends have been established since early 2016 when the price of Gold changed from Bearish to Bullish and a 31% rally took place driving prices $328.80 higher from the lows.
Our team of researchers, at www.TheTechnicalTraders.com, believe something very interesting may be taking place in Gold right now – almost like a “Deja Vu” of the past. A double setup appears to have taken place recently and we believe the bottom may have already formed in Gold for now.
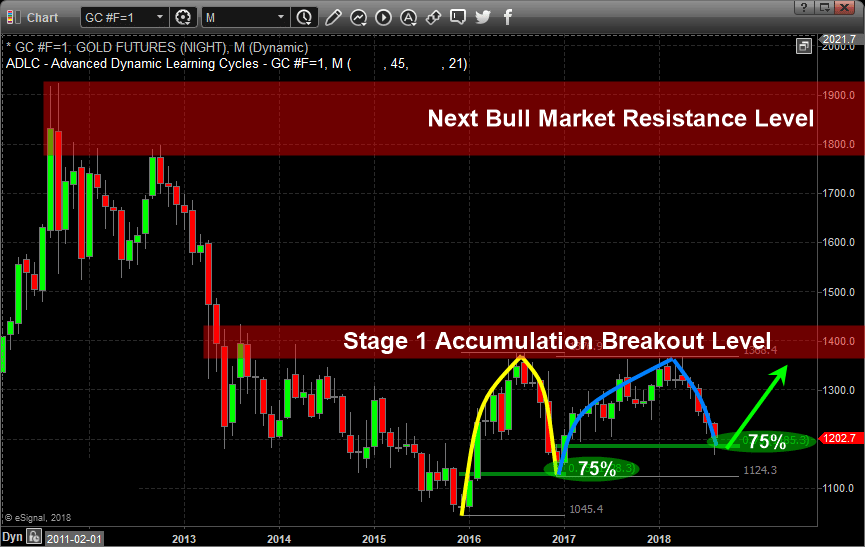
In early 2016 through November 2016 where price rallied 31% then retraced nearly 75% to form the second leg higher. This deep retracement of price was indicative of a wide price rotation before another leg higher pushed back up to near the all-time highs.
From 2017 until now the Gold chart shows another 75% price retracement from recent highs once again. This second 75% retracement could be a massive bottom formation setting up in Gold and could be a huge “wash-out” low price. We believe this unique retracement is indicative of a massive price breakout over the next year or so as the price of gold is forming what Stan Weinstein calls a Stage 1 Accumulation.
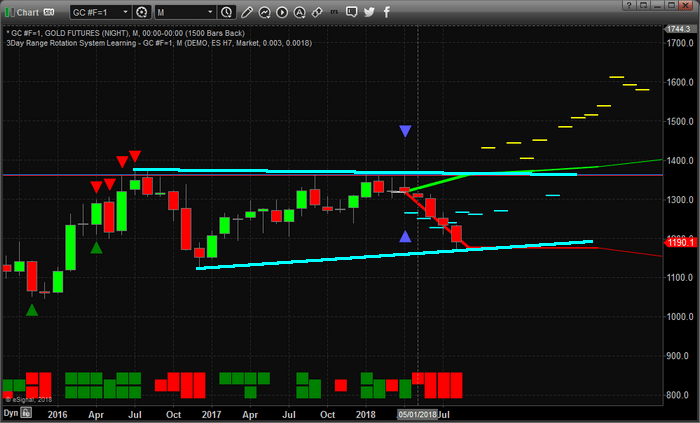
Now, let’s zoom in and take a look at the weekly chart and our Adaptive Dynamic Learning model, the predictive analysis suggests that Gold prices should begin to bottom within the next week or two and begin to climb much higher over the next 3~10+ weeks.
This pattern consists of 12 unique instances of data and suggests that the future upswing will start rather mild for the first 2 weeks, then begin to accelerate as time progresses. It appears we have a strong potential to see prices above $1400 within the next 5~8 weeks or so and you look at the previous chart above, what is the $1400 level? You got it! Resistance, and if price breaks out above $1400 a new bull market would be triggered!
As many of you are aware, Gold is often a move to safety when the global economy begins to show signs of chaos or weakness. We believe the move in the US Dollar will stall and possibly correct as this move takes place. If Gold were to rally while the US Dollar continued to strengthen, you can clearly assume that a flight to safety is taking place and it includes a massive capital migration toward US equities and GOLD. If the rally in gold is seen while the US Dollar weakens or stalls, then we are seeing a move to safety while the currency markets address regional and global currency market issues.
Either way, we expect Gold to begin a new rally higher off of this 75% retracement level to complete the Pennant formation that is currently set up for a Wave 5 upside price expansion. Some of this technical analysis may be over your head as it can be confusing, but you should get the gist of things which is that precious metals should find a bottom and there is the potential that a massive bull market could be on the horizon if price rallies quickly. Be prepared for this move because the Gold shorts will likely be forced to cover their positions within the next few weeks as this move begins to accelerate higher.
Visit www.TheTechnicalTraders.com to learn how we can help you find these types of swings in the major markets. We alert our clients well in advance of these swings and deliver daily video content to all of our members before the market opens each day. Our objective is to make you a better trader and to help you find successful setups to create greater success. Visit our website to learn how we can help you become a better trader today.
Chris Vermeulen
Technical Traders Ltd.
https://thegoldandoilguy.com/wp-content/uploads/2018/08/gc1.png547865adminhttp://www.thegoldandoilguy.com/wp-content/uploads/2014/11/tgaoglogo.pngadmin2018-08-21 20:07:462018-08-21 20:07:46Is Gold On Verge Of A Bottom, See For Yourself