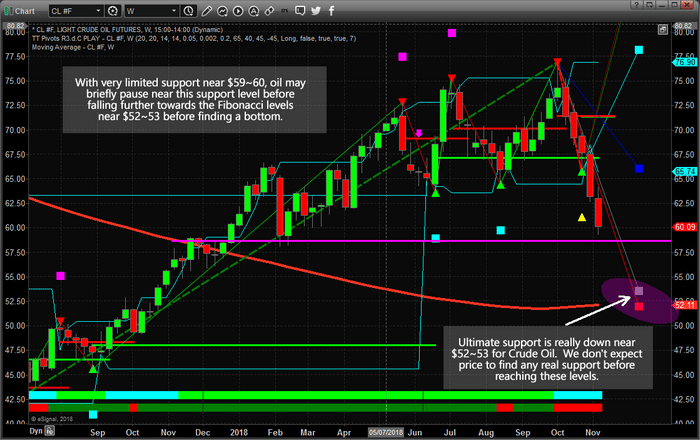
Our research team warned of this move in Crude Oil back on October 7, 2018. At that time, we warned that Oil may follow a historical price pattern, moving dramatically lower and that lows near $65 may become the ultimate bottom for that move. Here we are with a price below that level and many are asking “where will it go from here?”.
We believe the support near $65, although clearly broken, may eventually become resistance for a future upside price move. Our proprietary Fibonacci price modeling system is suggesting a new target near $52~53 and we believe this downside move in Oil is far from over at this point.
The current global climate for Oil is that suppliers are pumping more and more oil into the market at a time when, historically, prices should continue to decline. One of our research tools includes the ability to identify overall bias models for each week, month or quarter. Historically, Oil is dramatically weaker in the month of November and relatively flat for the month of December.
Analysis for the month of November = 11
Total Monthly Sum : -44.52000000000001 across 36 bars
Analysis for the month of December = 12
Total Monthly Sum : -0.699999999999922 across 36 bars
We believe the price of oil will continue to drift lower to target the $52~53 Fibonacci support level before attempting to find any real price support. This equates to an addition -6 to -8% price decline for skilled traders. We will alert you with a new research post as this downward price move continues or new research becomes available.
We have been calling these types of market moves all year and recently called the top in the US Equity markets nearly 40 days before it happened. Want to know what we think is going to happen for the rest of 2018 and into early 2019? Visit www.TheTechnicalTraders.com/FreeResearch/ to read all of our public research posts. Isn’t it time you invested in a team of researchers and tools to assist you in finding greater trading success?
Chris Vermeulen
https://thegoldandoilguy.com/wp-content/uploads/2018/11/Chart_18-11-09_CL_W_Fib.png440700adminhttp://www.thegoldandoilguy.com/wp-content/uploads/2014/11/tgaoglogo.pngadmin2018-11-11 21:38:222018-11-11 21:38:22Will Oil Find Support Near $60?
Our research team is writing this message to alert all investors and traders of a pending rotation in the US stock market that may happen between now and November 15. The upside price breakout that is occurring on November 7, the day after the US mid-term elections, is an incredible display of global investor sentiment regarding the GOP success in the Senate and the continued business-friendly expectations originating out of Washington DC. The move, today, shows how clearly a global capital market shift is still engaged in the US markets and how much global investors are counting on the US to drive ROI and economic growth going forward.
Yet, we feel it is important to urge investors that our modeling systems are still suggesting an ultimate price bottom should be setting up near November 8~15 and that we could still see a bit of downward price rotation over the next few days before this ultimate price bottom completes. It might be too easy to get caught up in this move, today, and fail to properly understand the price rotation risks that are still active in the time/price horizon.
The ES is currently +48.00 as of the creation of this post (+1.74%). This is an incredible move higher and the 2790 level becomes critical support for the markets as long as price is able to stay above that level.
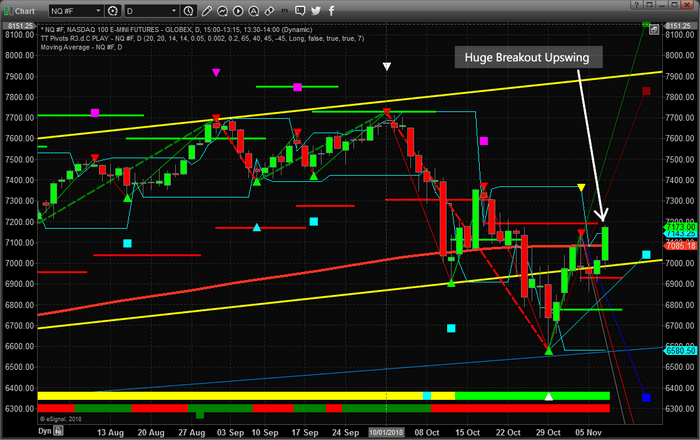
The NQ is currently +172.50 (+2.45%) and shows just how clearly investors are piling into technology, healthcare and bio-tech after the US elections. This is a real vote from investors that they believe President Trump will be able to navigate any issues going forward and that the US economy will continue to push out strong numbers.
Follow our analysis to read our most recent research posts. We have already positioned our members for this “ultimate bottom” that our predictive modeling systems suggest is in the midst of forming. We called this entire downside move, bottom rotation and the ultimate bottom pattern setting up near November 12th back on September 17. If you want to learn how we can help you find and execute better trades, visit www.TheTechnicalTraders.com to learn more.
Chris Vermeulen
https://thegoldandoilguy.com/wp-content/uploads/2018/11/1-1.png440700adminhttp://www.thegoldandoilguy.com/wp-content/uploads/2014/11/tgaoglogo.pngadmin2018-11-07 22:07:352018-11-07 22:07:35US Equities Roar To Life After Elections
Today is the day that most of the world, and certainly all investors/traders, are watching as the US mid-term elections play out. The news channels and just about everyone is talking about how the results of these elections will potentially change or alter the US and global economies. Many are prognosticating that a solid red or blue result will drive investor sentiment and capital shifts for many months – which is correct.
Capital is very fluid and actively hunts for the safest and best returns. Over the past two+ years, our researchers, at www.TheTechnicalTraders.com, have authored countless articles highlighting our belief that a massive capital shift was taking place where global cash was rushing into the US markets after the 2016 Presidential election in an effort to ride the increased share price valuations and a safe-harbor element provided by US equities. This current election may change this perception a bit based on the final outcome of the elections, but we continue to believe the US equities markets and economy will continue to drive renewed growth and opportunity for at least 3~4 more years.
We, certainly, believe that valuations within certain sectors may become a concern over the next 24 months or so. Yet, we don’t believe the continue capital shift where cash has been rushing into the US markets and supporting the US Dollar is going to change dramatically with this current election cycle. We believe the US economy is firing on nearly all cylinders right now and it would take a massive blow to the political, economic and geopolitical landscape to unravel the US economy as it sits currently.
If you’ve been following our research posts, you already know that we called a market bottom near October 15th – yes, a bit early – we get it. Our proprietary indicators did not foresee the Fed/housing data news that resulted in the extended pricing pressure, lower, to the ultimate lows near October 25th. Yet, with October behind us and the US mid-term elections playing out, we are certain many of you want to know what we see in the future for the markets. So, here we go…
The reality is that our analysis has not changed much since we posted, on Sept 17th, our warning that the US stock market would likely experience a 5~8% price correction on or after September 21 and find an ultimate price bottom near November 8~12th before beginning a new upside price rally. These predictions were made nearly 60 days ago and our analysis has been quite accurate since we made our predictions (yes, we know we missed the extended downside move near October 25). When you consider the fact that we made these predictions using our proprietary price modeling and adaptive learning systems many months ago, one has to ask the question “if they can predict the markets with this type of accuracy, what else can they predict?”
The answer is quite simple, our analysis models and predictive learning systems are capable of identifying high probability price trends and key “price anomaly” structures before they happen – in some cases, many months before price rotates. Right now, the most important aspect of our predictive modeling that we urge all of our readers to understand is that an ultimate price bottom should be set up between Nov 8 and Nov 12. After that time, we expect a new price rally to begin sometime near after Nov 15th. We will continue to alert our followers with new predictive modeling as these key dates/predictions play out.
Now, let’s take a look at some charts to highlight what we believe will take place over the next few weeks.
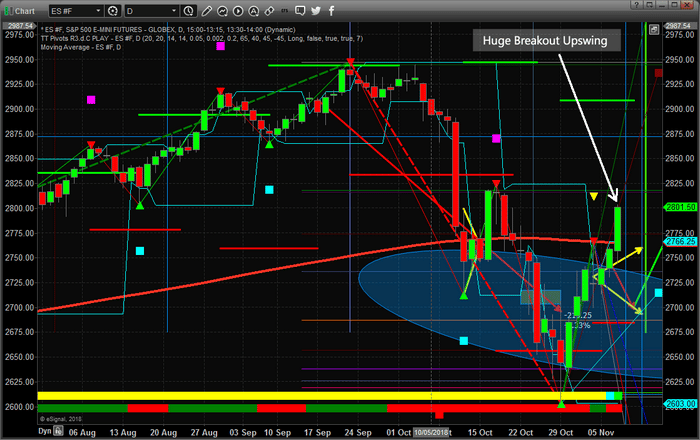
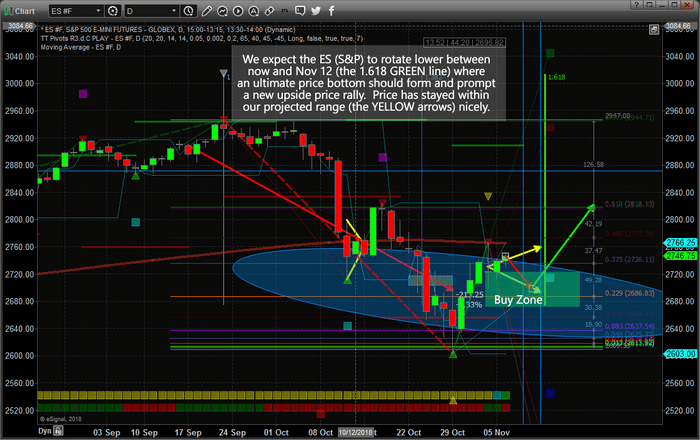
This Daily ES (S&P) chart shows our ongoing research and predictions from the week ending Nov 2 and earlier. At that time, we predicted the future price activity of the ES would stay within the YELLOW ARROWS range headed into the US elections and through our ultimate bottom price date range between Nov 8 and Nov 12. The vertical thin blue lines highlight those two key dates. The heavy GREEN LINE (1.618) reflects a key Fibonacci time/price cycle that is occurring on or near Nov 12. This is a very important indicator that a key price inflection point is likely to drive a massive price rotation near this date. Our expectations are that price will rotate and likely fall into the BUY ZONE over the next 5+ days, setting up a very important opportunity for skilled traders. As we move closer to the Nov 8~12 ultimate bottom date, we expect the price to begin a moderate rally higher and eventually breakout to the upside targeting the 2830~2840 level initially.
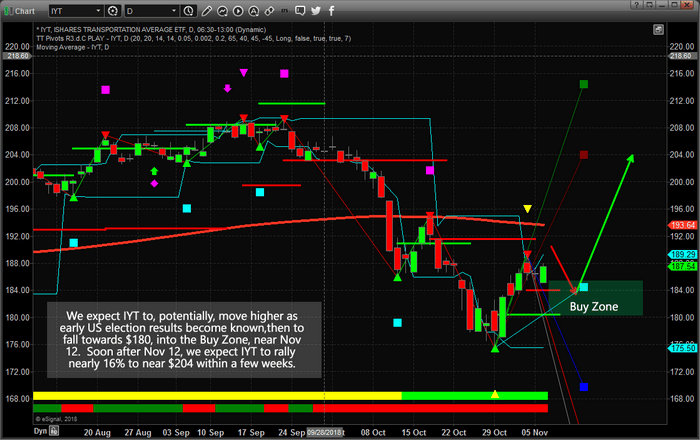
We expect the Transportation Index (IYT) to mimic the ES, to some degree, and present a new opportunity for skilled traders near the BUY ZONE. We believe this rotation will be the result of shifting perspectives and expectations as the election data is released. We’ve read that the true final outcome of the US mid-term elections may not be known for many weeks after the elections are completed, today. This means we could see an extended period of uncertainty in the US and global markets over the next few weeks. Additionally, we believe the general outcome will become known on or after November 15th. Thus, we believe our predictive modeling systems are accurately suggesting the final outcome of this election cycle will result in a positive outcome for the markets – likely a result of the continued strength of the US economy and the expectations of a Christmas Rally unfolding.
This IYT BUY ZONE presents a very clear opportunity for skilled traders to target a 10~15% upside potential if our predictions play out as expected. Get ready for some great trades to set up over the next 5+ months.
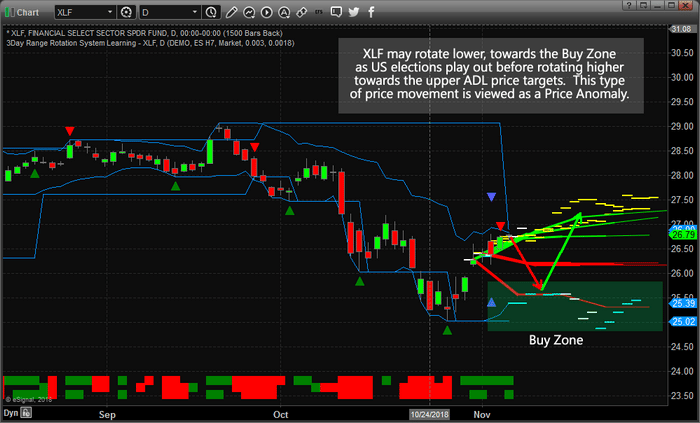
Saving the best for last, this XLF Daily chart (financials) highlights our Adaptive Dynamic Learning (ADL) predictive price modeling system at work. The interesting thing about this predictive modeling tool is that it can show us where we should expect the price to go well out into the future, but it can also highlight what we call “Price Anomalies” where price MAY rotate in a way that is counter to our predictive models. When this happens, we consider it an Anomaly where price is moving against predictive norms and, thus, is likely to and may “revert” back to the predicted price levels.
In the XLF example, below, you can see one of our predictive models suggested prices may move in a lower price range than the other predictive models. This is an “anomaly price range” and the way we interpret it is “if price does rotate lower, near the lower ADL price targets, then this sets up a potential for a very good Reversion Trade where price will attempt to move back towards the higher ADL prices” – roughly +5 to +8% or more. Therefore, if the price of the XLF falls below the GAP high, on Oct 30, of $25.94, we believe this sets up a very high probability “reversion trade” for a move back to near $26.90 or higher.
By this time, you should be seeing a common theme within our analysis. If you were paying attention, you will notice that we are suggesting the US equity markets will likely rotate a bit lower over the next 5+ days before finding and setting up for our predicted “ultimate price bottom” near November 8~12. These predictions allow for skilled traders to set up and position their portfolios for some incredible opportunities headed into the end of 2018.
We believe the outcome of the US mid-term elections may change some perspective of the economy and expectations a bit, but overall the US economy will continue to push along and drive greater expectations of capital growth and improving outcomes. Our opinion is that a massive price, and potentially global price destructive event, would have to take place to derail the current capital shift that is taking place throughout the planet. This current capital shift will not last forever, nor should we expect it to continue as it has for the past 24+ months at the same, or similar, levels. Yet, as of right now, we believe the outcome of the US mid-term elections will not dramatically alter the future pricing and valuation predictions of the US stock market going forward for at least 5+ months.
In closing, if you value the research, analysis and trading signals we share with you, as well as the effort we take to make sure you are keenly aware of our expectations and pricing models, then do yourself and our research team an favor and visit www.TheTechnicalTraders.com and consider subscribing to our services as a member. Our followers and members have commented that we are “the only team that can accurately predict prices and price rotation many months into the future” and we believe our proprietary predictive modeling tools are the best on the planet. If you like our research and have profited from our efforts to help you find and execute better trades, then please consider supporting our work by visiting www.TheTechnicalTraders.com. Get ready to make 2019 a fantastic year with great trades.
Chris Vermeulen
https://thegoldandoilguy.com/wp-content/uploads/2018/11/1.png440700adminhttp://www.thegoldandoilguy.com/wp-content/uploads/2014/11/tgaoglogo.pngadmin2018-11-06 23:24:232018-11-06 23:24:23Nov 6, US Mid-Term Election Day Forecast
With very strong US jobs data hitting the news wires this morning and an incredible upside price swing overnight because of expectations and hope of a US/China trade deal in the works, we were not surprised by the downside rotation in the US stock market this morning. As we’ve been warning for the past 3+ months, we expect the US stock markets to trade very narrowly headed into the US mid-term elections and begin a breakout upside price move sometime between November 8 and November 12.
The news events, recently, and the relatively strong earnings data suggest the US stock market and economy should continue an upward bias throughout most of the end of 2018 and into early 2019. If President Trump were to secure a favorable trade deal with China, we expect the US stock market could surge 4~8% over a few days/weeks on that news alone. Our opinion is that few traders want to hold any positions over the weekend headed into a potentially tumultuous election cycle next week.
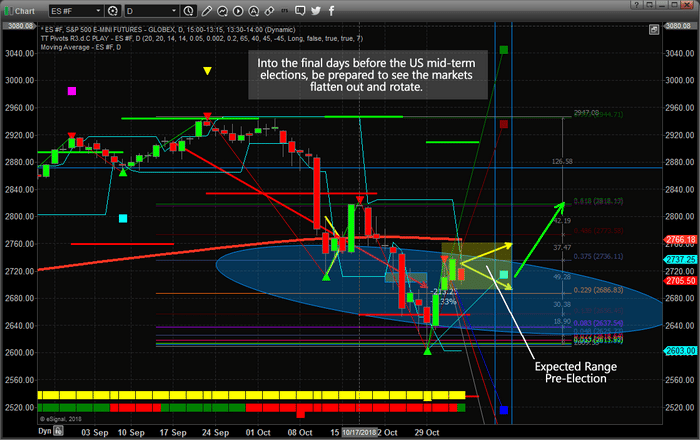
This Daily ES chart illustrates where we believe the price will stay before the US elections (The YELLOW arrows/box drawn on the chart). This range is roughly from 2690 to 2750 on the ES. We’ve also drawn two thin blue vertical lines that represent Nov 8 and Nov 12 – the dates which we expect the markets to establish a true price bottom and begin an upward price rally from. Additionally, we are displaying what we call “True Fibonacci Levels” on this chart in reference to key price target levels. We believe the initial upside price target will focus on the 2816 price level in the ES, then potentially push higher to the 2942 range. These True Fibonacci Levels are derived from our modeling systems calculations of Fibonacci Number Sequence relationships.
Additionally, the October 12th date aligns with Fibonacci Time/Price cycles as a key inflection point in price. Therefore, we strongly believe skilled traders should begin taking strategic positions in select markets/stocks prior to this point as we believe the price could move in a very dramatic and aggressive form after November 12th.
Please take a minute to visit our website to learn how we can help you stay ahead of these market moves. Visit www.TheTechnicalTraders.com and see just how easy and inexpensive it is to have a team of dedicated professionals working to help you become a better trader and deliver proprietary research, daily videos and more.
If you’ve been following our research, you already know how accurately we’ve called these past market moves. Pay attention to how the rest of this year plays out and see how accurate our predictions really are. We’ve called the moves in Oil, Gold, Technology, China/Asia, the US stock market and many more weeks or months before these moves happened. Isn’t it time you invested in your future success too?
Chris Vermeulen
https://thegoldandoilguy.com/wp-content/uploads/2018/11/cbts.png5611115adminhttp://www.thegoldandoilguy.com/wp-content/uploads/2014/11/tgaoglogo.pngadmin2018-11-04 14:10:342018-11-04 14:10:34Calm Before The Storm
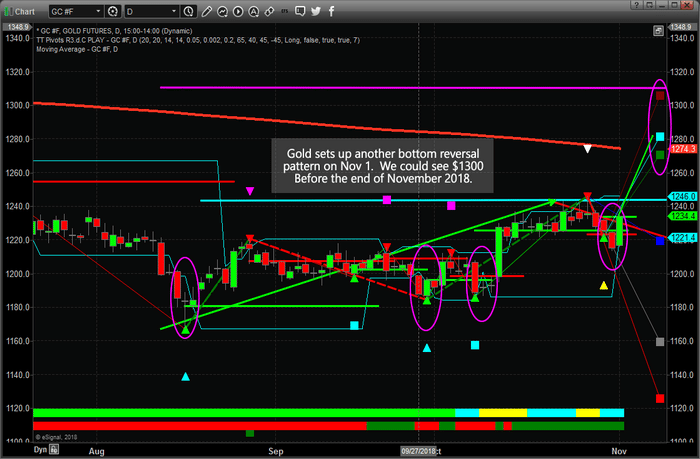
Today’s upside price move in gold, already up over $18 (+1.5%), sets up a real potential for a move to near $1300 before the end of November. We have been advising our followers that a strong potential for an upside move in the precious metals markets was likely and that a potential move to above $1300 was in the works prior to the end of 2018.
Global economic concerns and the fact that global central banks are accumulating physical gold are putting pricing pressures on Gold and many of the other precious metals. This is a sleeper trade in many ways, the US equity markets and the US Dollar are much stronger than many expected. A true capital shift is taking place throughout the globe at the moment and many foreign nations and central banks are hedging risk by accumulating physical gold. When the price of Gold does really start to move higher, it could be an explosive move to the upside – just like what happened back in 2005~2008 and 2009~2012.
Our predictive modeling systems are suggesting Gold could rally to above $1500 /oz in 2019 and we believe the current price levels are a gift for traders. Sub $1300 price levels may be the lowest prices we see for quite a while – don’t miss this opportunity to position your portfolio for this next move.
Take a few minutes to read our most recent research posts about Gold, Oil, the Global Markets and the US Stock Market by visiting www.TheTechnicalTraders.com/FreeResearch/. Learn how we can help you find, execute and plan for greater trading success with our videos, books, proprietary research, and trading signals. Don’t be surprised to see the US stock market rally as Gold and Precious Metals rally as well. The current global economic environment is vastly different than what most traders are used to experiencing – which makes it even more opportunistic for skilled investors/traders. Learn how we can help you find greater success, visit www.TheTechnicalTraders.com.
Chris Vermeulen
https://thegoldandoilguy.com/wp-content/uploads/2018/11/Chart_18-11-01_GoldOnTheGo.png459700adminhttp://www.thegoldandoilguy.com/wp-content/uploads/2014/11/tgaoglogo.pngadmin2018-11-01 20:58:042018-11-01 20:58:04Gold Sets Up For A November 2018 Rally To Near $1300
The clock is ticking on our expected bottom formation and now is the time for skilled traders to begin to position their trades for the remainder of 2018 and early 2019. We detailed why we believe the US equities markets have already, or are currently, hammering out a price bottom after the last few weeks downside price activity. In part one of this article, we illustrated how the US elections cycles are really more of a global geopolitical event and often drive price rotation in the months prior to these elections. Please take a minute to read Part 1 of this two-part research post if you have not already done so.
In this second part of our US election research post, we are going to continue to review topics that were previously discussed as well as highlight how certain market segments appear to be setting up for a massive price reversal. So, let’s get started.
Keeping in mind the information we presented in Part 1 of this research, our hypothesis is that US elections cycles present a huge opportunity for skilled traders by creating volatility and rotation in price and many segments of the global markets. Over the past 3+ years, we have been writing about what we call a “capital shift” that has been taking place. Near the end of the Obama presidency (2015 & 2016), a number of factors were taking place in the US and global economy. First, the start of the new Presidential Election cycle events was already working through the news cycles – the selection of the candidates. Second, China had recently instilled capital controls to prevent a capital outflow issue and to support their bulging economy locally. Lastly, emerging markets and oil had collapsed, putting incredible pressures on certain foreign markets to support their local economies and find suitable sources for their investments as currencies started to collapse as well.
This event, that actually started in 2014 or so, initiated what we call the “capital shift” where cash quickly moved out of risky investments and hunted for and deployed within safer investment structures – the US and major global equity markets. In particular, we believe the US Technology, healthcare and biotech sectors were huge beneficiaries of these new capital investments and we believe as these share prices started increasing, more and more capital kept flowing into these sectors – like a dog chasing his tail. The price advances seem to never end… until the 2016 election cycle event. This caused the entire global equities markets to pause for a few months as Hillary Clinton and Donald Trump battled it out.
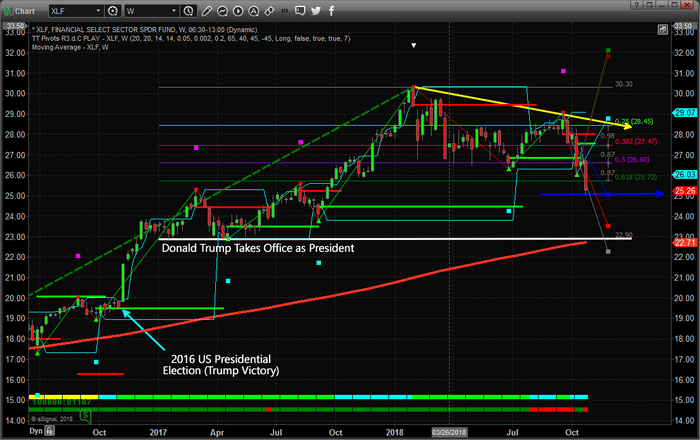
Within this Weekly XLF chart, you can see how quickly after the US presidential election the Financial Sector sprung back to life – rallying nearly 20% within the 6 weeks following the Trump victory. This is a massive move for investors and traders. Skilled traders know to watch for these setups within election cycle events and this is the one reason we are writing this article for you today – to keep you informed that massive trading opportunities exist over the next 3~6+ weeks.
You can also see from this chart that by the time President Trump was sworn into office, the XLF price rotated within a 12~15% range before the new Trump policies and objectives began to be announced (near October 2017). At that time, the Financial sector skyrocketed again by another 35~40% – reaching a peak near $30.60 in January 2018. Pay attention to what we are trying to suggest to you as skilled traders, we are about 7~10 days away from a US mid-term election that will likely present opportunities like this again and we want all of you to understand the huge potential for very big price swings that are setting up right now. The XLF is trading near $25.25 and any upside potential to near recent highs would reflect a 12~15% price increase (or more). Should this mid-term election result in increased fear in the markets and a related price downturn, the nearest support highlighted by the WHITE line on this chart would reflect a -9% price decrease. Either way, up or down, the potential for the Financial sector to generate big gain is already there – waiting for us to execute.
As we stated in Part 1, our predictive modeling systems have been suggesting that a major price bottom formation will setup sometime between November 8 and November 12 and that price will rally throughout the end of 2018 as the Santa Rally kicks into gear again. The recent GDP numbers support this outcome as the US economy is knocking out 3.5~3.8% levels every quarter.
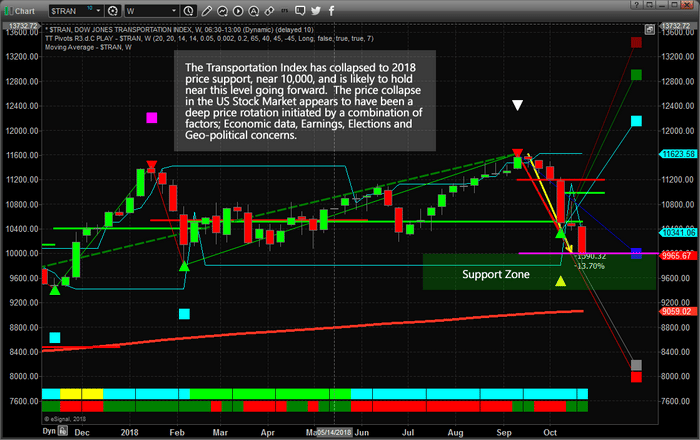
We found the move in the Transportation Index very interesting in terms of relative price analysis. The $TRAN index rotated lower to meet our expected 5~8% targets, then blew past those levels last week to drop to below our BLUE projected Fib extension level – then recover. The recent new low in the $TRAN will set up a new Fibonacci price bottom and will establish new upside price targets as the bottoms forms and price stalls headed into the mid-term elections. We know this will occur as Fibonacci price theory operates on price peaks and valleys and we expect a continued price bottom to form over the next 7 to 10 Daily trading sessions. Once this price low formation is established and confirmed, our price modeling systems will generate new upside projection levels that will help us understand how far and fast price will attempt to move higher.
Major election cycles happen every two years in the US and are real opportunities for skilled traders. The first rule is that you should be very cautious as major election events begin to unfold – such as major Presidential election cycles. Understand that these events can, and often do, sew fear and uncertainty into the markets and could be predicted by some very interesting price swings in commodities, foreign markets, currencies or equities. As the election cycle continues, prepare for the opportunities that will unfold and make sure you watch the commodities, like Gold, Silver, Oil and the US Dollar, for signs of contagion, capitulation, and fear. We believe our September 17th analysis of a price bottom setting up near or before November 12 is still the valid outcome of this election cycle and we believe there will be huge opportunities for skilled traders immediately after this US election event.
Be prepared and don’t miss this chance to really capture some great trading opportunities.
Our predictive modeling systems called this move nearly 4 weeks in advance and now they are calling for a bottom to set up near November 10th and a price rally to resume throughout the rest of 2018. If you want to find out how these incredible tools can help you find and execute better trades, then visit www.TheTechnicalTraders.com to learn more.
Chris Vermeulen
https://thegoldandoilguy.com/wp-content/uploads/2018/10/2-2.png440700adminhttp://www.thegoldandoilguy.com/wp-content/uploads/2014/11/tgaoglogo.pngadmin2018-10-30 13:25:082018-10-30 13:25:08US Elections May Trigger Major Market Bottom – PART II
Almost like clockwork, our research team, at Technical Traders Ltd., predicted on September 17 the US stock market would turn lower and attempt a 5~8% downside move on or after September 21 headed into the US mid-term elections. Our analysis of the potential downside move was related to our price modeling systems expectations that a common predicted downside target existed between -5% and -8%. Our researchers did not believe the markets would fall much below -10% before hammering out a price bottom and finding support.
Today, we wanted to alert you to the fact that we are just 7~10 days away from the US mid-term elections and if our predictions hold true, we will be establishing a price bottom in the US stock markets over the next 5+ trading days and begin a new upside price rally fairly quickly after the election results are known. We could interpret this as “a period of uncertainty that is mixed with economic and news data” which results in investors pulling out of the markets ahead of these types of global events. In all reality, the US elections are really a global event for many investors. Policies, regulations, taxes, objectives, and execution become a very big question for many as these elections take place. Hundreds of billions of dollars are exposed to risk in the weeks headed into US elections and, thus, global investors and traders are always cautious headed into a major US election.
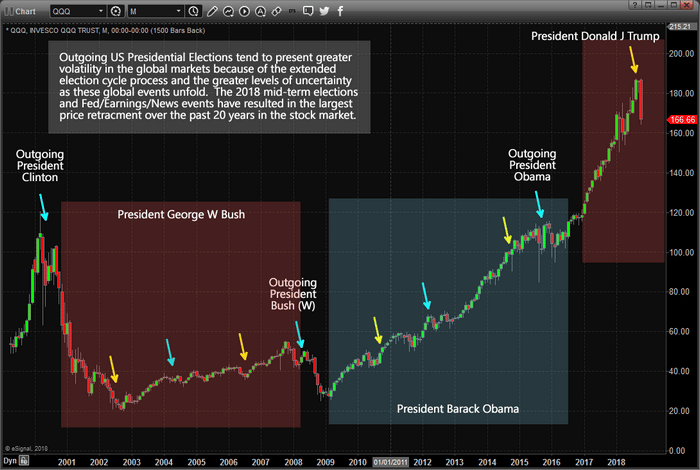
Our theory is that this phenomenon has become even more volatile in recent years and global political ideals have become further polarized. We believe when a sitting US president that has served for two terms is leaving office, far greater volatility enters the global markets typically. We believe that mid-term US elections, depending on the political climate at the time, may or may not reflect in broad global market concerns and volatility. We’ve highlighted major US Presidential elections and US Mid-Term elections on the chart below so you can see how volatility and price rotation increase or decrease depending on the political climate and uncertainty associated with these US elections. We’ve highlighted 6+ months (or longer) before Presidential elections and a few months before mid-term elections.
The current election event, November 6, 2018, is somewhat unique as it also coincides with the US Fed having raised FFR rates considerably over the past 2+ years as well as after a dramatic price increase in the US equities markets following the election of President Donald J. Trump. You can clearly see from the chart below that the QQQ has increased by nearly $80+ over the past two years while that same $80 increase existed over the entire Obama stock market recovery (8 years). This reflects the amount of increased volatility and activity that is within the current global capital market.
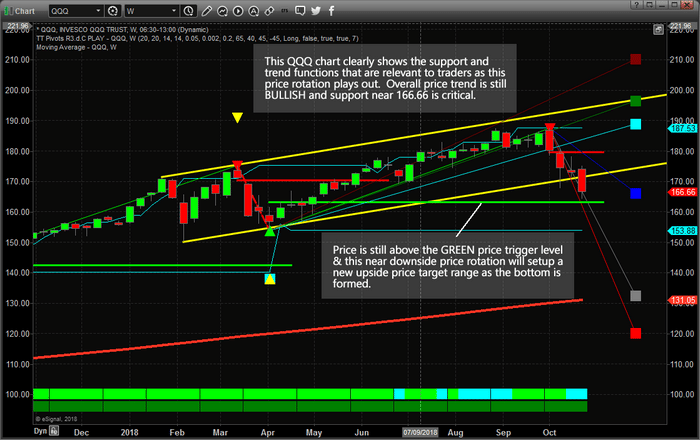
This QQQ Weekly chart highlights what we believe to be the core elements of this election cycle rotation. On this Weekly chart, the overall price trend is still BULLISH (see the DARKER GREEN blocks near the bottom of the chart) and the bullish price trigger level near $163 is still valid. Yes, the shorter term price trend is currently BEARISH and has been so since the week of October 8. You can see the bearish price trigger level near $179 (in red) that was recently breached and the downside price target level (in blue) near $166.
Our expectations from our predictions that the markets would be rotated lower by 5~8% were that the markets would move towards the lower YELLOW price channel level and stall near these levels (or just below these levels). We did not expect the extended price decline that was a result of earnings data and housing data being released last week. We still believe this move has already reached its downside objectives and is in the process of setting up a major bottom formation. We believe the extended move was an emotional price reaction to a hyper-election environment in the US and extended anticipation of caution in the global capital markets.
In the next segment of this research article, we’ll take a look at additional technical, price and modeling systems that support our belief of a major bottom formation setting up in the US equity markets and how election cycle events should be played for success. This current downside price rotation has extended to below our expected levels – much like a deeper “washout low” price formation. We continue to believe the next 7+ trading days will hammer out a bottom formation and that the US equities markets will resume an upside advance shortly after the elections are completed and throughout the remainder of 2018.
Please take a minute to visit www.TheTechnicalTraders.com to learn more about how we help our members find and execute success and how we can help you navigate these market rotations. Our predictive modeling systems called this move nearly 4 weeks in advance and now they are calling for a bottom to set up near November 10th and a price rally to resume throughout the rest of 2018. If you want to find out how these incredible tools can help you find and execute better trades, then visit www.TheTechnicalTraders.com to learn more.
Chris Vermeulen
http://www.thegoldandoilguy.com/wp-content/uploads/2014/11/tgaoglogo.png00adminhttp://www.thegoldandoilguy.com/wp-content/uploads/2014/11/tgaoglogo.pngadmin2018-10-29 12:35:062018-10-29 12:35:06US Elections May Trigger Major Market Bottom – PART 1
Over the past 20+ years of research and trading in the markets, our team of traders and researchers know one thing is certain, when fear hits the global markets, precious metals react by rocketing higher. We’ve seen this happen over and over again – even when non-US geopolitical concerns spark some true fear in the markets.
If you’ve followed our research this week, we’ve been warning about how we believe this move is purely price and technical based and not really a fear-based global price collapse. In other words, our technical systems, price modeling systems, and other advanced price analysis tools are suggesting this move is nearing an end and was likely a function of price rotation and less a function of true fear in the global markets.
Yes, there were a couple of key factors the precipitated this price move; the Fed, Earnings, Housing Data, Trade, and Geopolitical concerns and the US Elections. Yet the biggest concern for traders was the “deja vu” feeling that Housing could present another massive crash near an election. We’ve been through that and we know how ugly that can be if it were to unfold again.
Our researchers, at www.TheTechnicalTraders.com, spent quite a bit of time going over the data and we continue to believe this downside price rotation in the global stock markets was nothing more than a technical price correction WITHOUT any real capitulation from other commodities. If the recent downside price collapse sowed any real fear into investors, then precious metals should have skyrocketed higher over the past 3+ weeks.
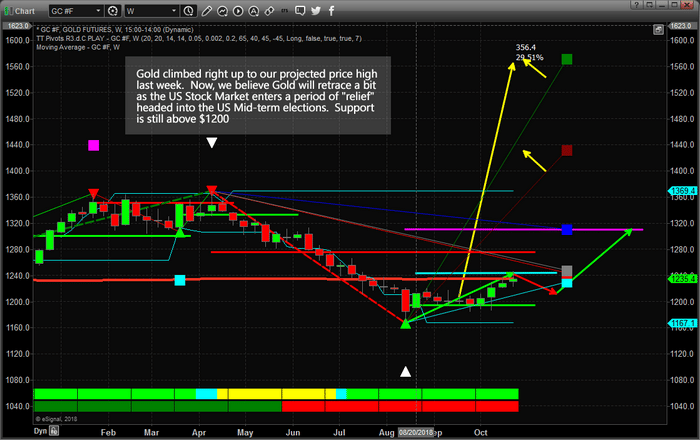
This Weekly Gold chart shows how prices advanced moderately over the past few weeks and failed to originate any real broad upside move as equity prices collapsed. Weeks ago, we predicted Gold would climb to near $1235, the CYAN line on this chart, before weakening to near $1200 again near the US mid-term elections. After the elections, we believe that Gold will begin another price advance toward a price target near $1310 headed into 2019.
The YELLOW arrow showing the massive upside projections are based on our Fibonacci price modeling system and suggest that Gold may ultimately have an upside potential near $1435 or $1565 eventually. These upside targets, if reached, would be the result of REAL FEAR entering the global markets associated with a much greater contagion/capitulation event taking place. This may be something that happens in the future, as some point, but we don’t believe this is taking place now.
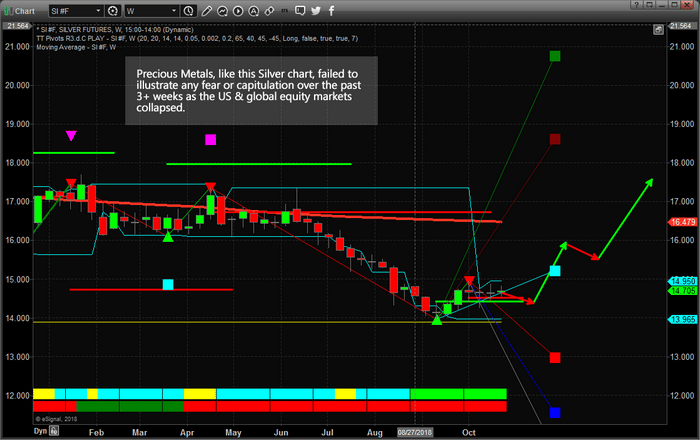
This Weekly Silver chart further illustrates the weakness in the precious metals sector throughout this recent global stock market collapse. The price of Silver actually fell slightly over the past few weeks and stayed near $14.75. A recent double bottom formation in Silver near $13.95 is a very strong indication that Silver is establishing a long-term base near the $14.00 level. You can see from our draws arrows that we believe Silver will continue to contract headed into the US mid-term elections, then begin a moderate advance higher.
We are actively searching for new trades within the precious metals sector that present clear opportunities for our members/subscribers as we believe this upside move in the metals will be one of the best trades in 2019. Although, right now, these trades are “setup trade” in the sense that we don’t expect any true fear to change price at the moment. We do expect investors to continue to look towards the precious metals markets as a form of protection from global events in the future and we believe that when the dam breaks and fear really does enter the markets, traders need to already be positioned within the precious metals sector – not chasing after the move.
Overall, our question still remains valid – where’s the capitulation in the precious metals? If this downside price movement within the global markets was “the top”, we have yet to see any real capitulation in precious metals, which we believe would be the first place to reflect this true fear. Without this capitulation, our researchers continue to believe this is a technical “reversion” move where price is moving lower to re-establish support for another upside price advance.
In conclusion, we do expect moderate price advances in the precious metals sector over the next 4~6+ months. We believe this sector will continue to attract investors as a means of protection against a sudden and more structural price collapse event in the future. Right now, though, we just don’t see the capitulation that would need to be in place if the downside equities move instilled any real fear in traders. It’s just not there – yet. Therefore, this recent downside swing appears to be a capital shift or reversion event where price will quickly attempt to find support, based (headed into the US mid-term elections – as we’ve been suggesting) and begin to move higher after November 12th.
Please visit www.TheTechnicalTraders.com/FreeResearch/ to see all of our recent research posts and to help you understand what our researchers believe is really transpiring within the global markets. Additionally, please visit www.TheTechnicalTraders.com to learn how we can help you find and execute better trades and stay ahead of these market moves. Learn how we help our subscribers by delivering specialized content, video, research, trading signals and more. The next few years are going to be full of fantastic trading opportunities. Now is the time to start to take advantage of these setups and create greater success for your future.
Chris Vermeulen
https://thegoldandoilguy.com/wp-content/uploads/2018/10/1-2.png440700adminhttp://www.thegoldandoilguy.com/wp-content/uploads/2014/11/tgaoglogo.pngadmin2018-10-28 21:16:132018-10-28 21:16:25Where’s the Capitulation in Precious Metals?
Get ready for some crazy price trends in the US markets as investors react to earnings, housing data and overall re-evaluations of future objectives. As we warned on September 17 with this post and on October 1 with this post, we believed the future Q3 earnings weeks and the 2~4 weeks leading into the US Mid-term elections could be very volatile. We even suggested a 5~8% price correction was expected to start after September 21~24.
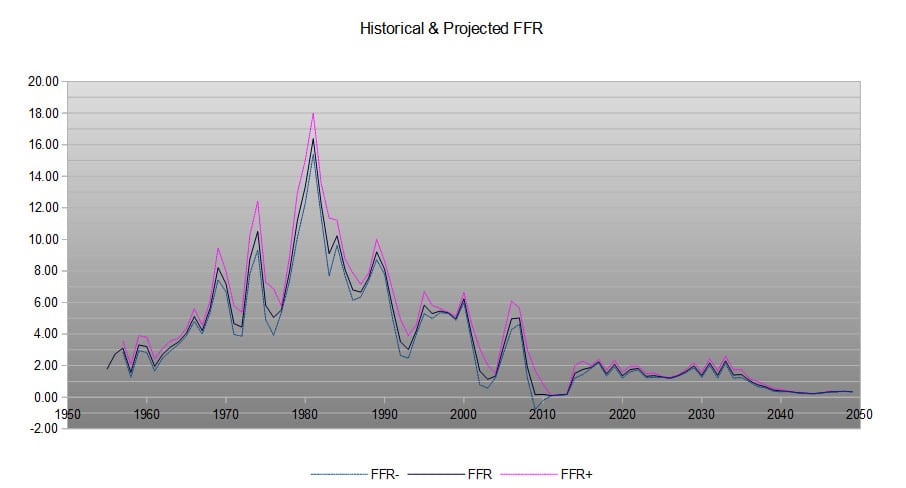
What we did not expect is the Federal Reserve to raise rates, again, on September 26 – just days before the Q3 Earnings season actually started. Our price models for the Fed Funds Rates have suggested that any move above 2% FFR would put pricing pressures on homes and other assets. This research we completed was first published in 2015here. This was the first time we illustrated our Fed Funds Rate Adaptive Learning modeling systems results. The chart within this article that shows that our model expected the US Fed to begin increasing interest rates in 2014~2015 to levels near 0.75~1.25. From that point, a gradual increase towards 2.0 was expected prior to 2018~19. Our price modeling system then expected a decrease in the FFR from 2.0% to between 1.5~1.75%.
The reason our model expected this decrease in the FFR near current time is because the balance between growth of asset values, credit expansion and consumer’s ability to navigate efficiently within these constructs becomes very constrained above 2%. In other words, as soon as the US Fed raising rates above 2%, they risk blowing holes in the economic recovery simply because it will outpace consumers ability to borrow and repay in an efficient manner.
We continue to believe this is the root of what is transpiring in the US Equity markets currently as a crush or reality has hit traders and investors as the housing, trade, Fed and other data is hitting the news wires. So far, the earnings release have not been anything but a success when you look at the real data. Nearly 75%+ of the total earnings announced as I write this post have been positive. Yet, the markets collapsed on news related data and home sales data. With more of this data streamed into the news cycle, we can only expect one thing to happen – a continued washout or price near recent lows or slightly lower as investors continue to digest this data and react to perceived weakness.
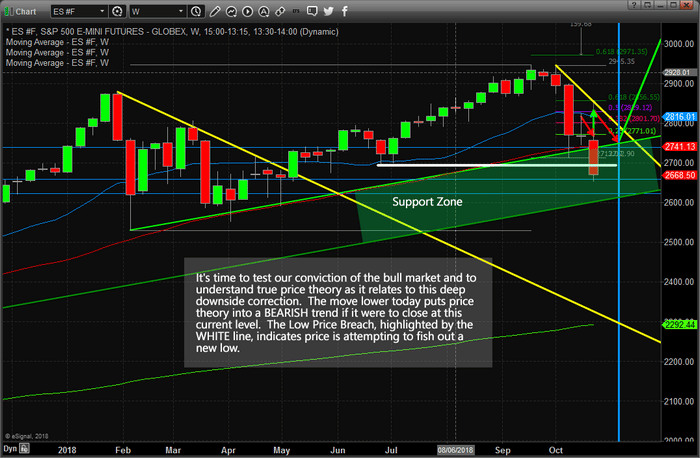
We urge you to understand the longer-term perspective of the markets and to understand true price theory as it relates to actual price highs and lows. Right now, all indications are that we have entered a deeper price correction that has initiated an intermediate term bearish trend. As of the close of Wednesday, Oct 24, price has breached recent critical price lows that has initiated this new intermediate bearish price trend. If price can’t recover above these levels before the end of this week, then we will have a confirmed intermediate bearish price trend. Yet, the ultimate low from February 2018 is still active as key support and a key price level that would need to be breached before we could call this a “new bear market trend”. Right now this is just a price correction – yes, a DEEP price correction. Those February 2018 lows are the ultimate test for a new bearish trend to setup.
This Weekly ES chart, below, helps to put everything into perspective in terms of what we are actually seeing transpire in the markets. If you have been following our analysis, we’ve called for the markets to move lower heading into a November 8~12 ultimate price bottom before turning around and heading much higher throughout the end of this year and early into 2019. The GREEN support zone is part of our key analysis that support our belief that this is nothing more than a very deep “washout low” price rotation happening right now. The WHITE line on this chart shows the key price lows that are currently at risk in traditional price theory rotation. A breach of that White line by the end of this week would indicate that we could see much further downside price movement – possibly to test the lower Support Zone level. Beyond this analysis, the ultimate price low that is holding us back from calling this a “new bearish trend” is that February 2018 price low near 2529.75. As long as price stays above that level, the overall bullish price trend is still in place.
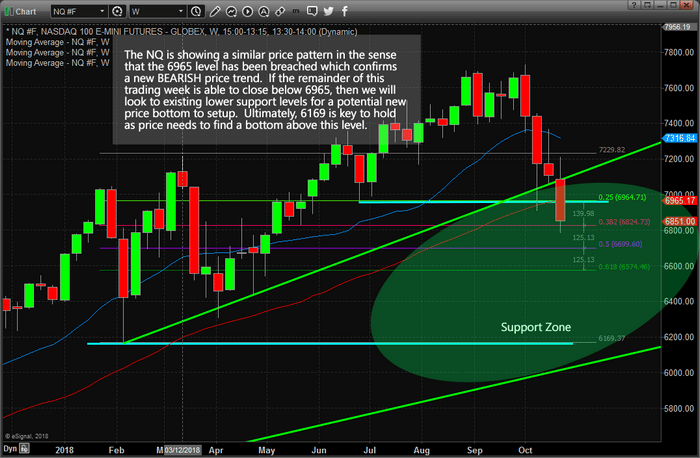
This Weekly NQ chart helps to understand how the deeper NASDAQ price rotation has played out and where the true support and critical price levels are located. The Support Zone in the NQ is much larger than in the ES. This is because the price expansion in the NQ has been much greater than in the ES – thus, the range between current and long-term support is greater. Additionally, we have critical price lows from February 2018 near $6164. Although the recent price moves lower have seemed massive and a crisis like event, we are talking about 10.5% downside correction. To give that some perspective, the correction in March 2018 in the NQ was a total of about -11.5%. The price correction near the end of 2015~2016 in the NQ was about -18%. The price correction near the end of 2012 in the NQ was a total of about -13%. Want to know what happened after all of these various deeper price corrections – the market moved MUCH HIGHER.
Please pay attention to our research and our predictive modeling systems. Skilled traders attempt to find opportunities in any market condition and execute for success no matter what the markets are doing. Keeping a calm and rational head through all of this is critical to being able to achieve success.
Visit www.TheTechnicalTraders.com to understand how we help our members navigate these markets move and find success each day. Remember, these huge moves create incredible opportunities for skilled traders. Visit www.TheTechnicalTraders.com/FreeResearch/ to read all of our research posts and learn why we are still bullish going forward.
Chris Vermeulen
https://thegoldandoilguy.com/wp-content/uploads/2018/10/3.png458700adminhttp://www.thegoldandoilguy.com/wp-content/uploads/2014/11/tgaoglogo.pngadmin2018-10-24 22:34:312018-10-24 22:34:31Batten Down The Hatches, Mates!
We have been following the news cycles for many months regarding the prognosticators that believe “the sky is falling” in the global markets and we find it interesting to see how quickly the bulls turn to bears when the market rotates 4~5% or more. The reality is that in traditional market price rotation, a 3~5% market price rotation is a very healthy component of price advance or price declines.
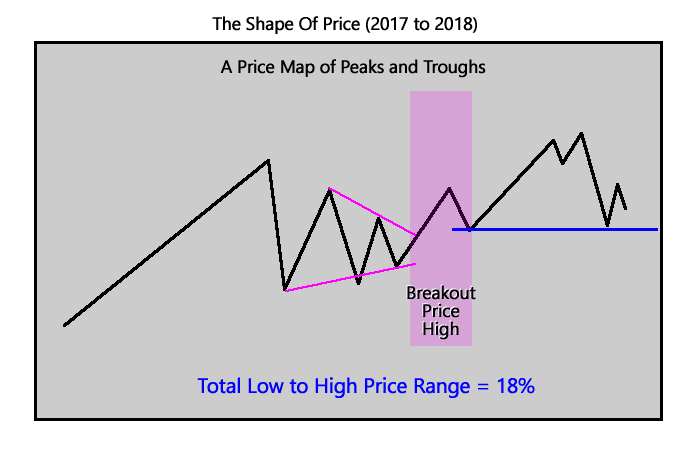
When we consider the price swings within the SPY from early 2017 till now, we are looking at a total of at least 18% total Low to High price swings with a number of large 6~8% price rotations and many 2~4% smaller price rotations. The natural rotation of price, as Fibonacci price theory teaches, is that price will always attempt to establish a new higher high or lower low in the process of extended trends. This means that price is always attempting to find and establish some new price high or low by rotating/trending within existing/past high or low price levels.
This is fairly obvious to see in the chart, above, where the initial downside price rotation in February 2018 established the deeper price low. This low price level was still higher than the previous price low on the left edge of this chart. As you can see, after the February 2018 price low, price continued to rotate in an attempt to establish a new “price high” or “price low” beyond the existing highest and lowest price levels. It failed many time to accomplish this new price high or low and, in doing so, continued to rotate within a narrower price range. Until…
May 2018 price pushed above the most recent price high channels and established a NEW Breakout Price High. This established the price trend as Bullish again and began a normal type of price rotation higher. In the process, it established a number of price lows that we can use as reference points for prior support and for our analysis of Fibonacci Price Theory as it relates to this current price move lower.
Getting to the current price charts and trying to make sense of the Fibonacci Price Theory example, above, is something we all need to pay attention to. Understanding price theory is only one component of the overall analysis process. There are many aspects to technical analysis and one of the most important is to understand how price operate within a global environment – the global economy. Price becomes a variant of many aspects of the global economic environment and is continually related to various external factors of the global economy and the perceptions of traders/investors. Putting it in simple terms, price becomes a factor of “whatever price investors are willing to pay for the safety and security of any type of various investment instruments OR whatever price investors are willing to sell at for the safety and security of exiting any type of various investment instruments”.
Keeping all of this in mind, remember that the US Equity market is, in our opinion, the leading capital market and investment destination on the planet right now. There is no other source as big, as varied, as capable and as liquid as the US Equities and Capital markets.
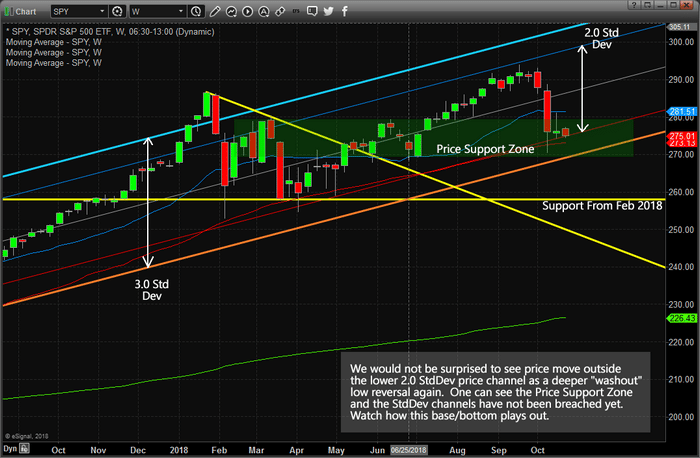
This Weekly SPY chart highlights a few key elements of the current price swings and one key element which is the Standard Deviation channels. Within this chart, we’ve drawn two Standard Deviation Channels that originate on November 8, 2016, and continue through today – a 2.0 StdDev channel and a 3.0 StdDev channel. The purpose of showing you these channel ranges and levels is to more clearly illustrate the type and level of current price rotation that we are seeing in the US Markets. The current price rotation originated near the top of the 2.0 StdDev channel and rotated to near the low of the 2.0 StdDev channel. In relative terms, this is nothing more than a common price rotation that has yet to extend beyond normal rotational channels.
Support from the February 2018 price rotation and what we call the “Price Support Zone” are still intact and active as core elements of current price support. In other words, the price would have to fall below $259.00 before we would be concerned with any massive Fibonacci Price Theory price reversal.
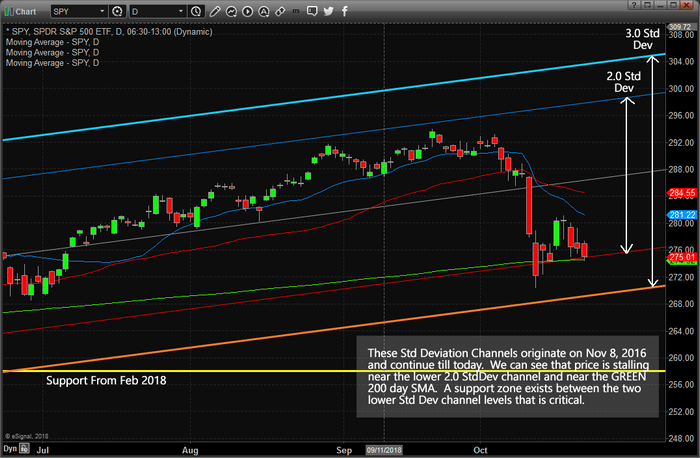
This SPY Daily chart shows the same Standard Deviation channels and the Support from Feb 2018 as key elements of this chart. The importance of this chart is to understand that the current lows, near $270 (or the lower 3.0 StdDev channel) are the low price level that acts as massive support for this potential bottom. Should price break below this level, then the $259 level becomes our next target and we could assume price has entered a short-term bearish mode.
Right now, we believe the bearish price trend will end near this support level and will soon begin an upward price move very similar to what happened after the February 2018 lows were established. Volatility is high right now and the price will rotate to establish new high and low price levels just like we saw on the first chart of this article. Eventually, price will consolidate and break to one side or the other. Our modeling systems suggest the breakout move will be to the upside again.
Playing this move with skill and understanding of price theory and dynamics can allow you to identify and execute incredibly profitable trades throughout this price rotation. Don’t be fooled by the news cycle content. Expect price to rotate within a 3~4% range for the next few weeks while volatility decreases and price range decreases. Near November 8 ~ 12, we expect an ultimate price bottom that will likely be the start of a new Bullish price trend and result in a new Breakout move to the upside. Nothing, so far, is unusual in terms of price rotation. Be smart and take advantage of these price setups while you can.
If you want to learn about what we do and how we help our members find greater success, please visit www.TheTechnicalTraders.com to learn more. We pride ourselves on being ahead of these market moves and helping our members find and execute trades for greater success. We called this downside market move over 3 weeks before it happened and you can read how we did it by visiting www.TheTechnicalTraders.com/FreeResearch/. Please take a minute to see if our services and tools can help you create greater success in 2019 and beyond.

 This is fairly obvious to see in the chart, above, where the initial downside price rotation in February 2018 established the deeper price low. This low price level was still higher than the previous price low on the left edge of this chart. As you can see, after the February 2018 price low, price continued to rotate in an attempt to establish a new “price high” or “price low” beyond the existing highest and lowest price levels. It failed many time to accomplish this new price high or low and, in doing so, continued to rotate within a narrower price range. Until…