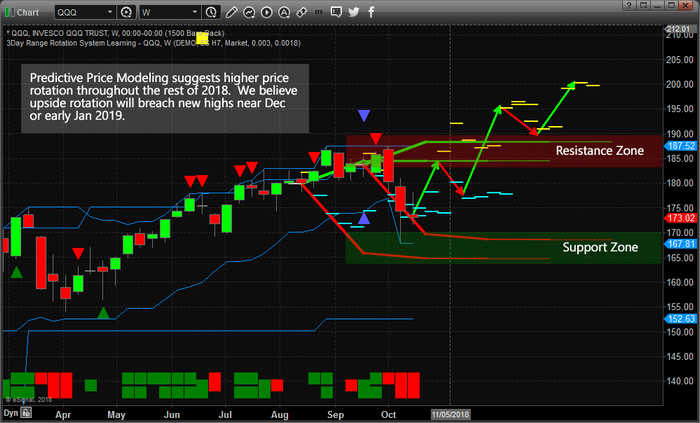
Our proprietary adaptive learning tools, specifically our adaptive predictive price modeling tool, is clearly illustrating higher price rotation over the next few weeks with a strong potential that the US equities markets will break to be all-time highs near Dec 2018 or early 2019.
Our research team has spent more than a decade studying the markets and developing specialized tools to assist us in understanding current and future price activities. This one tool, the Adaptive Dynamic Learning (ADL) Price Modeling system is one of the more dynamic tools we have ever created. We can ask it what it believes is the highest probability future outcome many weeks, months or years in advance. Today, we are sharing with you what we believe will be a strong upside price rotation to close out 2018 and lead into 2019.
This QQQ Weekly chart shows two data points of our ADL price modeling system. The reason we asked for these two points of analysis is that we attempt to identify aligning price analysis when using this tool. In other words, when the analysis aligns well in multiple instances, we believe the outcome to be more sustainable going forward. In this instance, data points originating from August 13 and September 17 clearly highlighted the downside rotation in early October and suggest we could see another 2 to 4 weeks of price rotation near the “Support Zone”. These ADL predictive levels also align well with our suggestion that a November 8 ~ 12 ultimate price bottom will set up. After that, we still believe the markets will enter a rally mode that could present a 10% to 12% upside move well above recent highs – breaking through the Resistance Zone quickly.
The one concern we have regarding this future price prediction is that out modeling systems are showing the Precious Metals are also setting up for a bigger move and that allows us to understand some of the dynamics that are at play in the markets. If the metals begin to move higher while the US Equities markets also move higher, it would indicate a moderately strong “capital shift towards safety and away from risk” is taking place. Thus, the US equities markets and Precious Metals would BOTH be moving higher at the same time. We believe this could be an event that puts additional pressures on the Emerging Markets, Oil, Foreign Currencies and other commodities while the US Dollar continues to maintain overall strength.
We’ll know more in early 2019. Right now, we can tell you that our modeling systems are suggesting “the bottom is in” and that we should be expecting upside price rotation throughout the rest of 2018.
Please take a minute to learn more about what we do and how we can assist you in finding and executing better trades. Visit www.TheTechnicalTraders.com to learn more about our team, our tools, and our services. Isn’t it time you invested in your future success?
Chris Vermeulen
https://thegoldandoilguy.com/wp-content/uploads/2018/10/Chart_18-10-21_ADL_QQQ_W.png423700adminhttp://www.thegoldandoilguy.com/wp-content/uploads/2014/11/tgaoglogo.pngadmin2018-10-21 23:03:312018-10-21 23:03:31Predictive Price Modeling Shows New Price Highs Are Imminent
The recent downside price rotation in the US Equities markets has been a blessing for skilled traders. The opportunities for profits are setting up all over the markets – you just have to look for them and understand price theory.
The Small Cap ETF, TNA, is setting up a nearly perfect example of a quick in and out trade for a potential profit of 8% to 15% or more. We understand the fear that many traders may have in the markets right now and we understand the reason why many experienced traders decide to sit on the sidelines while these types of moves play out. Yet, we believe the opportunities that exist while these volatile market moves are playing out are some of the best setups for experienced and skilled traders.
Typically, volatility may only be only 20% or 30% of the current volatility on average trading days. In other words, you might be waiting 3x to 4x (or more) longer for the same types of price swings to occur. If the opportunity presents itself and you have the skills and understanding to dissect the trade, why not take the opportunity for these great, quick moves?
Let’s take a look at the TNA setup
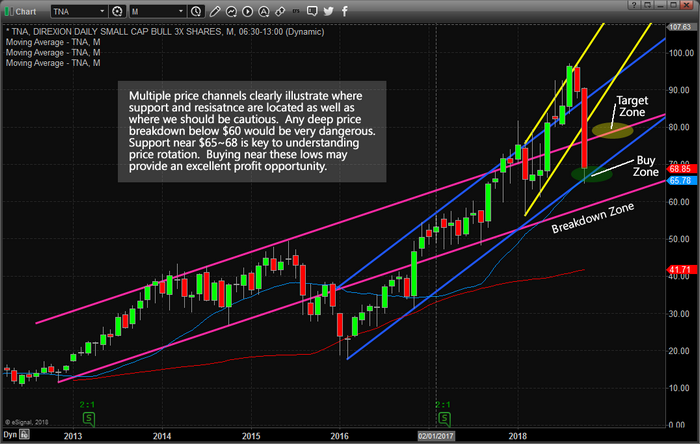
This Monthly TNA chart illustrates the Price Channels that our research team has suggested present the opportunities for this LONG trade setup. Our research team believes the primary BLUE price channel is acting as support for the current price near $65~70. As long as this lower price channel holds, then the potential for an upside price reversal towards $78~80 is rather strong. The MAGENTA target level is price resistance from 2013~2015 and would be an immediate price target for any relief rally from these lows. The Breakdown Zone is where we want to alert our followers to be cautious. If the price does not rally and falls below the Breakdown Zone, this trade is invalid.
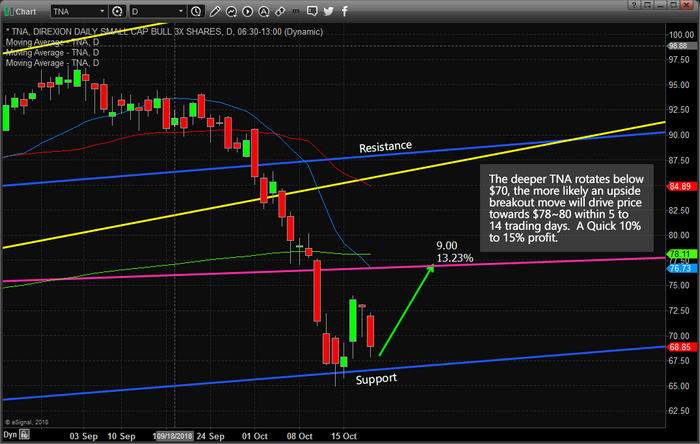
This TNA Daily chart more clearly illustrates the trade setup that is currently setting up. The relief rally on Tuesday, October 15, rallied to near $74 from lows near $65. This type of price rotation establishes a price range and shows us what is capable if the price were to enter a rally mode. Again, the MAGENTA level is our immediate price target for any new long trades near these lows. Our opinion is that any new long entries below $70 are sufficient for most skilled traders and, of course, waiting for deeper price entries could be very advantageous.
Don’t get greedy with this one just yet. We still believe the price will rotate lower after reaching near the target zone and form a major price bottom near November 8~12. Think of this as a scalping trade. Once you have entered your long position, any price level above $75 is sufficient to call this one a “solid winner”.
We continue to deliver superior results to our subscribers and members. We hope you are enjoying our free research articles and are able to gain insight and understanding of our work, research, passions for the markets and willingness to share our knowledge. If you find our work helps your trading, then take a minute to really see what we offer our subscribers by visiting www.TheTechnicalTraders.com. Consider trying our services for a three month period to see how we can help you stay ahead of these moves and find greater profits. If you want to read more about our detailed market research, please visit www.TheTechnicalTraders.com/FreeResearch/
Chris Vermeulen
https://thegoldandoilguy.com/wp-content/uploads/2018/10/2-1.png444700adminhttp://www.thegoldandoilguy.com/wp-content/uploads/2014/11/tgaoglogo.pngadmin2018-10-19 21:12:032018-10-19 21:12:36Skilled Traders Can Find Profits In Small Caps
Our research team was hard at work over the past few days. Not only were they able to call this downside price swing 3+ weeks in advance, they also called the market bottom within 0.5% of the absolute lows. Now, they have put together a suggested “map” of what to expect in regards to price rotation, support, resistance and the eventual price breakout that we are expecting to happen near or after November 8~12. Today, we are sharing this detailed map with all of our followers.
Our research team, at www.TheTechnicalTraders.com, have honed their skills over the past few decades by studying market correlations, price relationships, advanced price modeling and more. Our objective is to be able to identify price patterns, opportunities, and setups while attempting to accurately predict the future of price so that we can keep our followers and members uniquely aware of future opportunities. As you can imagine, it is not an easy job and we often take heat for some of our research posts.
Today, we are sticking out neck out (again) and attempting to predict the future of the ES price rotation as this deeper rotation continues to play out. Our research team believes it has identified key price levels and dates/times that are relevant to this future price rotation. By no means is this research set in stone in regards to exact dates/times. These are suggestions which we believe to be accurate based on our research and analysis of the markets. Use them as guides to how this price rotation plays out.
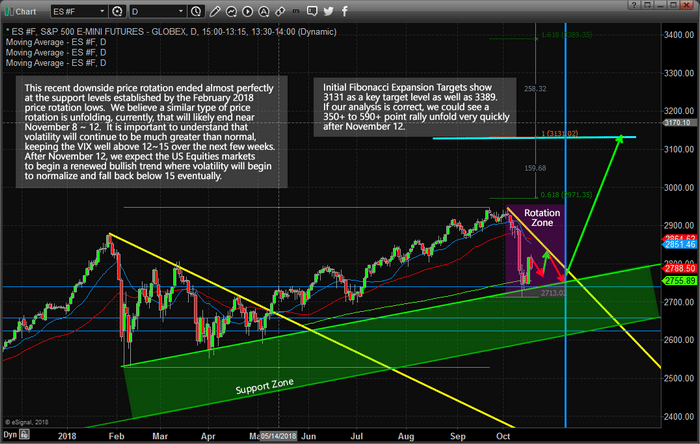
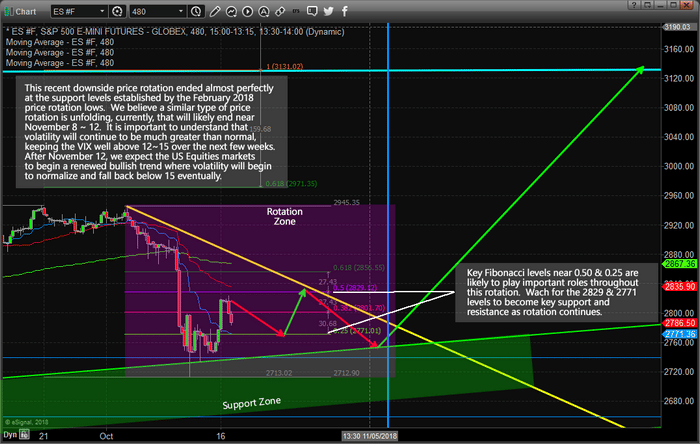
This first chart is a Daily ES chart that shows three very important components of the current market price rotation.
_ The Support Zone below the recent lows is actually very critical to the true understanding of price rotation. As long as this support zone is not completely breached, prices should continue to push higher overall.
_ The Rotation Zone is where we believe the price will continue to consolidate within a fairly tight range before the November 8 ~ 12 bottom sets up. Volatility will continue to be greater than normal throughout this Rotation Zone.
_ The post-November 8 ~12 breakout is likely to attempt to target 3131 initially (a Fibonacci extension target) and we believe this move higher could explode fairly quickly.
Now that we have explained the general sense of our research, let’s dig into the numbers a bit.
Our expectation is that a price peak will occur near early morning trading on October 26 (morning session in NY). We believe this peak will end near 2830 (a Fibonacci 50% retracement level) and we believe an extended basing pattern will precede this price peak. The extended basing pattern, which is expected to end near 2770 (a Fibonacci 25% retracement level) is already starting to form and should last from now until near October 23 or 24. We believe the upside move between the end of the basing pattern and the October 26th peak will be very fast and end fairly quickly – so be prepared.
The October 26 price peak will set up a very important component of our final analysis – the peak-to-peak price channel (highlighted in YELLOW now) and will allow us to determine when and where price volatility predicts the breakout move to occur. Our research team believes another bout of extended basing will occur after the October 26th peak that will likely push just below the 2771 support levels (to near 2750) retesting the Support Zone and presenting a “false low price breakout” pattern that may sucker many longs out of the market (and potentially set up massive short seller pressures in the market). This move may be critical to the eventual upside breakout that we are predicting.
Think of it like this, Fibonacci price theory suggests that price MUST attempt to establish new higher high prices or lower low prices at all times. Failure to accomplish these new price levels results in a consolidating/congesting price trend that typically forms as Pennants or Flags in price. Near the Apex of these pennant/flag formations, false breakouts (or what we call “washout lows or highs”) are common. These are price functions that operate as a “shakeout move” where price searches for direction and where buyers and sellers are stacked on top of one another attempting to ride the next wave. Price MUST attempt to establish a new higher high or lower low – so it must attempt to rally up and break the 2945 level or it must selloff ant attempt to break the 2712 level. We expect extreme volatility near or after the November 8~12 apex setup. Price could fall deep into the Support Zone before reversing higher with a bigger rally that attempts to run well above the 2945 level.
The vertical blue line is the November 8 date where we expect the absolute bottom to form and where we expect the next big price rally to initiate. Near after this date, we expect the price to rotate with greater volatility and attempt an upside breakout move near or after November 12. The key Fibonacci levels at 2771 & 2829 are certain to become key price rotation levels near this November 8 ~ 12 price breakout.
At this point, we have outlined some very detailed and structured price rotation levels that should clearly help you understand what is transpiring within the US Equities markets right now. If you take only one thing away from reading this article, please understand the Support Zone that we’ve highlighted on our charts is super-critical to the ability for the US Equities markets to continue to push higher. If this level is completely breached by lower prices (prices falling all the way below these price channels on the Daily chart, above), then our predictions of price rotation, extended basing and an ultimate upside price breakout are invalid. This Support Zone MUST hold for our analysis to become valid.
This level of research and understanding as related to technical and price analysis is not something one stumbles upon blindly. This takes years of study, practice, research, and understanding to be able to “see into the future” as we do. Sure, anyone that understands basic trend lines and Fibonacci concepts can draw some lines on a chart – but their overall success rate will quickly illustrate their true understanding of the markets. Take a minute to visit Technical Traders Ltd. website and read some of our recent research posts and pay attention to how we accurately predicted a 5~8% price correction 3+ weeks before this recent move happened. Ask yourself, how did we know it was going to happen and how did we know it would stop near 2700? Visit www.TheTechnicalTraders.com/FreeResearch/to read all of our recent research posts or read how we predicted this downside price move by clicking here: https://www.thetechnicaltraders.com/predictive-trading-model-suggests-falling-stock-prices-us-elections/
Chris Vermeulen
https://thegoldandoilguy.com/wp-content/uploads/2018/10/1.png444700adminhttp://www.thegoldandoilguy.com/wp-content/uploads/2014/11/tgaoglogo.pngadmin2018-10-17 22:34:562018-10-17 22:34:56Detailed Map Of Expected Price Movement Before The Breakout
https://thegoldandoilguy.com/wp-content/uploads/2018/10/trump-fed.jpeg444600adminhttp://www.thegoldandoilguy.com/wp-content/uploads/2014/11/tgaoglogo.pngadmin2018-10-17 22:23:222018-10-17 22:23:22Trump: The Federal Reserve is my Biggest Threat
As fast as the downside breakout occurred, the upside recovery appears to be taking place as Q3 Earnings begin to hit the news wires. This past weekend, the news cycles and market experts all seemed to have opinions about where the US equities market was headed after last week’s price collapse. We’ve read everything from warnings of a $20 trillion dollar collapse to seeing Bloomberg’s SMART INDEX chart showing equity valuations are near historic market bottoms. It seems everyone wanted to get out and share their opinions – I guess we are no different.
The facts still remain the same, until the global market dynamics change and the US equities markets break the defined price channels that have been well established, we do not see any reason to consider a 6~8% correction life-threatening. In the total scope of the price range, this move represents less than a 25% price correction from price rotation points (as you’ll see on the longer term NQ chart below). Yes, eventually, some critical market event might cause the US equity markets to change direction, but until then stay safe and roll in and out of trades with skill.
Our research team, at Technical Traders Ltd., has continued to stay on top of this move by predicting the downside move over 3 weeks before it happened and by calling the bottom near 2700 on the ES. Recently, we posted two articles regarding the Q3 earnings expectations and the longer term price channels that are defining this current move. We suggest you visit www.TheTechnicalTraders.com to read our most recent research posts.
The recent upside price swing in the US Equities markets should not have been a surprise if you had been following our analysis and research. These types of price rotation are actually very healthy for the price and allows the price to establish support, wash out a few weaker positions and allows skilled traders to position themselves for future success.
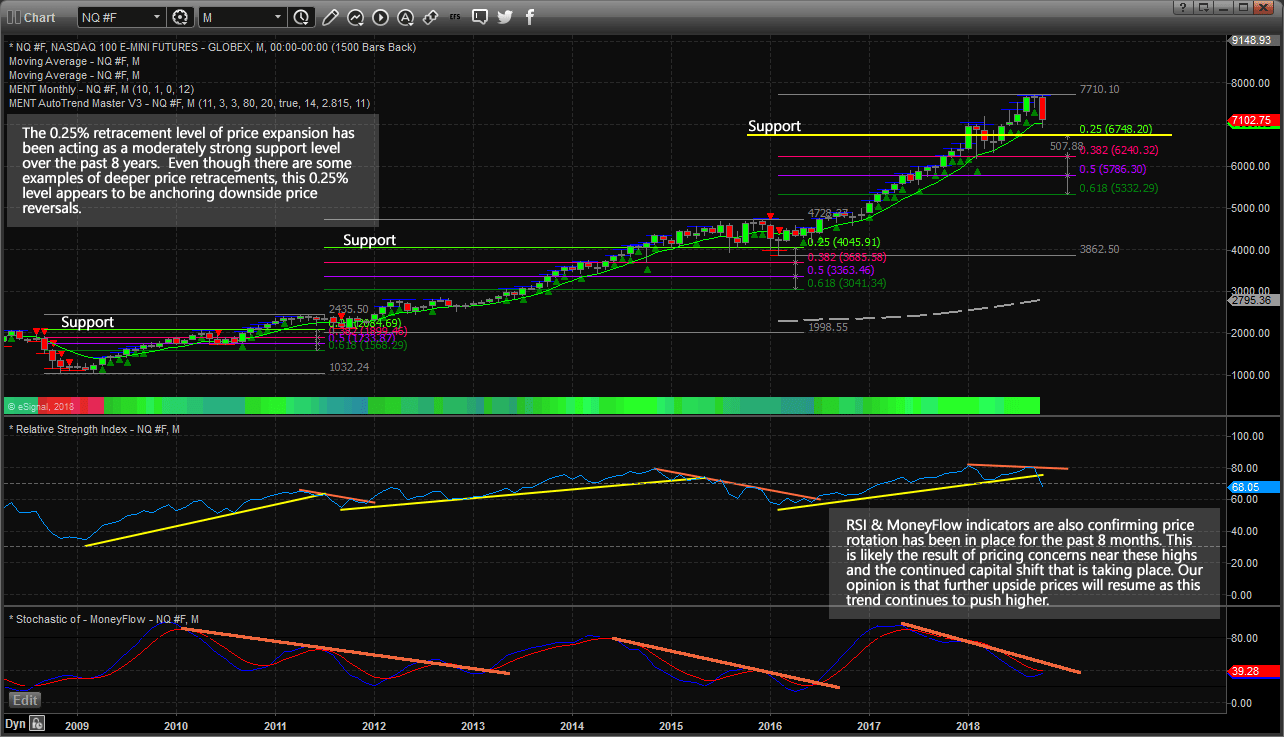
This Monthly NQ chart shows you what our research team has identified as a price pattern going back 8+ years. Since the 2009-10 bottom in the markets, price rotation has been limited to about 0.25% total retracements for each upward price range. This is interesting in the sense that rotation is occurring in price, but it has historically been somewhat limited to within the 0.25% range. This also suggests that as price continues to climb and expand, the 0.25% retracement range is also expanding.
Still, until we see a deeper price retracement that clearly breaches support channels and confirms a downside move, we don’t believe any real danger exists to the downside. We have advised our members appropriately to watch for this move and protect their open long positions as this downside setup was identified by our team over 4 weeks ago. Now, we are advising our members to take advantage of strategic opportunities in selected symbols because of what our predictive modeling systems are suggesting.
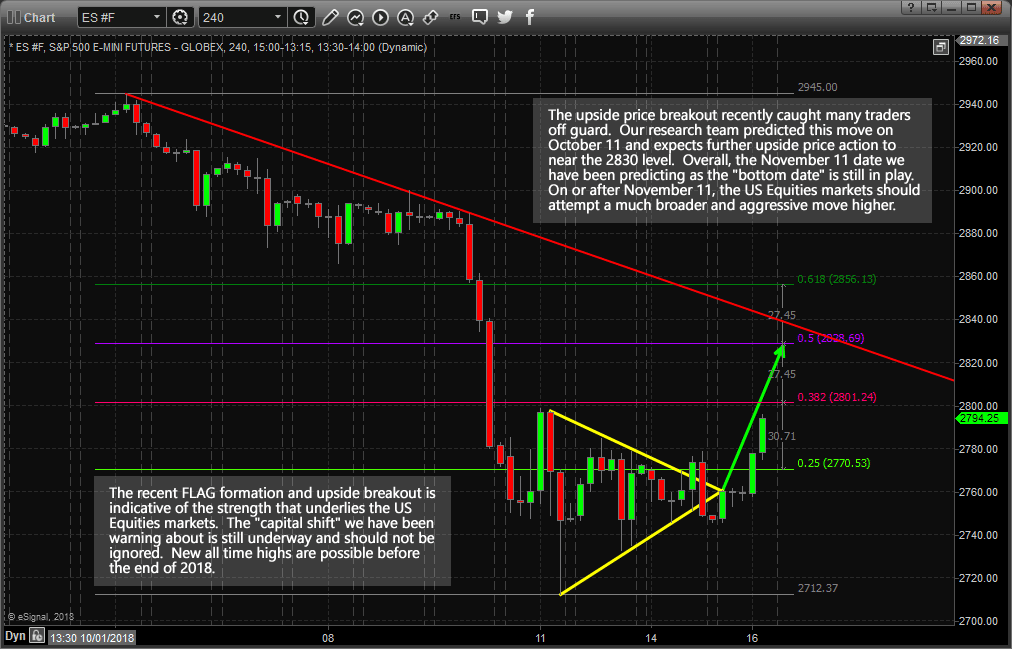
This 240 minute ES chart shows the recent upside breakout of the FLAG/Pennant formation near the support levels (2733~2744). These levels were identified by our research team shortly after the bottom had formed and allowed us to understand that as long as price stayed above these levels, an upside price breakout was the strongest possibility. The “washout” price rotation near the apex of the FLAG formation was expected as well. Our team believes the upside price move is just starting and that price will move to near 2830 before stalling and potentially retracing back to near 2785. Remember, our research shows that a true price bottom will not form in the US markets will somewhere near November 8~12. Somewhere near these dates, the US Equities market should form a very solid price bottom and begin to really accelerate to the upside throughout the end of 2018.
We’ve already positioned our subscribers to effectively profit from the future moves we expect in the markets. Our predictive modeling systems are showing us what is the highest probability outcomes and our job is to keep our subscribers well informed and ahead of these moves. We urge you to spend a bit of time reviewing our most recent research posts to better understand the current market environment: visit www.TheTechnicalTraders.com/FreeMarketResearch/ to access all of our public research posts. The Christmas rally should be setting up very quickly and this Q3 earnings season is likely to present some very good trading opportunities. Get ready for 2019 by following our research and staying ahead of these market moves instead of following along after the moves have taken place.
Chris Vermeulen
https://thegoldandoilguy.com/wp-content/uploads/2018/10/2.png6491012adminhttp://www.thegoldandoilguy.com/wp-content/uploads/2014/11/tgaoglogo.pngadmin2018-10-16 15:58:112018-10-16 15:58:11US Equities Mount Impressive Early Recovery
There has been quite a bit of chatter about the FANG stocks recently. In fact, the entire Technology Sector has taken a beating over the past 30+ days. Our research team, at Technical Traders Ltd., believes the Technology sector is setting up for a 15%+ price rebound from these recent lows and we want to alert our followers to be prepared for this move.
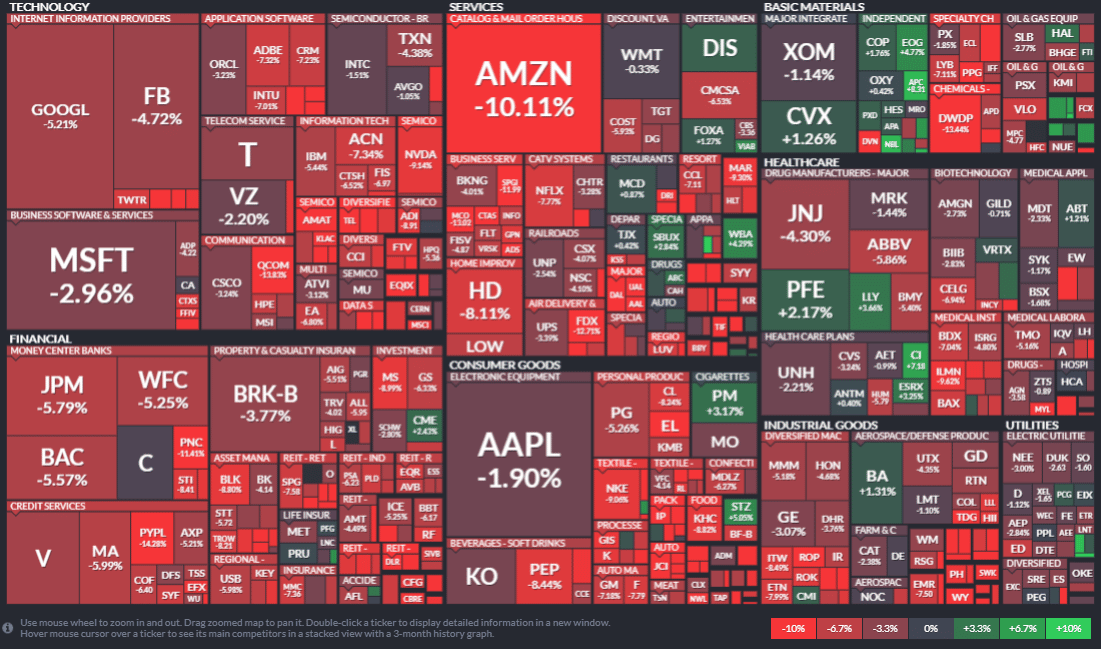
Let’s start by taking a look at a 1 Month S&P Heat Map showing just how distressed certain sectors are in terms of price valuations. The Brighter Red highlighted symbols represent a price decrease of at least -6.7% to well above -10% over the past 30 days. It is pretty easy to see the entire Technology, Technology Services, Financial, and Consumer Goods sectors are all under some pricing pressure. What interests us is we call the “capital shift” that has been taking place over the past 4+ years.
We have authored research posts suggesting that a global capital shift has been taking place on the back of multiple global QE attempts to support the global economies. The premise of our theory is that capital is constantly seeking the safest locations to be deployed with the highest potential for returns. Prior to the US Fed raising interest rates over the past 14+ months, the US Real Estate market was a perfect example of this shift in capital. Additionally, over the past 3+ years, the US Technology sector has been another great example of this shift in capital. As the Emerging Market boob cycle went bust, capital went in search of better targets. As the Oil market went bust, resulting in currency pricing pressures, capital continued to search out the best, most stable, investments and growth opportunities. Our opinion is most of that capital found its way into the US stock market (into technology, biotech, finance, and healthcare).
We believe this capital shift is now under pressure across the globe to identify and execute for longer-term returns and we believe the recent price rotation in the US Equities markets may give this capital further incentive to redeploy into the US Equities market.
Capital MUST find suitable locations for growth, protection, and healthy longer-term returns. One can’t simply keep moving billions of dollars of capital around to various investments every few weeks. Currency concerns are constantly a worry for global investors. Placing your capital into the wrong investment could result in a net loss because currency valuations may destroy your trading profits if you are not cautious. Global concerns regarding the Arab nations, oil production, Asia/China trade/economic issues and the never-ending European Union issues really only leave one location on the planet that is somewhat immune from extended risk – the US Equities market.
Our research team believes this recent price rotation will turn into an excellent buying opportunity for select sectors over the next 60+ days. The trick to being successful with this move is the proper timing of the trades. If you really want to know when is the best time to pull the trigger, then you really want to follow our research and consider joining our other member/subscribers because we provide them with much more detail than is included in these public posts. Still, we believe the charts are screaming at us to consider the longer term “capital shift” that is taking place and to understand the true nature of price – it always seeks out new highs or new lows and capital is always seeking the best returns in the safest environment (away from extreme risk).
Take a look at these charts.
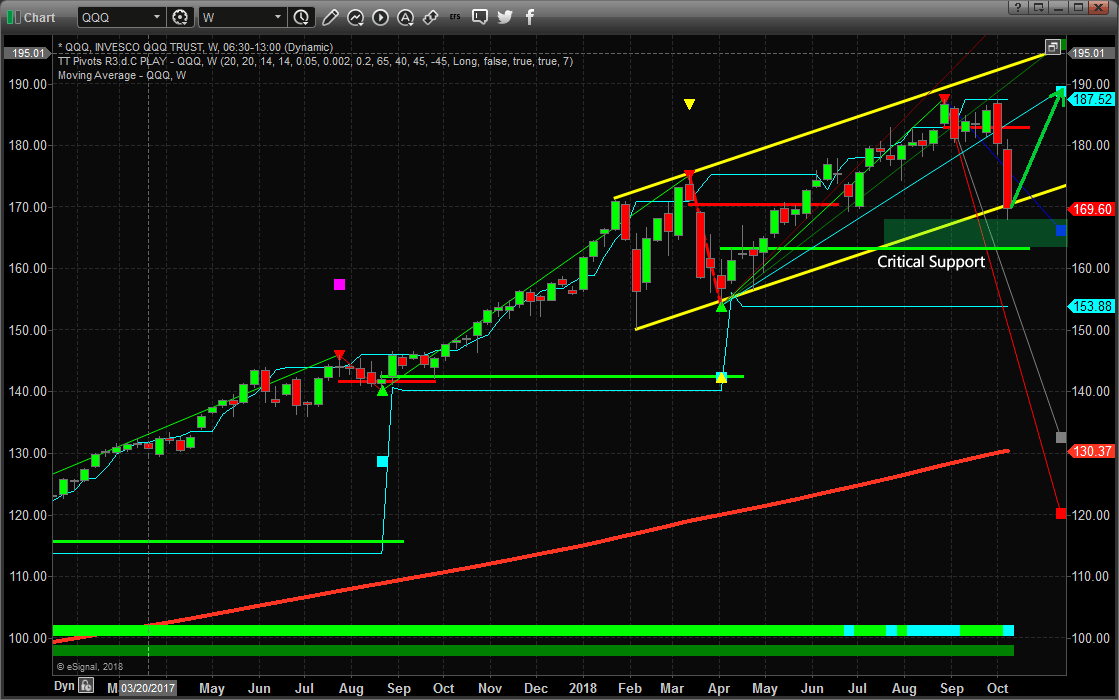
First, the Weekly QQQ. The price channel is clear. The Support level is clear. The lows of February 2018 are the critical price levels that we want to be concerned with. The current price rotation falls to just below the lower YELLOW price channel and stalls. As long as our critical support level is not breached, the QQQ should set up an extended, yet volatile, price bottom before the end of this year and begin to rally back up toward the $190 price level.
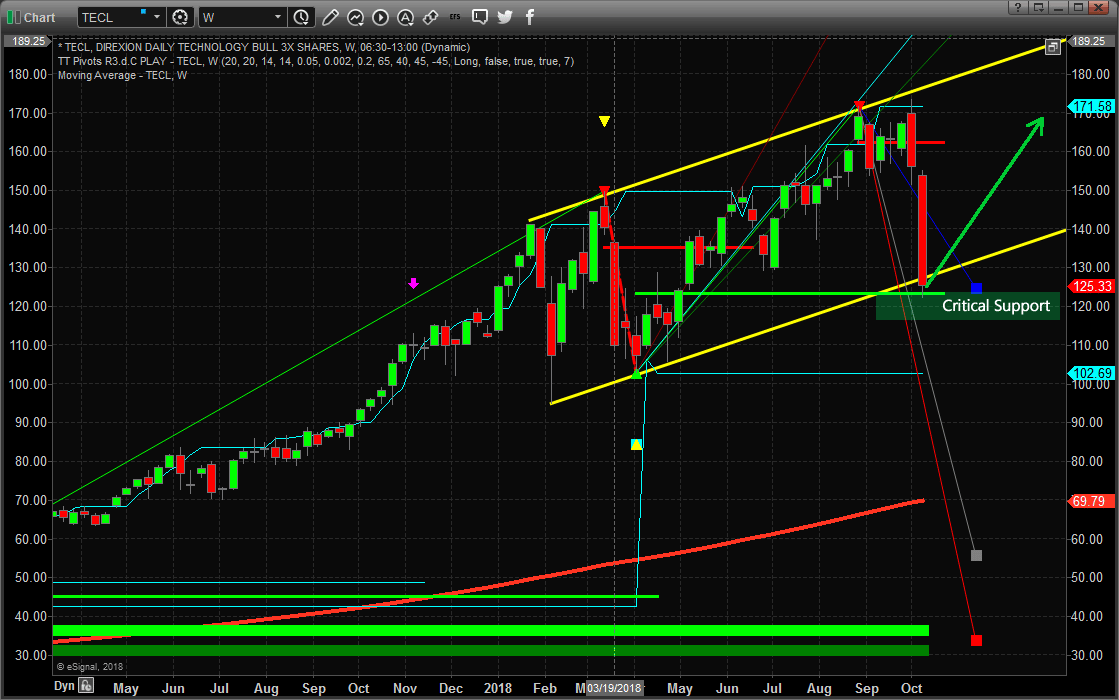
This Weekly TECL chart shows a similar picture to the QQQ chart. The price channels are clear. The Support level is clear. The lows of February 2018 are still acting as “deeper price lows” that indicate we should consider these levels critical to see any major price reversal to the downside. Our critical support level is just below recent price lows, thus we should be expecting the price to stall near this level and the upside price target near $172 is close to $50 away. As long as this support holds and the price continues to hammer out a bottom near or below the $130 level, this rotation could play out for a very nice 20~30% upside price move.
We are not urging our followers to BUY anything just yet. Certainly, be aware of the potential for an upside move as this price bottom plays out over time. Use your own skills to find and execute proper trades or visit www.TheTechnicalTraders.com to learn our team of professionals can assist you.
Our proprietary price modeling systems will tell us exactly when and how to enter these trades and we want our followers to understand the type of rotation that we believe is currently playing out in the markets. We believe this recent move to the downside was the result of very mild volatility prior to this move, computerized trading models setting large sell orders near the 2715 price level on the S&P in preparation for just this type of move. Once the price reacted to the US Fed, general price rotation and selling pressure and fell below 2715, the sell programs kicked in and drove the price down to levels near support. So far, prices have not attempted to move much lower and that is a very good sign for the current trend channels and upside price trend. Watch how this plays out and get ready for some great trades over the next 6+ months.
Please take a moment to visit www.TheTechnicalTraders.com to see how we can help you find and execute better trades. Our team of researchers and technical traders follow these markets every day to try to find and understand the dynamics at play globally. Take a minute to read how we predicted this downward market move 3+ weeks before it happened with our predictive modeling systems. If you don’t think it is possible to know what the markets are going to do weeks in advance, then take a minute to review our work and see for yourself how we predicted this move to the 2700 level in the S&P. Now, get ready for some great trades that will be setting up over the next 4+ months. Q3 and Q4 of 2018 are going to set up some really big opportunities for skilled traders.
Chris Vermeulen
http://www.thegoldandoilguy.com/wp-content/uploads/2014/11/tgaoglogo.png00adminhttp://www.thegoldandoilguy.com/wp-content/uploads/2014/11/tgaoglogo.pngadmin2018-10-15 20:58:542018-10-15 20:58:54Technology Sector Set For A Rebound?
There has been quite a bit of information and opinion in the news recently regarding the recent downside price action in the US Equities markets. We’ve seen everything from “The sky is falling” to “The markets will rally into the end of the year”. If you’ve been following our research and analysis, you already know what we believe will be the likely outcome and if not – keep reading.
There are a number of key components of the global economy that are of interest currently; US Treasuries, Precious Metals, Emerging Markets, the European Union, Trade Issues and Capital Shifts.
When one considers the scope of the entire global market environment in terms of these individual issues, a fairly clear picture of what is really happening begins to take shape. Here is our summarized opinion of the current state of the global markets.
Capital is shifting (again) as the US Technology and high return sectors come under pressure. What happens, typically, in this type of environment is that capital moves away from risk (into cash or other suitable investments) as these sectors continue to weaken. Capital will return to these sectors once the risk factor diminishes or abates. Once the S&P fell below the 2915 level, a number of Sell Programs generated extensive downside pressure on the markets – in a way, creating a “wash-out low” price rotation fairly early in this move. Investors and capital will return into these sectors over time as they find support and wash out the extended volatility that is currently at play in the markets.
This capital shift is not unique to just the US markets though, there are other factors involved as well. News that Asian investors have been pulling out of the US Real Estate markets at a record pace, as well as the US Fed actions raising rates recently, has put additional pressure on the valuation/pricing levels in the US equities market. This is likely the reason why Gold and Silver rocketed higher last week. This pricing pressure, even though it was known prior to this downside price move, was not much of a concern for investors because the US stock market indexes didn’t show worry or concern for this issue. There was no real issue with downside pricing concerns. Once the S&P broke that 2915 level and the sell programs kicked in, this became a real issue for many.
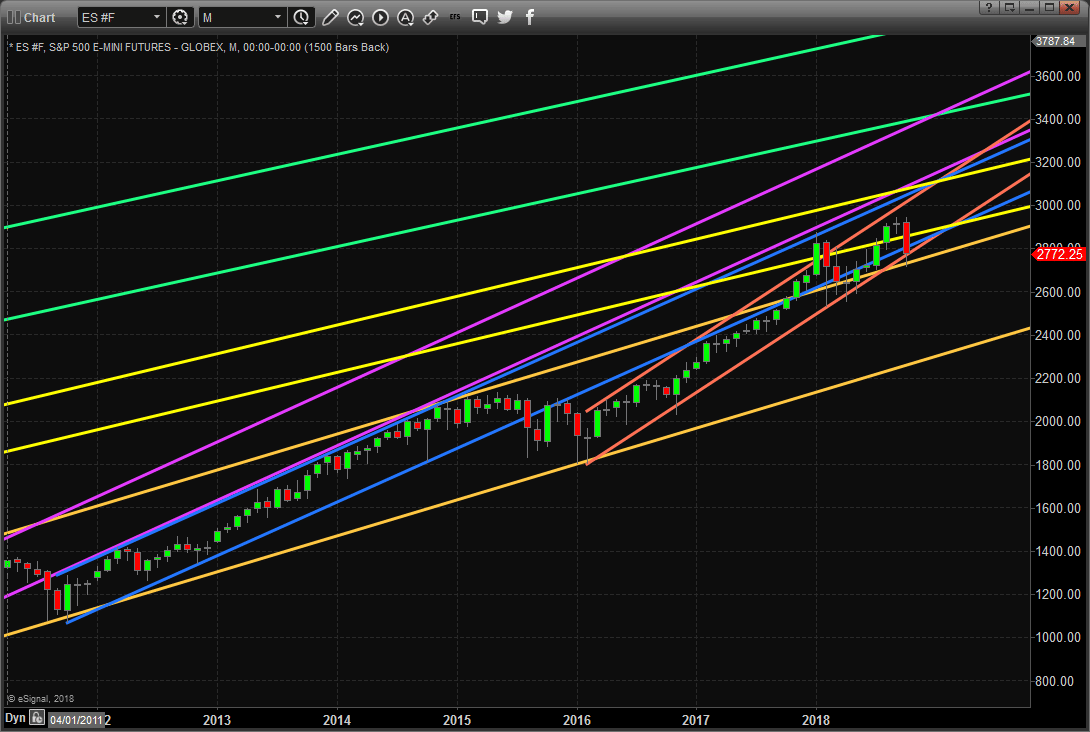
Yet, the longer-term perspective of this market has not changed much since early 2016. Take a look at this chart that highlights the pricing channels established in the S&P of the past 20 years. Each of these paired price channels originates at a low price point and reflect price range, slope and volatility as the progress further to the right. Notice how the original (GREEN) and most recent low-price range (GOLD) reflect a broader price range where volatility was higher and the slope is slightly lower than the shorter-term price channels. These reflect broader price support channels and help us to understand the core slope levels of price advance.
The shorter-term price channels (YELLOW, MAGENTA, BLUE & ORANGE) illustrate the “impulse channels” that are a result of localized or consensus advances. In other words, these types of advances are the result of some impetus event like Quantitative Easing, policy changes, US Election results or any combination of social & economic improvement factors. Price is always attempting to rotate as it attempts to establish new highs and lows.
We try to stress one key Fibonacci Price Theory component to all of our followers:
“Price MUST always attempt to seek out and establish new price highs or new price lows”
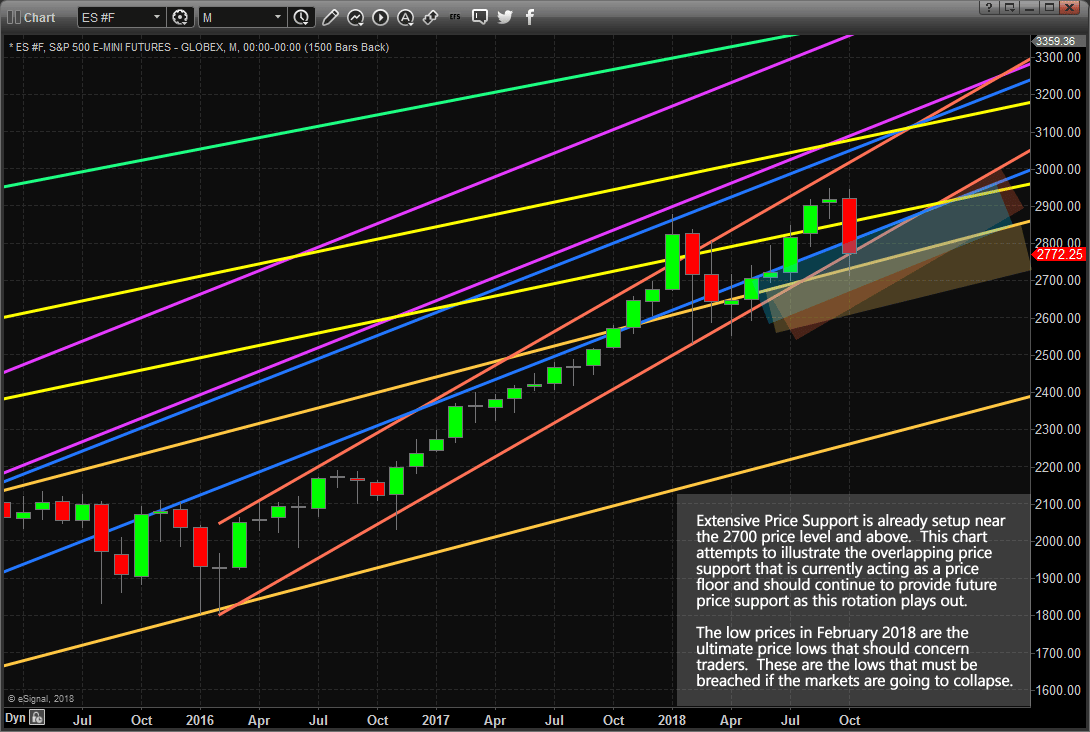
This one premise of Fibonacci Price Theory is so important to understand in the greater context of price movement. On a Daily chart, the recent downward price swing may look frightening, but on this Monthly chart, it falls right in line with the ORANGE price channels (which happen to be the most recent and most aggressively upward sloping price channels over the past 20+ years). Additionally, the price has advanced above the Upper GOLD price channel range and back into the BLUE price channel range in late 2017 and early 2018. At this point, price appears to be accelerating quite well and these new support levels (BLUE, ORANGE, and GOLD) are critical to understanding the basics of Fibonacci Price Theory.
So, as you listen to the talking heads on TV and in the news cycles, please understand that true price theory teaches us that “until price breaks recent critical lower or higher price levels, the market price will always attempt to rotate in an effort to seek out and establish new price highs or new price lows”.
This rotation is very healthy for the markets, overall, and this price rotation may, eventually, prove to be a retest of price support before a further advance. Our research team believes the low established near 2712 will likely continue to operate as critical price support as this price rotation continues to extend. Our research team also believe a new price advance phase will become established shortly after November 8~12. Our predictive modeling systems suggest a new price upswing will begin to take place after these November dates.
We urge all of our followers to visit our website, www.TheTechnicalTraders.com, to learn how our dedicated team of researchers and technical traders can assist you in finding and executing better trades, stay ahead of these markets move and properly prepare for the opportunities created by these swings in price. Additionally, take a minute to review some of our past research posts, www.TheTechnicalTraders.com/FreeMarketResearch/, to see how we predicted this downside price rotation over 3 weeks before it happened. It pays to have a dedicated team helping you understand and profit from these market price swings.
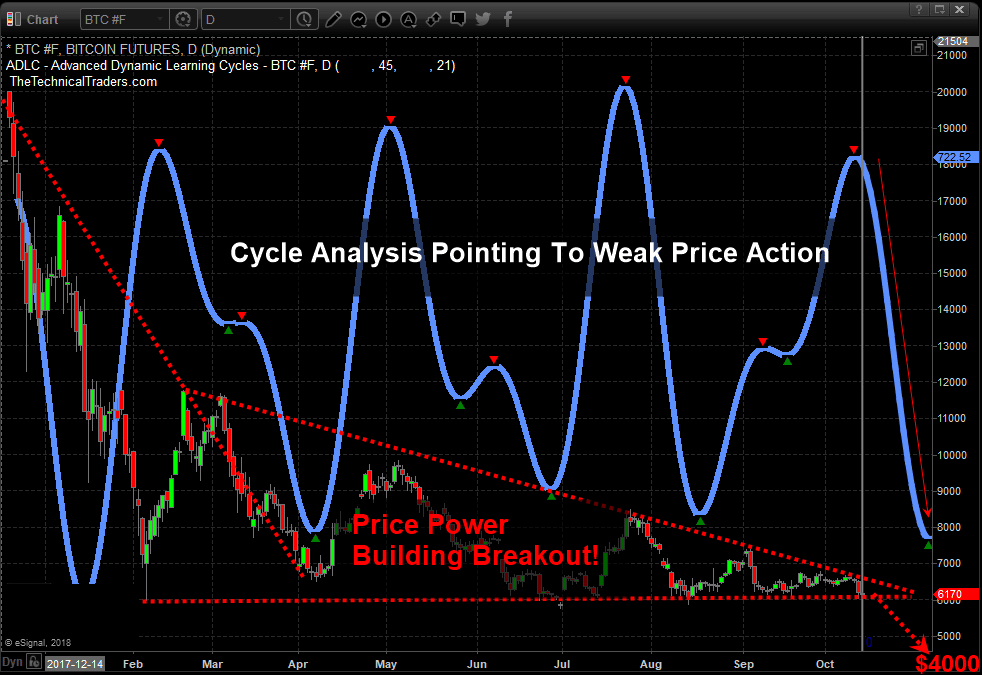
Recent market turmoil across the global stock markets has refocused investors on the concerns of global economics, trade, and geopolitical issues – away from cryptocurrencies. The biggest, Bitcoin, has been under extended pricing pressure recently and our research team believes Bitcoin will breach the $6000 level to the downside fairly quickly as extended global market downtrends continue.
The premise of our analysis is simple, the factors weighing on foreign investors and Bitcoin investors are that currencies are fluctuating wildly, local stock markets are declining and local economies may be contracting. All of this operates as a means for investors to turn to a “protectionism” stance where they attempt to protect capital/cash and attempt to limit downside risks. The fact that Bitcoin has yet to break higher and has continued to fall under further pricing and adoption pressure means those investors that were hungry for the next great rally may be getting tired of waiting for this next move – if it ever happens. Our belief is that any downside pressure in Bitcoin below $5800 will likely push many crypto enthusiasts over the end and prompt them to sell out before prices attempt to move down further.
Our research team believes a deeper downside price rotation is setting up in Bitcoin that will push prices below the $5000 level before the end of this year. The uncertainty of the global equities markets are creating an environment where cryptos have simply lost their appeal. There has been no real substantial upside price move over the past 6+ months and the FLAG formation setting up is a very real warning sign that the eventual breakout move could be very dangerous.
Are you Interested to learn blockchain technology, the driving force behind the cryptocurrency Bitcoin?
Then Intellipaat blockchain course is for you. Intellipaat is a popular e-learning and professional certification company who provides training on all latest technologies like Big Data, blockcahin, AI, and deep learning course.
Additionally, when we add our proprietary Advanced Learning Cycle system to the research, which points to much lower price rotation over the next 30+ days, we begin to see the very real possibility that Bitcoin could fall below $5000 very quickly and potentially target $4000 as an ultimate low.
As much as we would like to inform our followers that we believe Bitcoin will rally back to $18k fairly quickly, that is simply not the case. All of our indicators are suggesting that Bitcoin will fall to below $5000, and possibly towards $4000, before any real support is found. If you are a bitcoin believer, be aware that you may have a substantial opportunity to use your skills at this price swing plays out. Looking to buy back in near $4000 is much better than trying to hold for an additional $2000 loss.
Visit www.TheTechnicalTraders.com to learn more about our research team and resources to help you become a better trader. Be prepared and build your skills to target greater success with our dedicated team. Read some of our other research to see for yourself how well we’ve been calling these recent market moves. Isn’t it time you invested in your future success?
Chris Vermeulen
http://www.thegoldandoilguy.com/wp-content/uploads/2014/11/tgaoglogo.png00adminhttp://www.thegoldandoilguy.com/wp-content/uploads/2014/11/tgaoglogo.pngadmin2018-10-12 11:38:452018-10-16 10:03:54Bitcoin Breakdown May Push Prices Below $5000
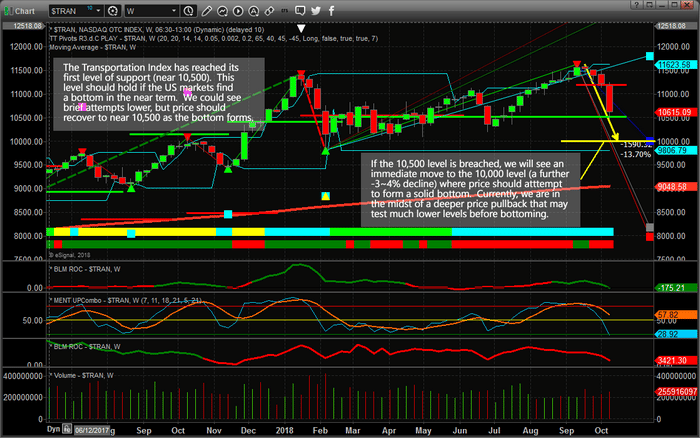
Our research team, at www.TheTechnicalTraders.com, is alerting our members that the Transportation Index has reached its first level of support near 10,500 and this level may be the start of an extended bottoming formation. If you have been following our research posts, you already know that we predicted this recent downside price swing over 3 weeks ago with our Adaptive Learning Predictive Modeling systems. You will also understand that our modeling systems suggest this move may not end till early November (somewhere between November 8~12). Keeping this in mind, we are now alerting you to be prepared for the following.
This Weekly US Transportation Index chart highlights what we believe will become support for the US stock markets. The 10,500 level, highlighted by the GREEN horizontal line, is a key support level that goes all the way back to late 2017 and early 2018. This level will likely present strong support for the Transportation Index and, thus, for the US stock markets in general. We do expect the continued downside pricing pressures to test this level over the next few weeks, but we are beginning to think we may be setting up for an extended bottom formation that may include many weeks of volatility and sideways price rotation.
If the 10,500 level is breached, secondary support exists at the 10,000 level (only 500 pts below). As dramatic as that move will be, if it happens, this suggests that any attempt to move to near this level could be considered a “wash-out low” price rotation – a typical bottom formation. At this point, we believe the 10,500 level is holding as we are not seeing extended downside price action in the current market. If the US stock market was severely threatened by internal or external factors, we believe we would have seen much deeper follow-through the day after the massive price collapse.
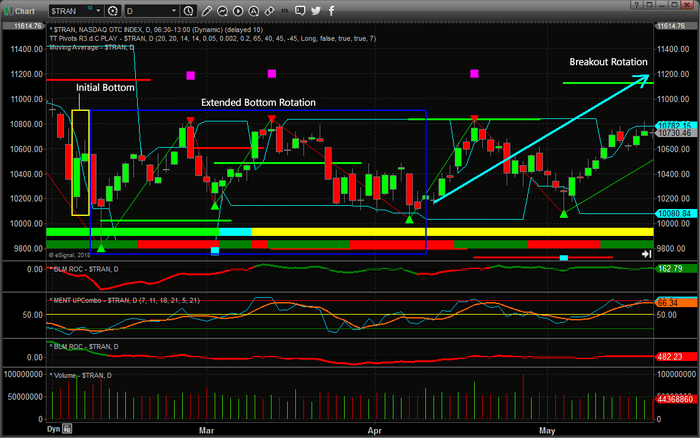
What does an extended bottoming formation look like and what should we expect over the next few weeks? Please take a look at this Daily Transportation Index chart that shows an earlier example of extended bottoming and bottom price rotation before a recent upside price move. This example clearly shows how the initial bottom setup (highlighted in YELLOW) forms prior to an extended period or “basing” or bottoming price rotation. We don’t expect many months of this type of bottoming price rotation. We expect this bottom to setup and form over a period of about 2~3 weeks before a new uptrend begins to form. Overall, this is a good example of how an extended bottom is formed before an upside price move initiates.
We urge you to pay attention to our posts and to visit www.TheTechnicalTraders.com to learn more about how we can help you navigate these markets. Please take a minute to visit our website and learn how we continue to work to assist our members with clear and effective analysis, research and trading signals every day. It really makes a world of difference when you have a dedicated team of researchers using specialized proprietary price modeling systems to help you stay ahead of these market moves.
Chris Vermeulen
https://thegoldandoilguy.com/wp-content/uploads/2018/10/Chart_18-10-11_TRAN_W_Fib.png438700adminhttp://www.thegoldandoilguy.com/wp-content/uploads/2014/11/tgaoglogo.pngadmin2018-10-11 13:27:432018-10-11 13:28:00US Transportation Index Suggests Bottom May Be Forming
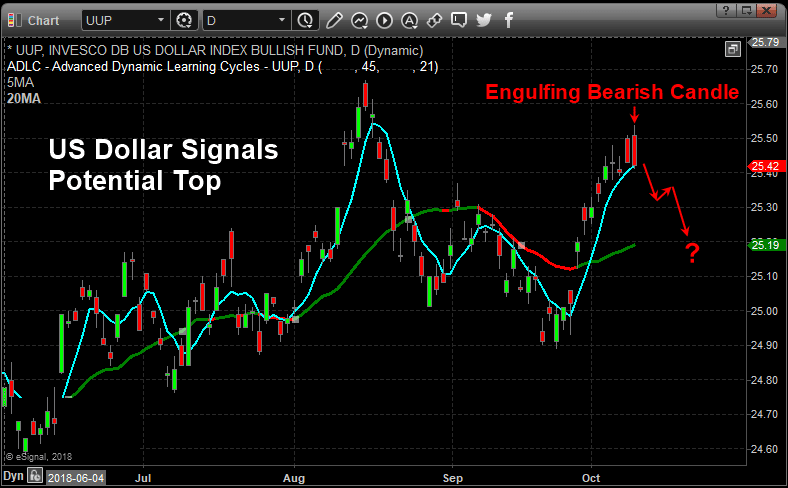
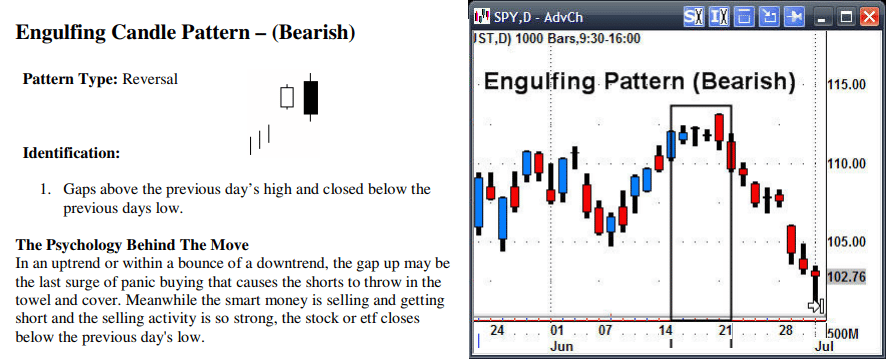
A unique setup has occurred in the UUP (Invesco DB US Dollar Index) that resembles an Engulfing Bearish type of pattern (even though it is not technically an Engulfing Bearish pattern). Technically, an Engulfing Bearish pattern should consist of a green candle followed by a larger red candle whereas the red candle’s body (the open to close range) completely engulfs the previous candle’s body. In the instance we are highlighting in this article, a unique variation of what we’ll call a “Completely Filled Engulfing Bearish” pattern is setting up.
This is when two red candles setup in an Engulfing Bearish type of formation – omitting the requirement that the first candle be green. Japanese Candlesticks help us to identify the psychology of the market price in relation to our other specialized tools. We believe this formation is important because both of the red candlesticks that make up this pattern opened much higher than the previous bar’s close and dramatically sold off into the close of each session. We believe this type of rotation clearly illustrated that price is reaching resistance near $25.50 and pushing lower because of this strong resistance. We also believe this resistance/pattern will setup a downside price move in the US Dollar very soon.
Below, we have highlighted the traditional formation of an Engulfing Bearish Candlestick pattern. The example chart, to the right of this definition, shows another variation of the Engulfing Bearish pattern setting up after three minor sideways candles. The interpretation of this Bearish Reversal pattern is subjective in terms of understanding the psychological representation of the Engulfing Bearish pattern. This pattern represents a total reversal of power within the price bar where the buyers were in control at the open (resulting in a higher opening price) and lost control through the trading session to allow the sellers to drive the price much lower into the close of the trading session. Thus, the Engulfing Bearish pattern represents a “key pivot point” in price that may prompt a larger downside move in the near future.
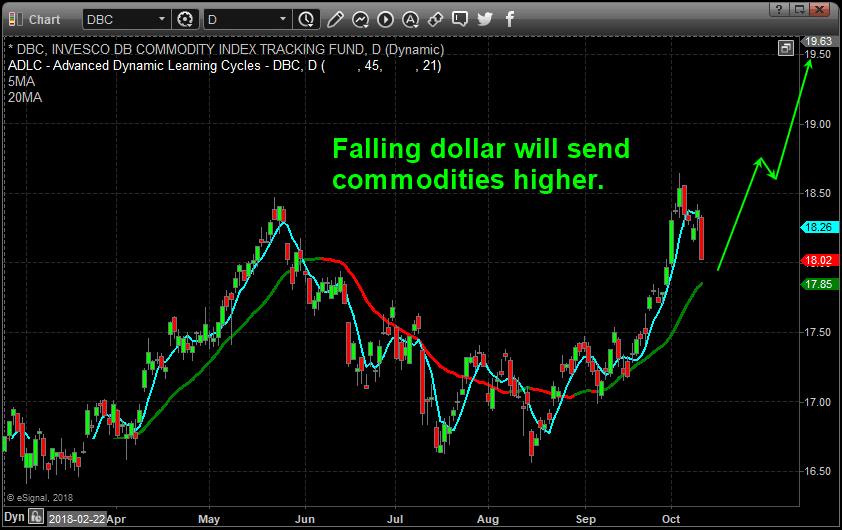
When we consider the totality of this US Dollar move, a falling US Dollar will result in a number of other relative price swings across almost all of the major global markets. One thing that is immediate for our research team is that any price decrease in the US Dollar will likely prompt a further advance in the price of Commodities. Commodities are tied to the US Dollar because almost all trade is based in UD Dollar value. When the US Dollar rises, commodities become more expensive for foreign buyers. When the US Dollar falls, commodities become less expensive for foreign buyers. Therefore, any price decline in the value of the US Dollar should prompt an increase in commodity prices.
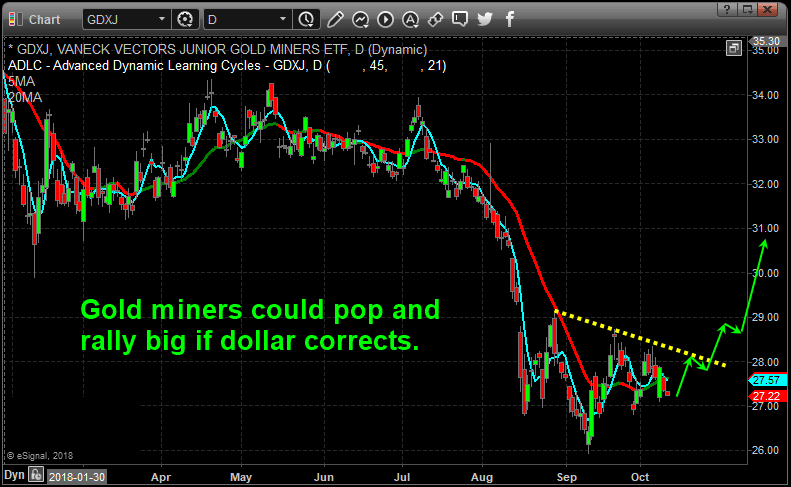
Additionally, any sharp decline in the price of the US Dollar should also prompt a rally in Precious Metals and Mining Stocks. Precious Metals react to US Dollar pricing just like Commodities do. As the US Dollar strengthens, Precious Metals tend to fall as a means to counter the increased cost basis for these metals. Under normal economic pressures, the precious metals react to pricing based on fear of economic crisis events, raw demand and global currency valuations. The few things that can dramatically alter this relationship are massive increases or decreases in demand and any type of global economic crisis events. When these impetus factor act together, the Precious Metals sector can rocket higher or decline quickly as the fear or demand issues increase and decrease over time.
Our belief is that the US Dollar will rotate lower over the next few weeks headed into the uncertainty of the US mid-term elections and that the Commodities and Precious Metals markets will likely increase in relation to this US Dollar weakness. These potential price swings present very clear opportunities for skilled traders. Our research team follows almost all of the global markets in an attempt to keep our subscribers aware of opportunities and trends that exist in the global markets. If you want to see why our subscribers stay with us and believe in our ability to assist them in finding greater success, then visit www.TheTechnicalTraders.com
https://thegoldandoilguy.com/wp-content/uploads/2018/10/uupc1.png488788adminhttp://www.thegoldandoilguy.com/wp-content/uploads/2014/11/tgaoglogo.pngadmin2018-10-10 21:57:112018-10-10 21:57:11Dollar Engulfing Bearish Pattern Warns Of Dollar Weakness