The Technical Trader Chris Vermeulen is with us today to share his thoughts on the oil sector. With crude over $62/barrel this is a level we have not seen since late 2014. The recovery has been slow for oil but it has built a nice base which typically results in a more powerful rally. Chris is careful to point out that he is not expecting a straight up move from here. We also look at the recovery underway in the dollar.
https://thegoldandoilguy.com/wp-content/uploads/2018/01/crudemonthly.png441587adminhttp://www.thegoldandoilguy.com/wp-content/uploads/2014/11/tgaoglogo.pngadmin2018-01-11 10:54:112018-01-11 10:54:11Oil Trading At A 3 Year High, Now Where?
Chris Vermeulen has been involved in the markets since 1997 and is the founder of Technical Traders Ltd. He is an internationally recognized technical analyst, trader, and author of the book: Technical Trading Mastery – 7 Steps to Win With Logic
Through years of research, trading and helping individual traders around the world. He learned that many traders have great trading ideas, but they lack one thing, they struggle to execute trades in a systematic way for consistent results. Chris helps educate traders with a three-hour video course that can change your trading results for the better.
His mission is to help his clients boost their performance while reducing market exposure and portfolio volatility.
https://thegoldandoilguy.com/wp-content/uploads/2018/01/howest-video-interview.png372594adminhttp://www.thegoldandoilguy.com/wp-content/uploads/2014/11/tgaoglogo.pngadmin2018-01-05 14:04:072018-01-05 14:04:07No Fear as the Dow Tops a Record 25000
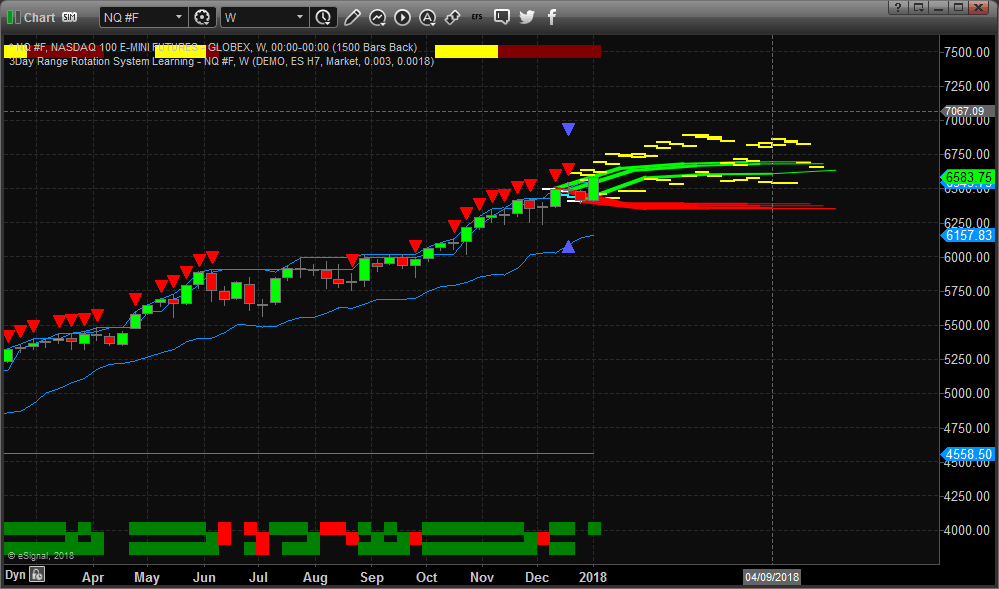
Last week, we posted our research showing that the US markets were setting up for a 2018 Q1 rally based on our research using our advanced predictive analysis modeling tools – the Adaptive Dynamic Learning model. This model attempts to find unique price, technical and indicator patterns in past price bars and then attempts to find similar patterns in newer price bars. When multiple price bars with similar pattern structures are found, it maps these as “unique genomic structures” and attempt to learn from the future price activities. This unique modeling system was created by our team of skilled market researchers in an attempt to provide accurate insight into the markets future price swings.
In doing so, our predictive analysis modeling systems can attempt to tell us what is the highest likelihood of price activity going out 10, 15 and even 20 daily bars into the future. The forecasted highs and lows you should focus on are the yellow lines. The closer together these yellow lines are (predicted high/predicted low, the more confident we can be that prices should follow this path. The farther apart they are, the more likely we will see increased volatility and the potential for larger swings in price range.
As of this week, only a few days into the new 2018 trading year, the US markets are already up between 1~2.5% and likely have another 1~3% more upside activity before finding any resistance. Let’s take a look at some charts.
This Weekly chart of the Nasdaq (NQ) clearly shows the expected future price levels and ranges going out nearly three months into the future. You can see from this chart that the YELLOW LINES are predicting generally higher price levels through the end of February 2018 when a sudden price consolidation is expected. This will likely result in a 2~5% price decline sometime between February 21 and March 26, 2018. After this brief rotation, the Adaptive Dynamic Learning modeling system is predicting further price advancements in the range of 2~3% or more before stalling again in late April 2018. So pay attention, any lows in the NQ below 6485 are likely very strong BUY TRIGGERS.
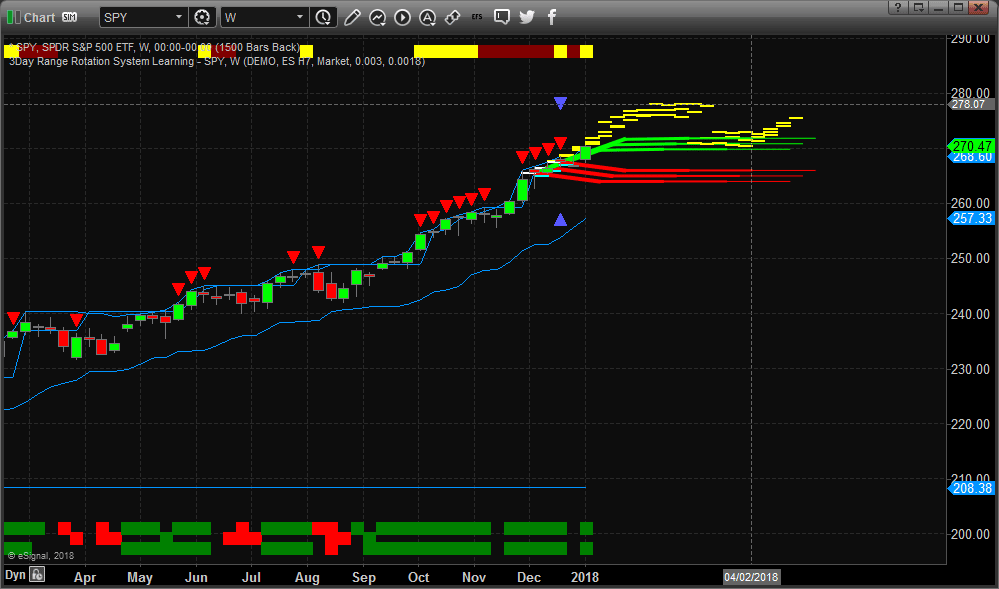
Now, let’s take a look at the SPY on a Weekly basis.
The SPY chart is more uniform in structure and alignment with the ADL predictive modeling system. This tells us that the price volatility for this symbol will be more muted than the NQ Futures chart. It also tells us that we may not see the same level of volatility enter the SPY till after January 22, 2018 – which is when the first real measurable divergence in predictive price levels happens.
The first measurable rally in the SPY in 2018 should be about 2.5~3% from 2017 closing price levels and end near February 12th or so. This move will be followed by a very short downside price correction of about -1~2% ending near March 10th~16th. The next leg higher could be relatively large with a 3~5% rally through the end of April 2018.
We are predicting that this first Quarter in 2018 will see a continued market rally with a brief pause/stall in price near the end of February or early March. We believe the Q1 final results will be the NQ ending 3~5% higher than the 2017 closing price and the SPY ending 5~6% higher than the 2017 closing price. Are you ready for this move? Do you know which stock or ETF you should trade for maximum return? We can help you!
So far, our predictions about 2018 have been very accurate with this modeling system and you should be able to see the value of “being able to see into the future” with our various forecasting modeling system. Our team of researchers and professionals at Technical Traders Ltd. are here to assist you in finding and executing profitable trades each week with our unique research, modeling tools and trade alerts. Imagine how much more successful 2018 would be for you if you knew what the rest of the year would look like?
Visit www.TheTechnicalTraders.com to learn how we can assist you in finding and executing successful strategies during the next two years as the major trends start to shift and new strategies will be required to profit from elevated volatility and falling prices. Join today and make 2018 one of your best trading years yet.
Chris Vermeulen
https://thegoldandoilguy.com/wp-content/uploads/2018/01/Chart_18-01-03_SPY_ADL_W.png589999adminhttp://www.thegoldandoilguy.com/wp-content/uploads/2014/11/tgaoglogo.pngadmin2018-01-03 21:54:322018-01-03 21:54:322018 US Market Rally Is Just Starting
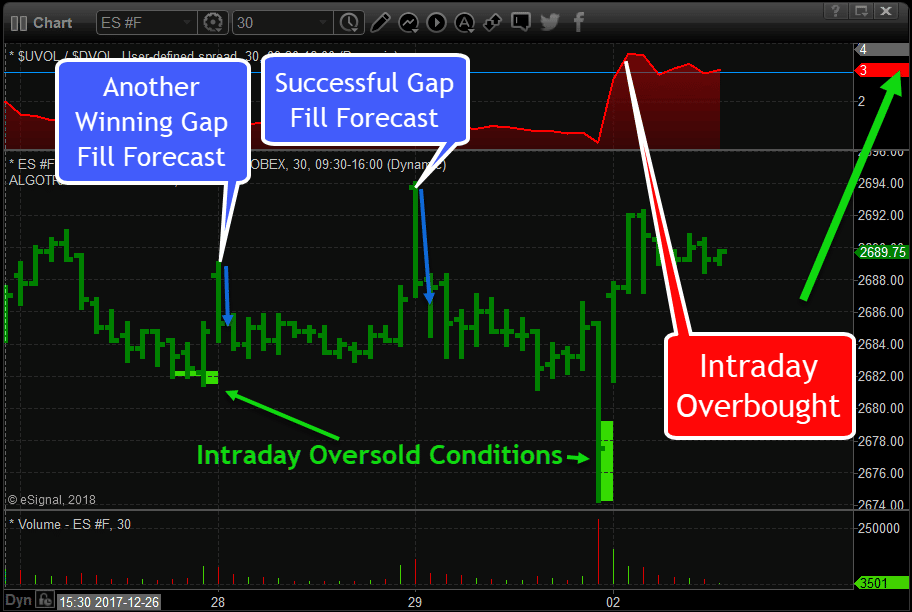
The past week our forecasts have been dead on in terms of timing intraday tops, bottoms, along with oversold levels.
The 30-minute chart of the SP500 index shows the two gap fills, oversold buying zones, and our recent forecast yesterday afternoon which was for a continued rally. Everything has played out as expected thus far.
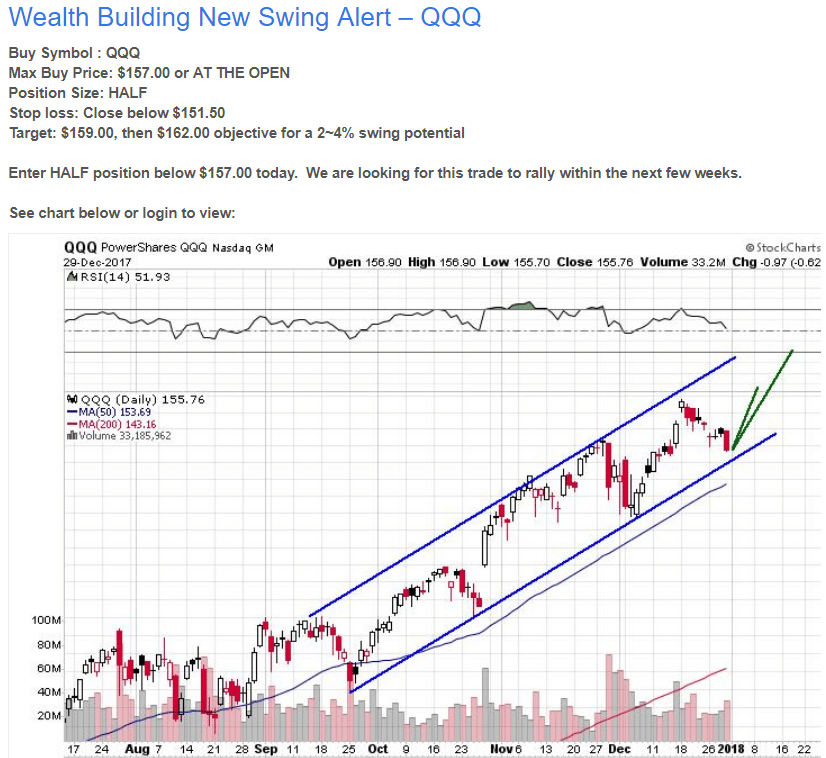
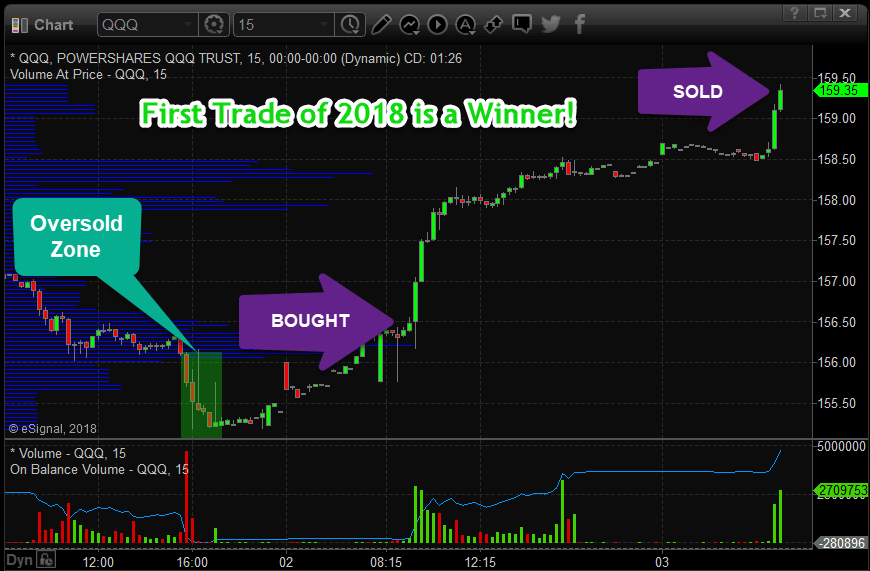
Subscribers of our Technical Trading Wealth Building Newsletter have already taken profits on our first trade of the year with QQQ. This trade setup was a no-brainer as it had multiple technical reasons to get long for an imminent pop/rally. Below is the recent trade issued to our group of traders.
As you can see in the QQQ chart below the market gave us an oversold condition which we entered long the next trading session and have now taken partial profits for quick and easy money.
If you want to make the most of out of 2018 with your trading and long-term investment positions join our Wealth Building Trading Newsletter Today – CLICK HERE
https://thegoldandoilguy.com/wp-content/uploads/2018/01/qqqtrade.png758826adminhttp://www.thegoldandoilguy.com/wp-content/uploads/2014/11/tgaoglogo.pngadmin2018-01-03 10:58:382018-01-03 10:58:38First Technical Trade of 2018 – QQQ