Are you prepared for the next big move in the metals markets?  Would you like to know what to expect in the immediate future that could save you thousands of dollars?  Then pay attention to this message as we share something most traders are overlooking right now.

Our research team at Technical Traders Ltd. have spent years developing our skills and financial modeling systems.  Right now, many traders are seeing the big upward price swings in the metals as a sign that prices will continue higher.  Well, in the long run, they are correct. But right now we believe the metals will roll over and trend lower for the next few weeks setting up for the next leg higher.

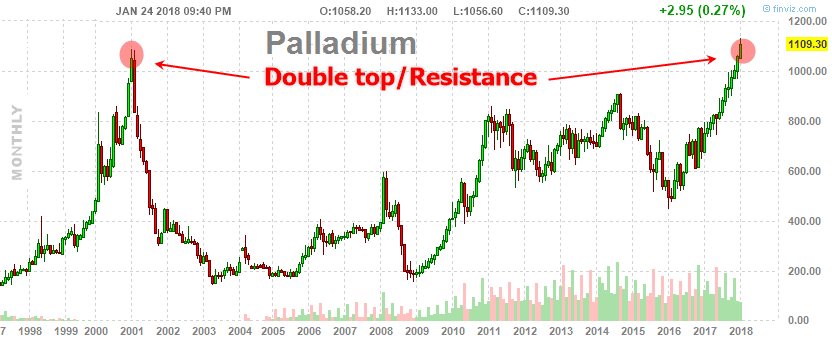
Palladium is a perfect example of this Rollover expectation. Both the current long-term monthly chart shows signs of a massive double top, and the daily chart WEDGE/Pennant formation is likely a washout high rotation pattern that will prompt lower prices over the next few days/weeks.


MONTHLY PALLADIUM CHART

This monthly chart to us is nothing more than a reason for the overbought Palladium market to have a minor pullback before potentially running to new highs. We could see a couple weeks or potentially a few months of weaker prices, but the point here is that price is overbought and at resistance on the long-term chart and imminent pullback is likely to occur for a tradable short or to re-enter after the price has corrected and shows signs of strength for another run higher.


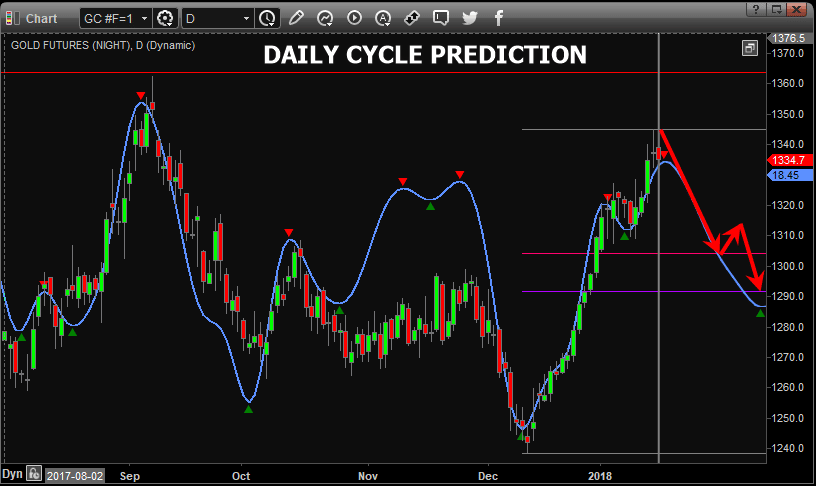
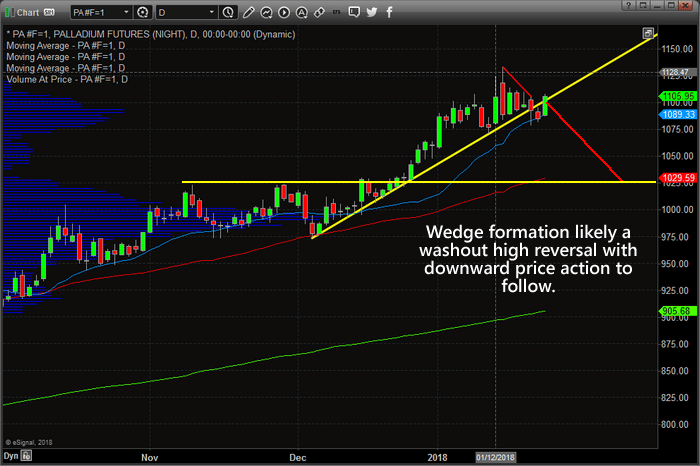
DAILY PALLADIUM CHART

As you can see from this chart, we are expecting a rotation lower based on our modeling systems predictive capabilities that will result in a substantially lower price swing – possibly as much as -8 to -10%.  We believe support will be found just above the $1000 price level.

Additionally, our Adaptive Dynamic Learning (ADL) modeling system is designed to scan historical price activity of any chart and find the unique price and technical indicator formations that operate as DNA markers for the price.  It then continues to scan for new or repeating DNA markers in the market to determine probable outcomes of the price going forward.  In this case, the ADL system is predicting a lower price swing to near $1020 near or after February 8th.  After this price contraction, the ADL system is expecting a solid rally to form.

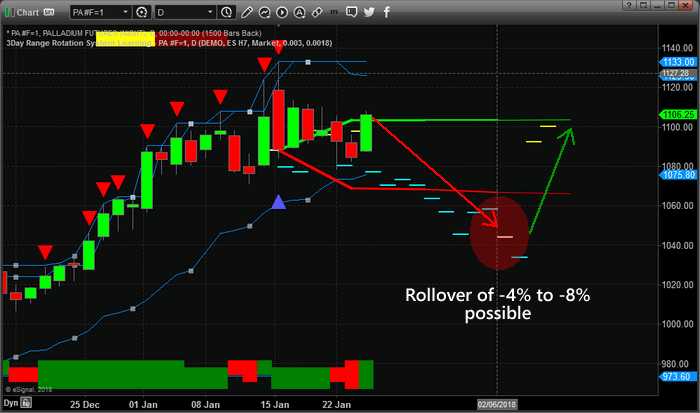
This should be important to all investors because long traders in the metals should wait for this pullback to happen before getting into heavy positions.  Our analysis shows we should see a -4 to -8% price pullback within the next week or two before support will be found.  Obviously, buying near the lowest point is the objective of trading and we believe the February 5th through February 8th timeframe should provide the optimal bottom rotation period for metals traders.

Would you like to receive daily video analysis of our research for all the major markets as well as continue to receive our advanced research reports?  Want to know that the US majors Indexes are going to do tomorrow or next week?  Take a minute to investigate www.TheTechnicalTraders.com to learn how we can assist you in your trading.  Learn how we called this move in the US Indexes for 2018 and how we can continue to identify market moves before they happen with our proprietary modeling systems.

Chris Vermeulen

Chris Vermeulen, Founder of TheTechnicalTraders.com joins met today to look at the markets that are breaking out in early 2018. The USD, oil, copper, and treasuries are all at levels not seen since 2014. Plus as Chris notes the precious metals are also very close to breaking out which could be the final push to make traders move into the commodities sector even more.

GET THE TECHNICAL TRADERS.COM ALERTS TODAY!

Recent downside price rotation in Bitcoin has caused quite a bit of concern for Crypto traders and investors. This recent breakdown move represented a failure of continued strength and has, and still is, testing critical support for a bottom.

READ FULL ARTICLE – CLICK HERE

Over the past few weeks, we have been writing about our US major price predictions for the beginning of 2018 and how they have played out.  If you have been following our analysis, you have already learned that we predicted a 3~5% price increase in early January 2018 for most of the US major equity indexes as well as a period of brief stagnation near the middle of February.  Today, we are going to revisit these predictions to attempt to provide you with our updated price expectations.

As you read this article and review our analysis, please keep in mind that we are showing you an advanced price modeling system that is capable of learning from historical price activity as well as illustrating the highest probability outcomes of price based on its analysis of key “genomic” price patters and technical patterns.  The reason this is so important to understand is that we are illustrating 2~3+ month in advance based on our modeling systems interpretation of price action.  Imagine having the ability to predict 2 to 3 months in advance with a relatively high degree of accuracy for any stock symbol you like?  This is a very powerful analytical modeling system and we are happy to be sharing this research with our readers.

First, let’s review the SPY and the possibilities our Adaptive Dynamic Learning (ADL) price modeling system is showing us as well as how accurate the first few weeks predictions have been for 2018.

As you can see from the chart, below, our analysis on December 11, 2107 presented a series of YELLOW DASH lines that represent the highest probability outcome of price going forward.  If you take a close inspection of the price levels and Yellow Dash Lines near the end of 2017, you will see that actual price levels were muted in comparison to our predicted levels.  This happens when we get a brief anomaly in price action whereas price fails to meet our expectations.  When this happens, most of the time price will recover to near our predicted levels at some future point in time which makes these “anomaly triggers” quite profitable.  Imagine knowing that price “should be” near a certain price level but is currently 2~5% lower.  Obviously, one could take a long position and wait for the equity price to simply recover to the projected price level for easy profits.

This is one reason why we believed early January 2018 would prompt a strong rally and a continued rally.  The first few weeks of January 2018 were predicted to be well above $276-278 while price was hovering near $268 at the end of this year – that’s a 4% easy move.

Currently, the predicted price levels are still moderately bullish for the next 2~3 weeks before we begin a rather sharp “washout high rotation” – peaking near $285 by March 5th, 2018. This means, we should be expecting some more narrow price rallies to continue with somewhat diminishing volatility in the SPY before expecting a POP rally (really a “washout high candlestick pattern”) to form near February 15th.

After this Washout High patter forms, traders should protect longs and expect a 4~6%+ price contraction that will scare the markets.  Any price contraction of more than about 5% typically frightens the markets to a degree that people start talking about “bear trend possibilities”.  From the prediction of our ADL system, this looks to be a very fast and aggressive downward price swing in the SPY – so it could be news related.

Our ADL system is predicting somewhat similar price action for the NASDAQ, yet we have a period of consolidation to get through first.  As you can see from the YELLOW DASH lines originating at the same December 11, 2017 time frame, the same type of setup happened in the NQ as with the SPY.  By the end of 2017, the NQ was dramatically lower ADL predicted price levels.  The ADL system was predicting the NQ would reach $6725 by the end of the first week in January 2018 while the actual price at the end of 2017 was $6408 – that represents a +315 pt range.  We took advantage of that “anomaly” by predicting a 3~6% rally in the QQQ ETF in the early portion of 2018 to our members.

Now that our predictions for the first part of 2018 have played out, lets focus on what is next.  The ADL system is predicting a stagnation in price action for the next 4~5 weeks with narrowed volatility and rotation.  We could still see some moderate volatility in price ranges, yet we expect the overall price advance to slow considerably over the next few weeks.

Somewhere near or after February 19th, we expect the NQ price to break to the upside with another 3~5% rally (again, another 350+ pt swing) that should end near March 15th and begin a dramatic downward price move.  The ending prediction of the ADL system for April 23, 2018 is $6846.25 – pretty much exactly where we are at right now.

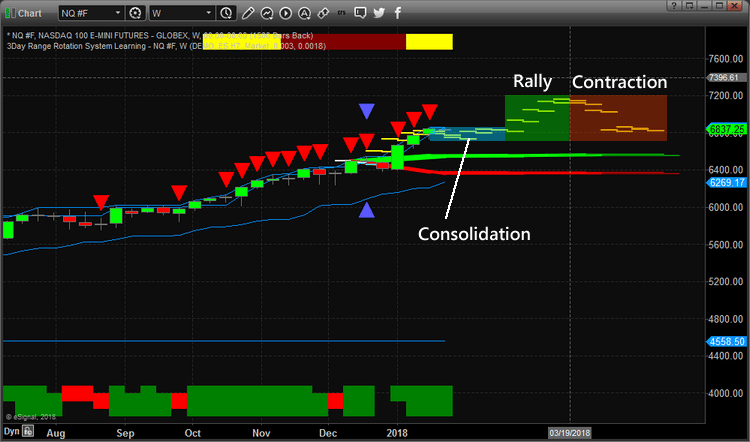
So, knowing this information and knowing that both the SPY and NQ will likely top, or present a short-term topping formation near the middle of March 2018, what should you be doing?  How are you going to trade these opportunities?  Do you want more of our help in understanding how to profit from these moves? Also, if you own Bitcoin you should read our most recent post and see our technical analysis on what to expect next.

That is exactly what Technical Traders Ltd. offers to our members through the Wealth Building Trading Newsletter.  Each day we provide detailed video market analysis and detailed market research to our members.  We identify trends, reversals, trading setups and global market research for all our valued members.  We help them find ways to profit from these moves while keeping them aware of the markets longer term objectives.

We’ve just completed the initial move of 2018.  The rest of this year is sure to be full of interesting and exciting trading activity.  We can’t wait to show you what happens with other asset classes and with equities after the March 2018 correction.  Visit www.TheTechnicalTraders.com to see how we can assist you in profiting from these market moves.  We just laid out a price map of the markets for the next 2~3 months for you to trade with.  Maybe it is time you considered the value we can offer you in terms of advanced predictive analysis and more?

JOIN NOW AND MAKE TRADING PROFITABLE
CLICK HERE

Looking for an easy way to buy bitcoin
I use this crypto wallet called coin CoinBase.

Looking for an easy way to buy bitcoin
I use this crypto wallet called coin CoinBase.

Continued moderate bullish price action in the US majors with the VIX dropping right on queue and markets popping (pure sentiment call).  Gold and Silver pushed higher today while Oil contracted.  The NQ is still pushing into the range of our upper boundary with moderate bullish price action.  The The DOW closed +53.91 (+0.21%), the ES closed +14.50 (+0.52%) and the NQ closed 32.50 (+0.47%).  Gold closed +4.80 (+0.35%) and Silver closed +0.086 (+0.54%).  Oil closed -0.45 (-0.70%).

We are expecting Metals and Oil rotate a bit lower over the next few weeks in relation to our price cycle analysis.  Gold should rotate back below $1300 and Silver should settle near $16.00 before this downward rotation ends.  Oil may rotate moderately lower over the next few weeks, but overall price cycle analysis shows consolidation and sideways trending for a few more days.  Be prepared.

Bitcoin reacted today by consolidating within the Price Channels we have been discussing.  These channels are currently at $11,000 & $11,130.  Within this $130 range, we expect Bitcoin will consolidate before attempting a breakout move.  At this point, upside rotation is possible, but the news relating to BlockChain and Bitcoin tend to point to a lower price breakout.  Currently, Bitcoin is trading at $11,515.00.  Be prepared for additional downside risk at this point.  $7,800 is now a very real downside target.

GET THIS VIDEO EVERY MORNING
+PLUS OUR TRADE ALERTS 
CLICK HERE

Metals are setting up for that “Rip Your Face Off Rally”.  The following charts for Gold and Silver show a very interesting setup that is unfolding as the US markets continue to strengthen – that being that the Metals are showing strength in price and we can only assume this is related to some level of FEAR in the markets or expectations that the “Equities and Bitcoin Bubbles” are nearing an end.

Gold and Silver have been one of our primary focuses for years.  We warned of the “Rip Your Face Off” rally near the Third Quarter 2017 as our cycle analysis was bottoming in December.

The recent rally in Gold has been substantial and has managed to breach recent resistance levels near $1300~1310.  At this point, we are expecting a moderate pullback in Gold over the next few weeks to levels likely near or below the $1300 level before the next leg advances well above $1380.  The presumed formation of Wave 3, if our analysis is correct, should prompt a massive move in the metals over the next 3~7 months with a number of pullbacks along the way.  Right now, it all depends on how Gold reacts to the recent highs and how deep the next retracement in price is. We could see a $1270~1300 level price pullback before the next leg higher executes.  This would be the best entry zone for both traders and long-term investors.

Silver is the “forgotten shiny metal” by many.  As we have been warning our readers, this next move in the Metals market should be a massive Wave 3 (or completed Wave 5 that will prompt a Wave B correction).  Either way, this next move could end substantially higher than where current prices have been consolidating.  Because of the expected continued rally in the US equities markets and because of the strong growth in the economic fundamentals, we believe the next contraction phase in the Metals will be a very opportunistic BUY ENTRY ZONE for traders.

Silver, which has not shown the volatility or price activity that Gold has recently shown, is one of those markets that many people forget about.  Yet, Silver has so much more opportunity for massive price gains as related to the setups that are currently playing out in the US and global markets.  As fear builds and global markets react to the Everything Bubble, Crypto volatility, Global Market Concerns and Global Political Concerns, the Metals are certainly going to be an interesting and opportunistic play for traders.

As you can see from this Silver Weekly chart, the setup in Silver is similar to the Gold chart, yet the price activity in Silver is very much more muted in volatility than Gold.  We believe that Silver, when the move happens, will show substantial price acceleration to the upside while Gold continues to rally.


2018 is setting up to be a very good year for BOTH traders and long-term investors as the opportunities for skilled and strategic trades is astounding.  Visit our website to learn more about the markets and to receive our daily updated market predictions and trade alerts.

Watch our recent video report analysis just posted live showing our predictive modeling systems and how we target our research to helping our members make money. Once you see for yourself how our analysis is accurate and timely.

We urge you to subscribe to www.TheTechnicalTraders.com to support our work and to benefit from our trade setups.  We believe 2018 – 2020 will be the years that strategic trades will outperform all other markets.  Join us in our efforts to find and execute the best trading opportunities and profit from these fantastic setups.


Chris Vermeulen

Bio: Chris Vermeulen has been involved in the markets since 1997 and is the founder of Technical Traders Ltd. He is an internationally recognized technical analyst, trader, and author of the book: Technical Trading Mastery – 7 Steps to Win With Logic, and helps educate traders with a three-hour video course that can change your trading results for the better. His mission is to help his clients boost their performance while reducing market exposure and portfolio volatility.

After Nine Positive Years, Many Traders Not Ready for Equities Market Down Turn

Get Chris’ Next Trade Setup Today!

CLICK HERE

Tuesday morning in our video forecast we warned that cycles were pointing to lower prices today. With price reaching the 2800 level on the SPX (resistance) and stocks trading in extreme overbought conditions with the morning gap higher this pullback has played out almost perfectly today.

We do expect more selling into tomorrow based on cycles and sentiment. Let’s see what the markets do through overnight trading as we could get a new entry signal this week.

See the chart below for a visual:

GET TRADABLE MARKET ANALYSIS EVERY MORNING BEFORE THE OPENING BELL!

CLICK HERE

Our research has been “spot on” with regards to the markets for the first few weeks of 2018.  We issued our first trade on Jan 2nd, plus two very detailed research reports near the end of 2017 and early 2018.  We urge you to review these research posts as they tell you exactly what to expect for the first Quarter in 2018.


Continuing this research, we have focused our current effort on the Transportation Index, the US Majors, and the Metals Markets.  The Transportation Index has seen an extensive rally (+19.85%) originating near November 2017.  This incredible upside move correlates with renewed US Tax policies and Economic increases that are sure to drive the US Equity market higher throughout 2018.


In theory, the Transportation Index is a measure of economic activity as related to the transportation of goods from port to distribution centers and from distribution centers to retail centers.  The recent jump in the Transportation Index foretells of strong economic activity within the US for at least the next 3 months.


One could, and likely should watch the Transportation Index for any signs of weakness or contraction which would indicate an economic slowdown about to unfold.  In order to better understand how the Transportation Index precedes the US Equity markets by 2~5 months, let’s compare the current price activity to that of 2007~08.


This first chart is the current Transportation Index and shows how strong the US economic recovery is in relation to the previous year (2017).  As the US economy has continued to strengthen and open up new opportunities, the Transportation Index has related this strength by increasing by near +20% in only a few short months.  This shows us that we should continue to expect a moderate to strong bullish bias for at least the first quarter of 2018 – unless something dramatic changes in relation to economic opportunities.


CURRENT TRANSPORTATION INDEX CHART


In comparison, this chart (below) is the Transportation Index in 2007~08 which reacted quite differently.  The economic environment was vastly different at this time.  The US Fed had raised rates consecutively over a two year period leading up to a massive debt/credit crisis.  At the same time, the US had a Presidential Election cycle that saw massive uncertainty with regards to regulation, policies and economic opportunities.  Delinquencies as related to debt had already started to climb and the markets reacted to the economic alarms ringing from all corners of the globe.  The Transportation Index formed a classic “rollover top” formation in late 2007 and early 2008 well before the global markets really began to tank.


2007~08 TRANSPORTATION INDEX CHART


Our analysis points to a very strong first quarter of 2018 within the US and for US Equities.  We believe the economic indicators will continue to perform well and, at least for the next 3 months, will continue to drive strong equity growth.  We do expect some volatility near the end of the first Quarter as well as continued 2~5% price volatility/rotation at times.  There will be levels of contraction in the markets that are natural and healthy for this rally.  So, be prepared for some rotation that could be deeper than what we have seen over the last 6 months.


In conclusion, equities are this point are overpriced, and overbought based on the short-term analysis. We should be entering slightly weaker time for large-cap stocks over the next couple weeks before it goes much higher. Because we are still in a full out bull market, Dips Should Be Bought and we will notify members of a new trade once we get another one of these setups.


In our next post, we are going to talk about two opportunities in precious metals forming for next week!


Read the analysis we presented before the end of 2017 regarding our predictive modeling systems and how we target our research to helping our members.  If you believe our analysis is accurate and timely, then we urge you to subscribe to www.TheTechnicalTraders.com to support our work and to benefit from our signals.  We believe 2018 – 2020 will be the years that strategic trades will outperform all other markets.  Join us in our efforts to find and execute the best trading opportunities and profit from these fantastic setups.


Chris Vermeulen
Technical Traders Ltd.