It has been an emotional ride for most traders since stocks started to sell off last Friday in a big way. This crash we just experienced is VERY much like the Aug 2015 crash. Price and volatility both have parabolic price movements that could either make you a lot of money or lose a bundle depending on where your money was positioned.

This post is to quickly share three recent trades we have taken one of them (REALLY BAD) and what to expect in the markets moving forward.

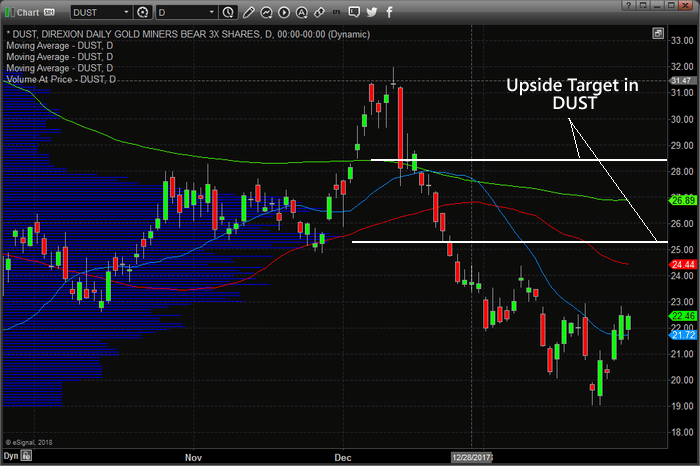
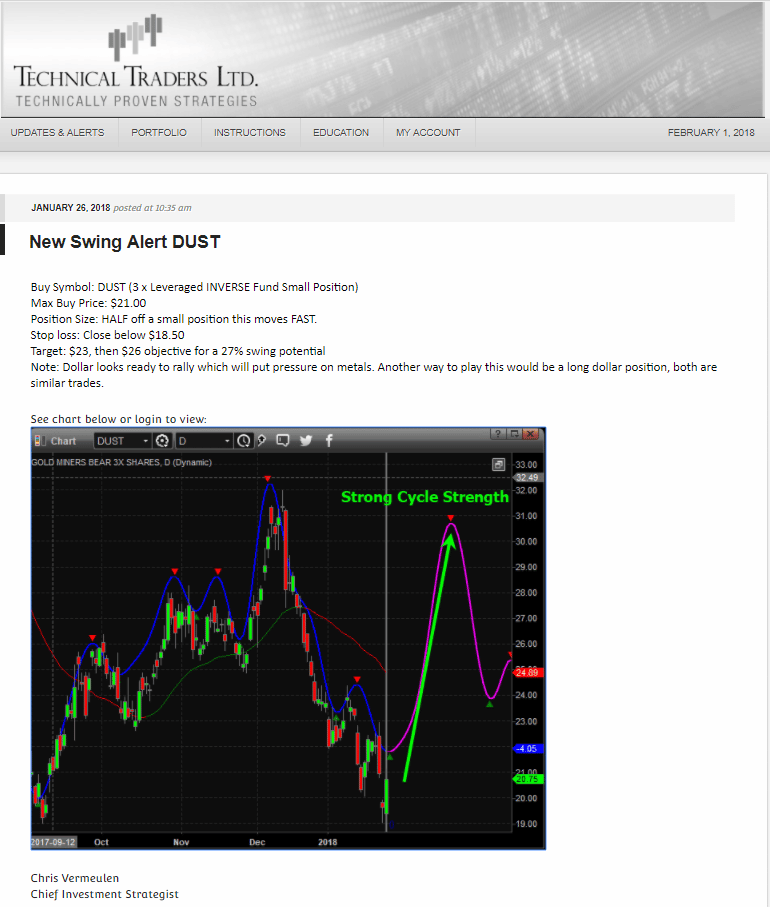
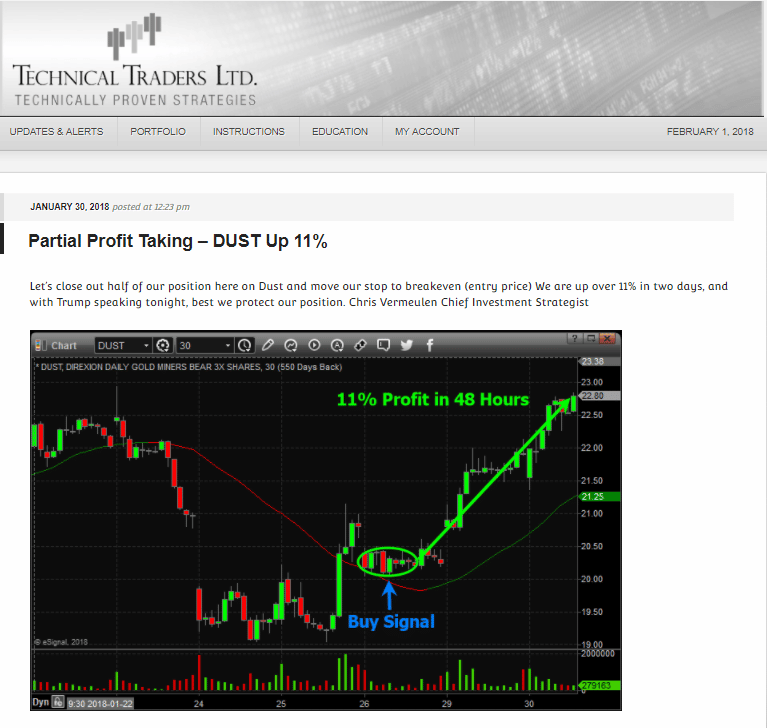
On Monday while the markets were under serious pressure cascading lower our only open position at the time was DUST. This is an inverse gold miners fund that allows us to profit when gold stocks fall in value. We had been expecting gold stocks to fall for a couple weeks and got into the position on Jan 26th. Gold stocks fell quickly and we took partial profits at 11% within 3 days.

We continued to hold the balance of DUST in anticipation of a second leg down in gold stocks which our technical analysis was showing should happen within a couple days which it did. On Monday, Feb 5th while stocks were under more selling pressure money rotated into the gold stocks as a safe haven and that is we decided to close the position with a 20% profit it 7 days. This was a good trade, but the next one isn’t. You can see our play-by-play trade alerts for this here

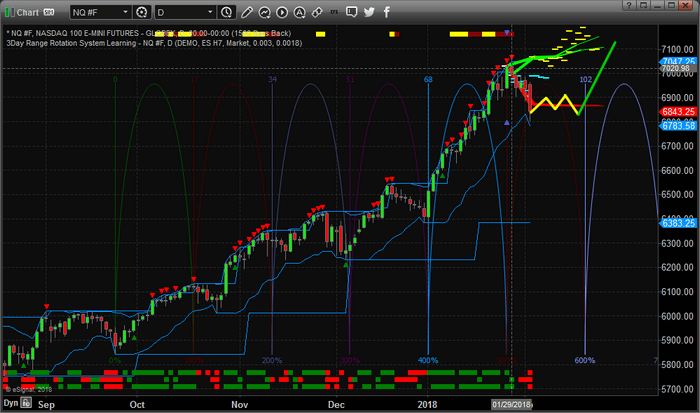
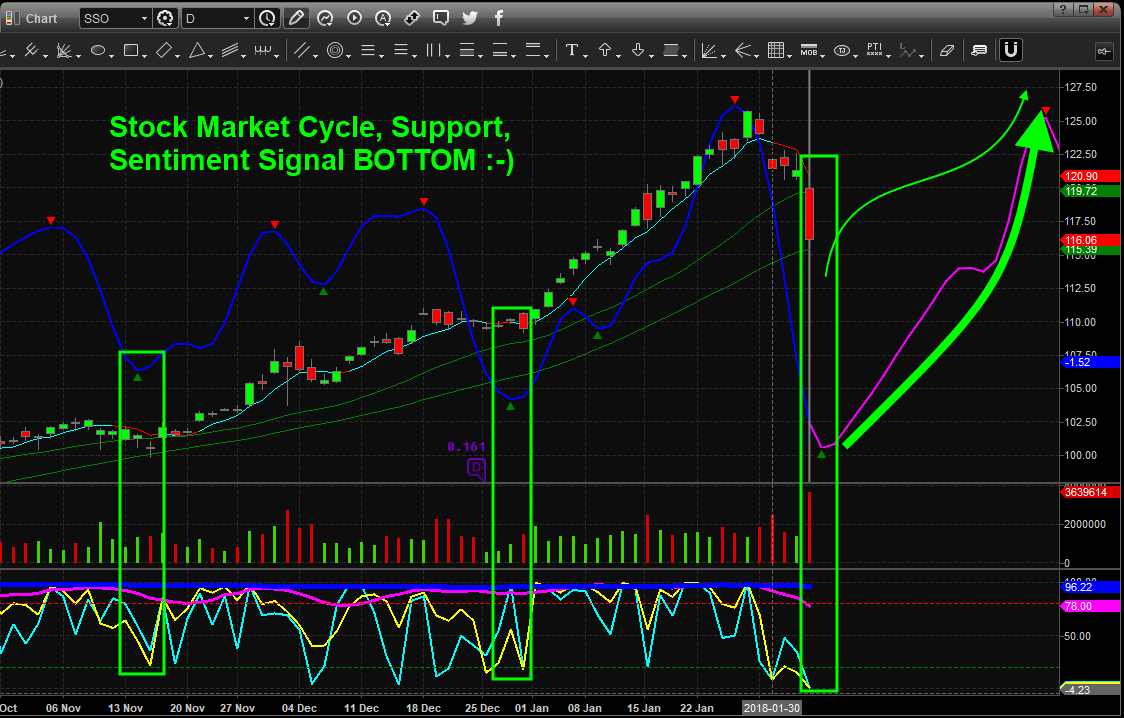
Also, on February 5th we were anticipating the panic selling and looking for a washout low to be put in place Monday/Tuesday of this week. Thus far everything has played out exactly as we expected in terms of price action. What I love about technical analysis is that if done correctly you can predict, or at least have a very good idea of what price should do next, and because we knew panic selling was coming we were not totally caught off guard. But I will admit, I expected half the price movement and volatility that actually took place this time around.


TERRIBLY UNFORTUNATE TRADE

– I always short UVXY when the vix is high, and fade the fear. But no shares were available to short Monday.

– The only other way to do this was to buy XIV and inverse VIX fund which works in most cases but not nearly as good as short selling UVXY.

– Volatility jumped 100% Monday, XIV fund imploded and lost 98% of its value catching hedge funds, professional traders, and us off guard.

– XIV is still trading, it will take many months to regain and reduce some of its drawdown.


TUESDAY’S CLAWBACK TRADE

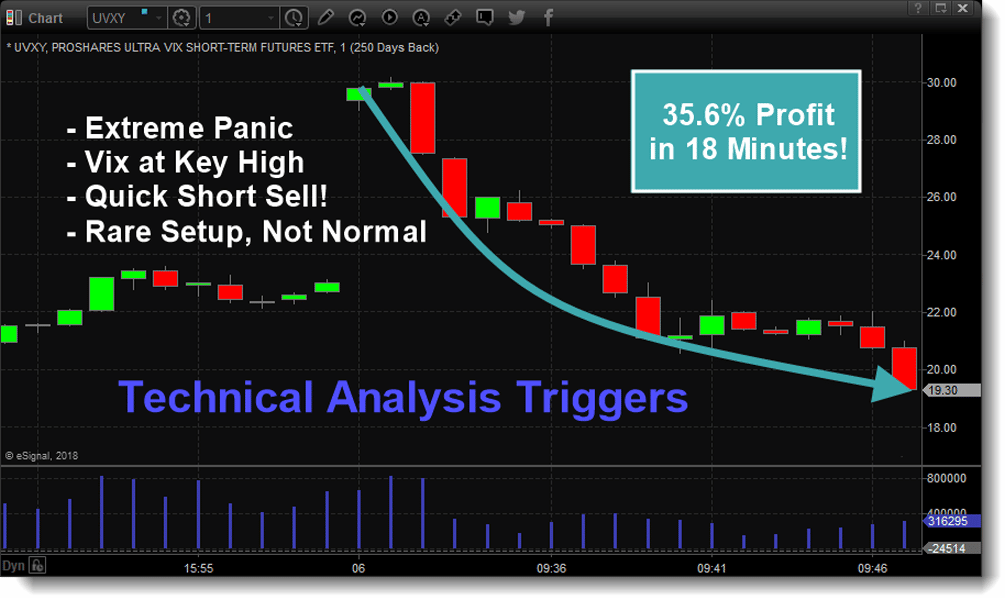
During extreme situations like XIV position dropping 98% there are two ways to deal with it. Take the loss and move on, or use the extreme market conditions to get back into a trade and catch the next big move to help minimize XIV drawdown. So we took a short sell trade on UVXY Tuesday at the open. The Vix was set to gap sharply higher into a level it has only ever reached a few times in before. By shorting the vix it means we profit when the vix falls in value which it did.

We opened the trade right at the opening bell and the vix when into free fall hitting our first protic target within 18 minutes for a 36% profit. We still hold half the position expecting a larger gain over the next few days. Currently, this short UVXY position is up over 50% and we are looking for roughly 70% before we close it out.


Take a listen to my audio Squawk Box broadcast today to subscribers to get a feel for the XIV, volatility, and the stock market.


CONCLUSION:

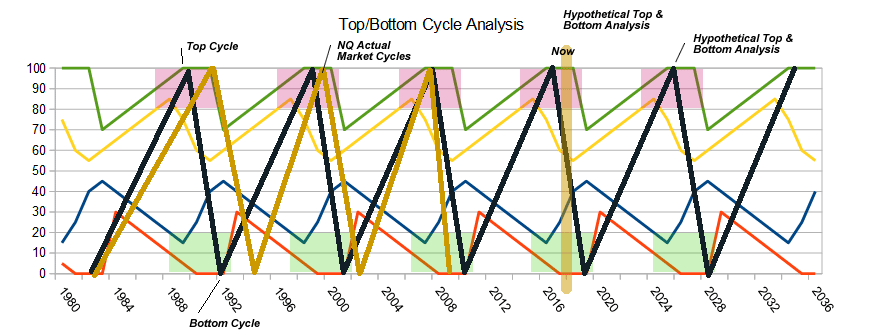
In short, February has been exciting, to say the least. I feel this price action is a major warning and signal that the bull market is coming to an end. What I feel is going to unfold is similar price action we say from Aug 2015 crash – Feb 2016. Big price rotation, and elevated volatility. And this time, stocks may not find support at the lows created this week and trigger the first leg down in a new bear market.

It’s likely going to take most of 2018 to form and unfold, but we aware…

Join us at Technical Traders Ltd. Wealth Building Newsletter and take advantage of the next major trend changes and profit.

Chris Vermeulen
www.TheTechnicalTraders.com

We’re certain that many of you are asking yourself this question after seeing the markets rotate to the downside so hard recently.  If you had been reading our past analysis for the early portion of 2018, you would likely know the answer to this question. If not, this research article will assist in your understanding of the market’s rotation and what to expect over the next few weeks/months.

We called a market advance in early 2018 nearly three weeks before the end of 2017.  We also called the current move, lower, at that same time.  Recently, we’ve made calls regarding the US Dollar, metals markets, and natural gas that have played out exceptionally well for our members.  Now, we’ll show you what to expect in the markets for the next few weeks.

First, we want to alert you that this downside move in the US majors is, in our opinion, a rotational motion to establish support for a bigger and stronger upside leg resumes.  We are certain that others will be posting research calling this a “major top” and warning of extended downside risks.  In reality, that analysis could be true if the markets completely fall apart or some external factor drives the market below critical support levels.  But right now, this is not the case and we don’t see it playing out in this form because many economic fundamentals are pointing to much higher price levels.

The NASDAQ Daily.  We can see the beginning of 2018 started with a massive upside rally originating near the $6400 price level.  Currently, the $6800~6900 price level is our “upper boundary” from our original analysis prior to the end of 2017.  When the price level reached these levels, we were certain that the pullback would be exaggerated as well.  Thus, this move lower, last Friday, is a perfect price reaction to the extent of the rally that started 2018.

At this time, though, we are moving right into our “upper boundary” range and most of our readers want to know what to expect next.  In our previous research, we identified many key dates that we thought would play out as critical price rotation dates.  Additionally, our cycle analysis dates assist us in understanding broader cycles.  Our current analysis is that the downward price cycle in the NQ will stall near the $6668 price level and extend into a sideways price channel till near February 21st.  Near that time, February 21st, prices will likely begin a new advance higher with the potential for an explosive rally to the upside which should end near March 15th.

After the March 15th cycle top, we will have to review the market setups then determine what is the likely outcome.  Overall, we believe the markets will rotate lower, again, in a similar manner to how they have moved in the past year plus.  Each move of 4~7% lower has been a measured price rotation that supports a further price advance.  We don’t believe there is any reason, currently, to be concerned about critical market failure.  We are watching our sources for early warning signs and are paying very close attention to China and the EU.

Lastly, we wanted to share with you a larger perspective of the market’s rotation as it plays out over the next few months.  April and May are always somewhat interesting in the markets because US citizens are dealing with the IRS/TAX issues at that time.  Additionally, the markets will likely consolidate into the lower volume Summer trading.

Our expectations are that the US Majors will move broadly higher towards the March 15th peak, then rotate lower for a week or two, then begin a move higher again ending near April 15th.  All of this analysis is based on our research of cycles and price modeling systems.  This allows us to see into the future a bit with some basic understanding of what is likely to happen.  Yet, we can’t be 100% certain all the time, in fact, we re-analyze the markets daily and our forecasts slowly change as the markets evolve which is why it’s critical to receive our up-to-date research each week.  The best we can do it to make educated expectations and make trades that provide us with the advantage over the markets.  Our most recent trade in DUST shot up 11% in less than 2 days.

forecastsso

All traders must understand that the global markets are reacting to the new US President and his new business-friendly policies.  Overall, there are major cycles still at play in all the markets and they may become extended in some form or another.  Yet, these cycles are still fundamental to the operations of global economics.

As you can see from the following image below, the current market cycle is well within the topping range and has been pushed deeper into the topping range by recent policy.  It is our opinion that without these policy changes and the new US President, we would have already been in a major market correction (bear market) by now.  This cycle is still very relevant and important.  At some point in the future, this will become critical for all investors.

If you find our research and articles helpful and insightful, then please visit Technical Traders Ltd. to learn more about our service that provides daily forecasts and swing trade alerts for stocks, ETF’s, and index futures and commodities to traders and investors.

Our objective is to help you find opportunities and success each and every day.  We deliver our Daily Market Video early each morning telling you what to expect in the markets each day and we deliver text-based updates throughout the day (as needed) to alert you to opportunities.  Try joining for one month to see how we can help you become a better and more successful trader – visit www.TheTechnicalTraders.com today.

53 years experience in researching and trading makes analyzing the complex and ever-changing financial markets a natural process. We have a simple highly effective way to provide our customers with the most convenient, accurate, and clear market forecasts available today. Our stock and ETF trading alerts are readily available through our exclusive membership service via email and SMS text. Our newsletter, Technical Trading Mastery book, and  3 Hour Trading Video Course are designed for both traders and investors. Also, some of our strategies have been fully automated for the ultimate trading experience.

Chris Vermeulen

53 years experience in researching and trading makes analyzing the complex and ever-changing financial markets a natural process. We have a simple highly effective way to provide our customers with the most convenient, accurate, and clear market forecasts available today. Our stock and ETF trading alerts are readily available through our exclusive membership service via email and SMS text. Our newsletter, Technical Trading Mastery book, and  3 Hour Trading Video Course are designed for both traders and investors. Also, some of our strategies have been fully automated for the ultimate trading experience.

Become A Profitable Technical Trader Today and Enjoy the Experience – Click here

Just a few days ago we alerted our members and followers to a massive setup in the Palladium market that had not been seen in years.  This chart formation provides an incredible opportunity for a trader to take advantage of and profit from the expected price decline.  We alerted our members and followers on January 24th of this move.

As of today, Palladium has rotated downward by over 9% from the recent highs and should continue to move lower as this multi-month rotation extends. Even though this initial move lower (-9%) reaches our initial predicted target levels, we still believe support won’t be found till prices reach near the $1000 price level.  If that support fails to hold, the price of Palladium could fall to the $900. This total move could be over -20% by the time this downward swing ends.

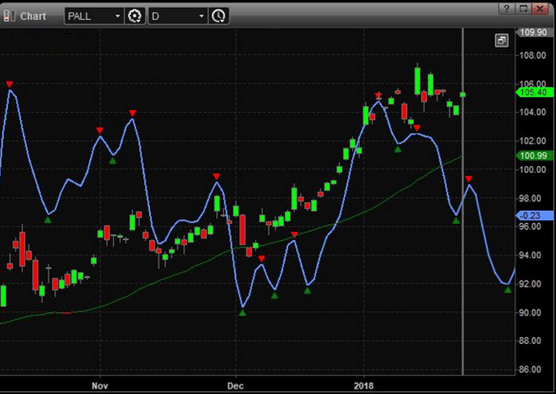
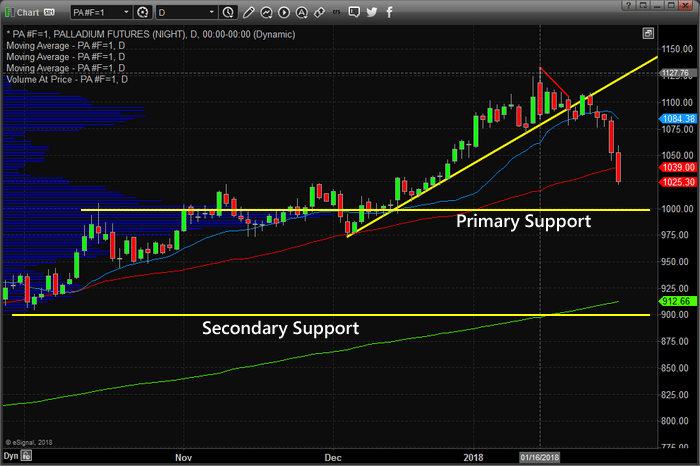
As an additional bonus, the other metals and Miner ETFs are starting a move in correlation with this massive rotation in Palladium.  The aggressive move in Palladium may become a catalyst for the other metals and miners to sell off further.

We warned weeks ago about this cycle top in gold and how it should rotate lower and move to near $1300 before finding support.  This move has just started really and would equate to a -3.8~4.2% downward price correction.

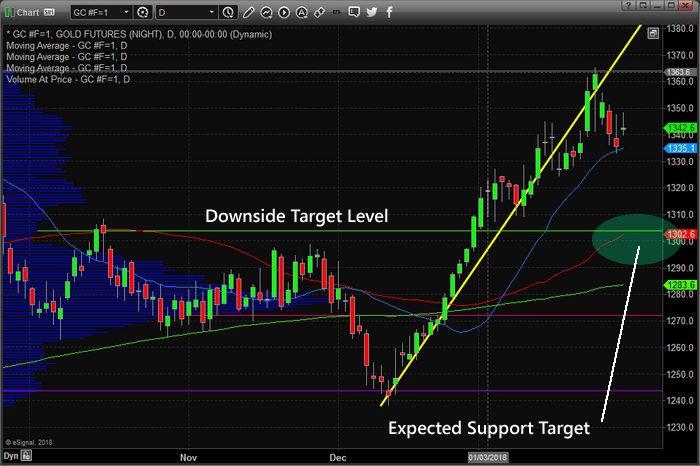
The ability to see these moves and act on them provides our members with the ability to take a single trading signal and deploy multiple successful trades from it.  We got our member’s long DUST near the very bottom of the market in anticipation of this move in the metals markets.  Knowing that this move was set up and that it could be somewhat aggressive, we simply waited for the proper setup and trigger to alert our members.

The overall potential from our DUST trade remains substantial.  Currently, we have already locked in +11% for our members and we believe the final move could be much larger.

The reason we are alerting you, today, of the progress of our calls, is that the market conditions are changing, and these types of trade setups are going to happen every month and a lot of money can be made by taking advantage of them each month. Join our Wealth Building Newsletter at www.TheTechnicalTraders.com and let us boost your trading returns with our daily analysis video, market updates, and trade alerts.

We just closed out another winning trade and members locked in a quick 9.1% profit with falling price of natural gas.

JOIN US TODAY AND BECOME A WINNING TECHNICAL TRADER – CLICK HERE

Chris Vermeulen
Founder Technical Traders Ltd.

A week ago we saw natural gas hit resistance and our cycle analysis also indicated the timing was about right for the price to start to fall.

Here is what we saw and sent to our subscribers: 

Fast forward a few days… the chart below shows you our updated technical analysis and prediction – Nat Gas Bottoming.

Today we issued a CLOSE POSITION alert to subscribers for a clean and simple trade.

BECOME A TECHNICAL TRADER TODAY
AND PROFIT! – CLICK HERE

Recently we called the top in gold, silver, miners, and palladium. This was based on several technical indicators including our cycle analysis.

Below is a quick snapshot of how we and our members profited from the recent drop in precious metals.


BECOME A TECHNICAL TRADER TODAY
AND PROFIT! – CLICK HERE

In this short conversation, we talk about Palladium and how it topped last week, and this metal has already dropped 5.5% in value since then.

We also mentioned a few days ago when gold was testing key resistance that traders should expect a correction in gold and mining stocks. This week we already locked in a quick 11% profit with DUST inverse ETF for gold miners and there is likely more selling to come!

Our articles, Technical Trading Mastery book, and 3 Hour Trading Video Course are designed for both traders and investors to explore the tools and techniques that discretionary and algorithmic traders need to profit in today’s competitive markets. Created with the serious trader and investor in mind – whether beginner or professional – our approach will put you on the path to win. Understanding market structure, trend identification, cycle analysis, volatility, volume, when and when to trade, position management, and how to put it all together so that you have a winning edge.

JOIN FELLOW TRADERS AND PROFIT – CLICK HERE

How sensible is it to invest in gold? There is no blanket answer to this frequently asked investor question. Much more depends on what you personally expect from an investment in gold.

10 experts give their blunt opinion about investing in Gold. They talk the pros and cons of buying gold, each from their own perspective.

By Chris Vermeulen – Chris Vermeulen is the founder of Technical Traders Ltd. He is an internationally recognized technical analyst, trader, and author of the book: 7 Steps to Win With Logic.  and  his newsletter www.TheTechnicalTraders.com

There are really only a few short and simple answers to the question why you should consider buying Gold? Investing in Gold provides a hedge against risk, capital preservation and opportunity for returns.

First, Gold, historically, has been and will continue to be the basis of physical wealth for the foreseeable future. Currently, Gold and Silver are relatively low cost compared to other assets offering similar protection.  As of right now, Gold and Silver are nearing the lowest price ratio levels, historically, that have existed since 1990. This means, the relationship of the price ratio for Gold and Silver are comparatively low in relationship to how Gold and Silver are priced in peak levels. So, right now is the time to be acquiring Gold and Silver as a low price hedge against another global crisis event or market meltdown.

Second, the fact that the Gold and Silver price ratio is historically very low (meaning they provide a very good hedging opportunity at historically very low price ratio levels) also means that cash can be traded for physical gold with very limited risk and provide an excellent hedge for inflation, global market crisis events and as long term investments. Taking advantage of the current market conditions, one has to be aware that crisis events do exist and present a clear risk to future equity investments. One could decide to risk further capital hedging with options or short positions as risk becomes more evident, but these are inherently more risky than a physical Gold or Silver investment. Physical Gold or Silver, especially rare coins which include greater intrinsic value, can provide real capital, real gains, real hedging of risk and real return – whereas the short positions or options are only valuable if the trade is executed to profit.

Lastly, Gold and Silver are very limited in supply on this planet and, unless society decides that Gold or Silver is absolutely worthless as a substance, will likely continue to increase in value. News that China and Russia are acquiring hundreds of tons of gold each year in preparation for a gold based currency are another set of reasons that you should consider starting your own physical hoard of precious metals. The most important thing for you to understand about owning physical Gold and Silver is that it is a protective investment that can be liquidated or resold at almost any time in the future. It can be traded, held, secured and transported easily. You can physically take possession of your Gold and Silver and be assured that through any banking crisis, global market crisis or major global event, you have enough physical precious metal to operate in a crisis mode and likely attain great wealth/gains in the process.

Think of physical Gold and Silver like an “emergency kit”. You hope you never need it, but when you do need it, you had better be prepared and have set aside some physical holdings before the crisis event happened. Out here in California, we keep “Earthquake Kits” with emergency supplies, water, lanterns, food and other essentials. Well, guess what is included in my Earthquake Kit? Yup – Gold and Silver in proper quantities that I could barter and trade for items that are essential.

The point of my post is that I can think of no reasons why anyone would not want to attain some physical Gold and Silver at today’s prices to protect against known risks, provide a hedge against inflation and crisis events and to protect wealth from what we all know will happen in a crisis event – the banks will close or limit cash availability (think of Greece). So, it is really up to you to determine if and how you want to prepare for what could happen in the future. Will you have your “emergency kit” and be prepared or not?

You can read more expert opinions on what makes gold a sensible investment – Click Here

GET CHRIS’ TRADE ALERTS HERE

We’ve been warning our members that this move was going to happen and it looks like it is just starting to initiate.  The US Dollar and Metals markets are about to rotate in dramatic form over the next few weeks – possibly months.  Right now, what we can tell you is that our cycle analysis and adaptive learning models are showing we are in for a very dramatic move in these markets.

This first chart is a GOLD Weekly chart showing our adaptive learning price modeling system and the predicted price activity going forward.  One can easily see this weekly double top formation is predicting prices to drop by nearly 5~8% over the next few weeks before basing near the $1250 to $1275 levels.  This should be a very clear warning to metals investors that Gold and Silver are setting up for a lower price rotation before the next big move higher.


This next chart is a GOLD Monthly chart and one can easily see the adaptive learning modeling system is predicting massively lower prices over the next few months.  We would caution our reader that these dramatically lower prices (toward and below $1000) would be an incredible downward move in the metals.  It would also indicate that the US and global economies continue to “melt-up” extensively over the next few months. We believe the downside rotation is accurate, yet we don’t believe prices will fall below $1000 within 2~3 months in Gold.  Although, one can never accurately predict the future with any degree of certainty.


This next chart of a Daily Palladium chart showing our cycle analysis.  Once can clearly see the relationship between the cycle levels and price activity.  Currently, the cycles are showing use that price is weakening and that a lower price cycle is setting up to drive prices back to near of below $100.  All of the metals markets are setting up like this currently and Silver is the only metal that shows the potential for a muted downside price swing.


This last chart of a Daily US Dollar cycle analysis chart showing what we believe will be a primary driver of the rotation in the metals markets – the predicted US Dollar price advance.  Take a look at this chart and see the aggressive cycle levels that are expected to happen in the immediate future?  This type of advancement is usually associated with a fairly dramatic upward price move.  We expect this move to mature over the next 2~3 weeks culminating in a general market top formation for the US majors near March 15~19, 2018 – as our earlier research has shown.


You don’t want to miss this move, folks.  Visit www.TheTechnicalTraders.com to learn how we can assist you in finding great trades and profiting from these future moves.  Please take a few minutes to read some of our research reports from the beginning of 2018 to see how well we’ve been calling these market moves weeks in advance.  If you are a GoldBug or you want to find new opportunities in the markets, visit www.TheTechnicalTraders.com to learn how we help you achieve success.

Chris Vermeulen

Our articles, Technical Trading Mastery book, and 3 Hour Trading Video Course are designed for both traders and investors to explore the tools and techniques that discretionary and algorithmic traders need to profit in today’s competitive markets. Created with the serious trader and investor in mind – whether beginner or professional – our approach will put you on the path to win. Understanding market structure, trend identification, cycle analysis, volatility, volume, when and when to trade, position management, and how to put it all together so that you have a winning edge.

JOIN FELLOW TRADERS AND PROFIT – CLICK HERE