Seasoned investors understand that investments which are rocketing to new highs and all over the news will eventually fall out of favor and become a the poor performer, unwanted by market participants.
So it only makes sense that the underperforming investments will some day come back to life and provide opportunity once again. I covered this unique stage analysis in great detail in another report linked below.
If you want to see my forecast and charts I did on June 26th, 2013 pointing to the key investment levels for precious metals and miners which by the way have been dead READ HERE.
Current Stock Market & Commodity Investment Analysis
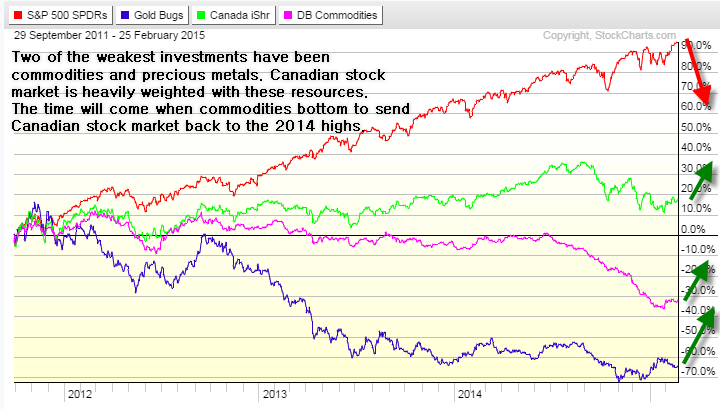
Two of the weakest investments have been commodities and precious metals since 2011. The Canadian stock market is heavily weighted with these resource stocks and is the reason for its under performance when compared to the SP500.
The time will come when commodities bottom and this will send the Canadian stock market back to the 2014 highs or better.
Take a look at the chart below. You will see the SP500, gold miner index, Canadian market, and the commodity index. What you notice see is that the US stock market has been the hot investment of choice, while commodities and precious metals have been falling for years.
No one is excited about investing in commodities or precious metals, and it makes sense. Anyone holding these investments has had a terrible couple of years and lost most of their capital. The last thing they want to do is buy more.
The good news is that this mind set eventually creates huge opportunities for the savvy, patient, investor like you and I. The hardest part is waiting for the psychology of investors to be completely out of favor, and only then can an investment bottom. This often takes years, and it has been for resources.
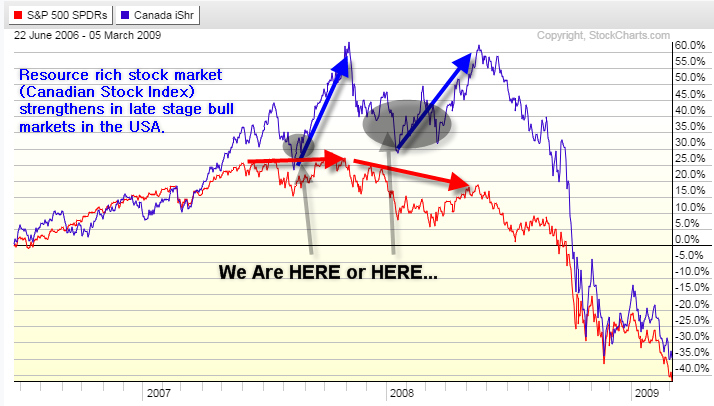
The 2007-2008 Resource Double Top and Drop & Gold Forecast
Bull market tops take months 6-12 months to form before price truly rolls over and starts a bear market. Most traders and investor try to pick tops but because this process is so painfully long, most get shaken out or give up well before the top has completed it’s topping phase.
What I am interested in is the Canadian index and resource type plays. The US stock market looks and feels as though it’s trying to form a topping phase but it is at best 6-12 months away from being a confirmed bear market.
Until then, I feel the US stock market will struggle and the focus should be put on investments that come to life during this stage of the stock market and economic life cycle.
The Dead Always Come Back To Life for One More Rally
In short, I feel resources and the Canadian stock market will become strong areas of the market going forward several months. There are a few ways to play this, and timing will be crucial. My gold forecast I gave to subscribers today for short term trading looks like it could be a 25% mover.
https://thegoldandoilguy.com/wp-content/uploads/2014/03/bullmarket.jpg194259adminhttp://www.thegoldandoilguy.com/wp-content/uploads/2014/11/tgaoglogo.pngadmin2015-02-26 03:03:072015-02-26 03:04:14Money Will Rotate Into These Dead Investments
As you may or may not know I have a passion for flying planes. As a kid I built and flew dozens of R/C planes. The two most enjoyable aircrafts I flew were the F-15 Fighter Jet, the acrobatic Extra 300, and an amphibious plane called the LazyBee for water take offs and landings.
In fact I became a licensed pilot at the age of 16, before I was legally able to get my drivers license.
Ok, enough about me… let me explain this exciting and rare investment opportunity available through me should you want to get involved and own a stake in the first new viable amphibious six person plane designed in over 60 years.
It caters to the adventurous wealthy upper class to simply explore and have fun, visit the cottage, fish in remote lakes etc… But more importantly it has incredible potential for other commercial missions such as surveillance, medevac, re-supply, and transport.
IT LANDS SAFELY ON WATER, SNOW, OR ANY SURFACE WITH THE LANDING GEAR IN ANY POSITION!
I have been following this company closely for a few years and have become close friends with the team responsible for designing this aircraft. The plane has blown me away in terms of design, features and benefits it provides both pilots and plane owners, not to mention their dedication and passion that is inspiring and exciting to see.
Long story short, I have invested with them and I asked if I could offer this opportunity to you – they said Yes!
Having raised over $2mil already, they are looking for more investors. This team is always looking to partner with investors who share the passion for aviation and those who think they can help make the company even more of a success. But this is not required to become an investor. Once they are fully funded they will start to build the first prototype to kick start the sales process and generate big returns for us investors.
The minimum investment amount is small and the potential returns, and extra bonuses you receive as an investor/partial owner of the aircraft company is very exciting!
I urge you to take a look at this incredible plane. Be sure to enter your name and email in their “Join The Series A Investment Round” even if you just want to be kept up to speed on their progress.
We talked with the Gold and Oil Guy today, Chris Vermeulen. He says that Gold is still in a bear market, like it has been for the past three years. There’s an opportunity to pick up a quick profit when it rebounds from its current plunge, but don’t be fooled. It’s all setting up very nicely for the ultimate bull market that’s getting closer. Same with the much maligned Toronto Venture Exchange (TSX:V), which is at record lows due to its composition of miners and resource companies. Chris believes that when it comes back, it will come back very big, so consider the ETF. Chris is very bearish on Oil and doesn’t see it for quite some time, so don’t chase it lower. Believe the technicals, not your heart. Chris also runs an automated trading system that can trade for you on autopilot.
https://thegoldandoilguy.com/wp-content/uploads/2015/02/automated-trading-system-interview.jpg159160adminhttp://www.thegoldandoilguy.com/wp-content/uploads/2014/11/tgaoglogo.pngadmin2015-02-24 10:19:362015-02-23 16:28:46Gold Still in a Bear Market, But Don’t Lose Hope
It does not matter what your specialty is for trading is we all have our own little trading secrets to help use better time our trades. While many day traders focus on individual stocks like aapl, goog, tsla etc… I like to focus on day trading gold.
Years ago I shared this little secret on how I get an edge day trading gold and it still amazes me how many of those people still use it today, including myself.
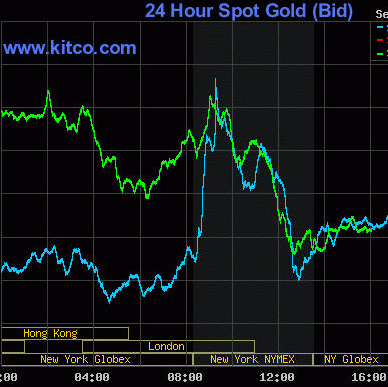
Time and time again gold traders are given great insight on how and when to day trade gold. I use the free 24hour Kitco gold chart which is shown below, and I watch it like a hawk.
It is easy to get a feel for how gold moves each day with this chart. Once you get a feel for it and see price patterns repeat themselves week after week, these opportunities quickly become an easy way to add a few trades to your day trading routine.
This Kitco day trading gold chart is an amazing tool for observing the price of gold over a 3 day time frame. What I’m going to show you is how it can provide opportunities for day trading gold.
While this chart may not look like a quality trading tool it does provides very detailed information for daytrading gold and for swing traders as they get ready to enter or exit positions. Looking at the chart below you will notice that price has similar price patterns and turning times throughout the day. Often enough the movements are very similar allowing us to take advantage of these price patterns to day trade precious metals, silver included.
Free Day Trading Gold Charts – By Kitco
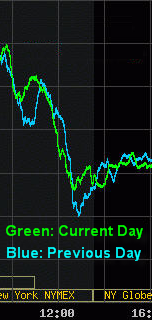
Close Up Of Spot Gold Chart
The chart below is regular trading hours only 9:30am – 4:00pm ET. You can see the price action following the previous day’s movements. Blue is the previous trading day and Green is the Current day.
When there are large price movements in gold during these hours I like to take advantage of them using the previous days price action as my guide. If you didn’t notice the Green line (Today) makes the move before the previous days move. Why? Looks to me like there are a lot of other traders out there like me getting ready for these opportunities and because its human nature to want to be first they cause the moves to happen slightly sooner than the previous day. You should factor this into your trading and be ready to take action when price looks to be starting a predicted move.
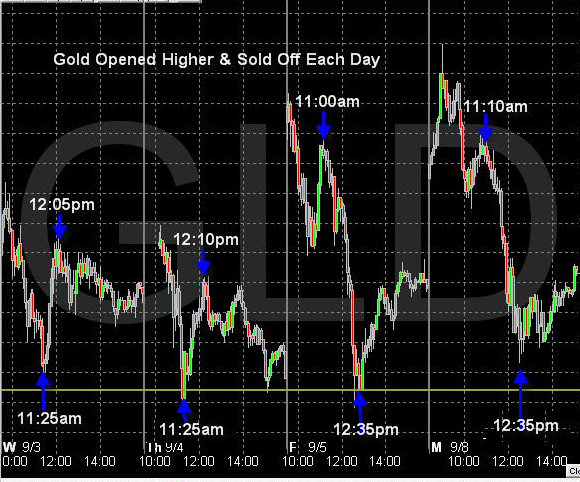
Intraday Trading Gold Chart via GLD
The chart below shows the last 4 intraday sessions for gold using the GLD ETF. As you can see these sessions had very similar price movement. This is a 5 minute chart of gold using GLD. I trade it using the 3 minute chart as it allows the best timing for entering and exiting positions and this 5 minute chart keeps my head clear for the key turning points because it is easy to get caught up in the one minute chart noise and miss the important patterns.
If you prefer trading spot golc via FOREX/CDF/Spread Betting and you are not a US resident you can use the firm which I have been using for nearly 8 years and the broker is AVAFX. The nice thing about trading this way is that you can trade 24/7, you get a lot of leverage, its commission free trading, and they have 100% signup bonuses to match the amount you deposit.
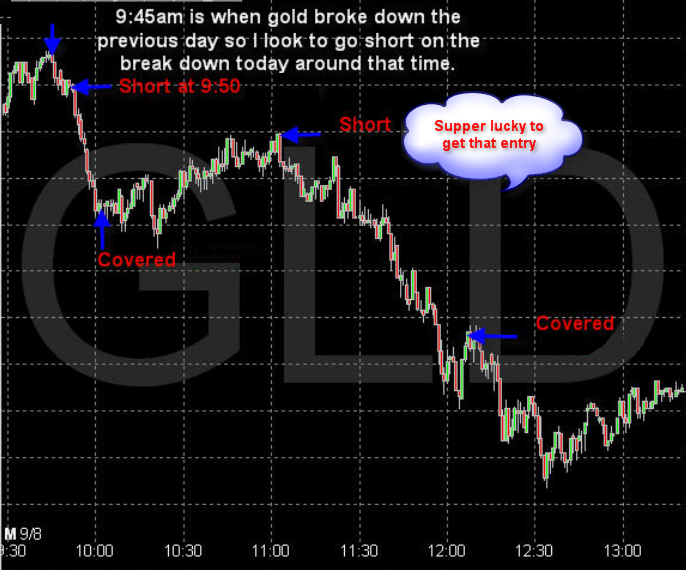
Example Day Trading Gold Chart
Above is the chart of GLD ETF and some actual trades. I am a very conservative trader and I like to lock in profits once I am satisfied with a move or if the chart shows any indication it may go against my position. I tend to exit trades a little too early but my focus is on catching the middle section of a trend because they are the safest areas to trade I think.
When there are no swing trading setups I focus on finding these intraday day trading gold patterns along with SP500 index and Nasdaq day trades to generate my weekly income.
My main focus for trading is swing trading ETFs and I have an automated trading system which i developed and it trades most of my capital on autopilot.
To sum things up I wait for a trend reversal or continuation pattern to form before I enter and exit positions. I am a firm believer of using breakeven stops, meaning once a position moves a certain amount in my favor I move my exit order to my entry price so that I have a risk free trade running. My swing trading goal for GLD ETF is 2-5% per trade which would last 2-10 days.
https://thegoldandoilguy.com/wp-content/uploads/2015/02/gold2.png320152adminhttp://www.thegoldandoilguy.com/wp-content/uploads/2014/11/tgaoglogo.pngadmin2015-02-22 07:49:412015-02-23 16:56:03His Secret To Day Trading Gold
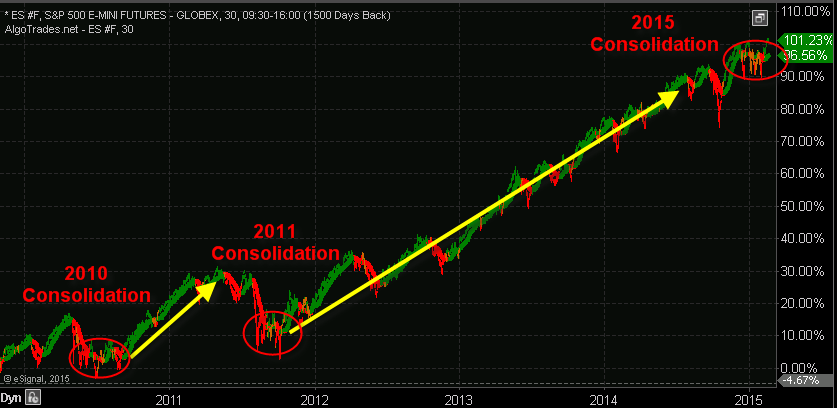
The S&P 500 stock market has been under strong rotation since mid-2014. Rotation in the stock market is when the trend changes direction from an uptrend to a downtrend or vice versa. But the really exciting part is that after strong rotations in the market similar to what we are experiencing now, the stock market always makes massive moves to profit from shortly after.
Depending how the price moves during market rotations individual traders, CTAs, hendgefunds and even algorithmic trading systems can generate large profits. But price action must be favorable to meet every ones risk/reward rules.
Unfortunately during the second half of 2014 the stock market rotation moved in a way that did not generate many trades. But no trades are better than losing trades so it’s not the end of the world, and the good news is there will always be more trades.
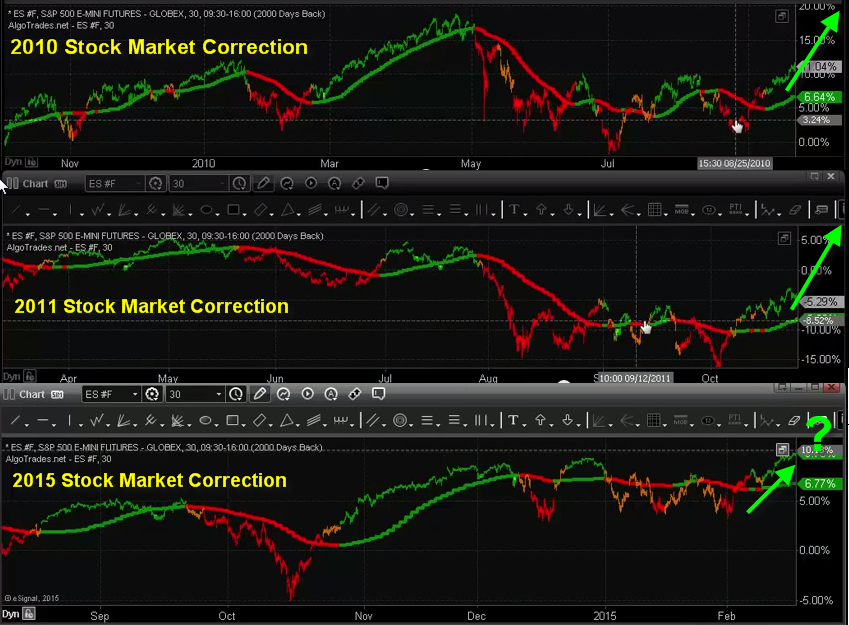
But what I want to show you here is how the current price action of the stock market we are experiencing is identical to what we saw in 2010 and again in 2011. Also keep in mind that if equities are going to have a another big move it will generate other opportunities in precious metals, energy sector, and commodities. ETF’s are what I use to take advantage of these large moves with my ETF trading newsletter.
2015 is going to be a BIG year for traders
and algorithmic trading systems!
These consolidations (pauses) in the stock market have led to substantial rallies in the stock market of 30+% gains over a six-month period and its looks like it will happen again.
My algorithmic trading system has struggled during the strong rotation of recent but so have most CTA’s and other money managers. There is not doubt that it has been hard to profit with these swings in the market because of how they formed.
When this phase of the market completes and a new trend emerges traders and algorithmic trading systems will excel and be highly active again just like they were in the first half of 2014.
https://thegoldandoilguy.com/wp-content/uploads/2015/02/corrections.png625849adminhttp://www.thegoldandoilguy.com/wp-content/uploads/2014/11/tgaoglogo.pngadmin2015-02-18 20:55:512015-02-19 18:24:452015 Stock Market Forecast And Your Trading Plan
On Wednesday, January 28, 2015 it was early afternoon during the trading day and I arose from my screens to go grab a drink out of my refrigerator. In the process of grabbing a drink, I went out to see what came in the mail and to get a few moments of fresh air before the final hours of a fairly quiet trading day were through.
Upon reentering my office, I noted that my screens were flashing red and the S&P 500 was under assault from the sell side. I scanned several independent blogs I follow for a headline and came across nothing. It was at this moment that I did the unthinkable and I turned on CNBC. I am embarrassed to even admit it frankly, because the drivel CNBC and most of the financial media spew out might as well be sales material for the sell side and their “long-term investment view that is always bullish”.
I saw the S&P 500 under pressure and then a subsequent bounce occurred. Nothing major, not even what I would call a major retracement, just some short sellers locking in a few profits I presumed. To my absolute horror, seconds later I recall seeing the headline at the bottom of the television screen on CNBC dictating that “stocks were off their lows”. It is no wonder CNBC’s ratings are absolutely terrible.
While I am picking on CNBC, the mainstream financial media is just awful. In fact, I do everything in my power to ignore all sources from televised media such as CNBC and Fox Business to written media like the Wall Street Journal. In every case, every day stocks are going higher and they can never go down. Certainly with central bank omnipotence and sorcery, it will not be long before no one has to work and we will just own long only stock portfolios. [Sarc :)]
Regardless, I am an options trader who has weathered the storm fairly well. I sell premium, focus on implied volatility, and I use probability to build my trades. My style is similar to Tom Sosnoff’s for those following him on TastyTrade or Dough, but I mix in a few twists. Regardless of my trading style, I have a strong historical track record that I am proud of which has handily beaten the markets for several years, although 2014 was one of my worst year in recent memory.
The reason I mention this is simply to state that I am a trader first, and newsletter operator second. I am getting rich with my newsletter at $20 per month let me tell you. Honestly, I just send out trades. No fluff, no nonsense. I tell it like I see it and I admit when I am wrong. My trades typically have a 60% – 70% probability of success at the time of entry based on implied volatility calculations involving probabilities. At the end of the day, I trade options because I am a junkie . . . I absolutely love derivatives and trading them.
As such, some of my recent research at various independent blogs paired with what I can see in the options marketplace has led me to believe that the S&P 500 Index (SPX) is going lower in the next 6 – 12 months. I want to be clear that I am not calling for a crash nor am I saying that the S&P 500 Index will remain under pressure, I am just simply calling for a correction in the very near future, although the situation could deteriorate into something much worse potentially.
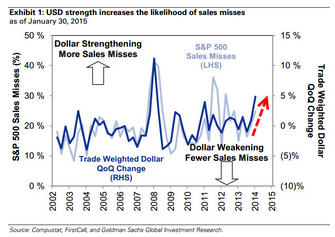
However, here are a few data points worth considering which were originally posted by Tyler Durden at www.zerohedge.com:
“Revenue results are correlated to dollar strengthening, which has led to weaker revenue results and lower forward guidance that incorporates the FX headwind.”
“Anecdotally, management commentary implies the dollar strengthening will lower revenue growth by 300-500 basis points. Foreign sales accounted for 33% of aggregate revenue for the S&P 500 in 2013. Based on our earnings model, a 10% strengthening of the trade-weighted dollar lowers S&P 500 2015 EPS by about $3.” To dig deeper into this, click HERE to view the entire article.
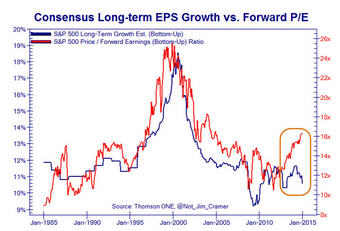
Obviously a strengthening U.S. Dollar is likely to push stocks lower based purely on earnings. However, valuations also matter and according to the same zerohedge.com article, “Consensus long-term growth estimates are slumping… which means multiple expansion is the only way to keep the dream of wealth creation alive.”
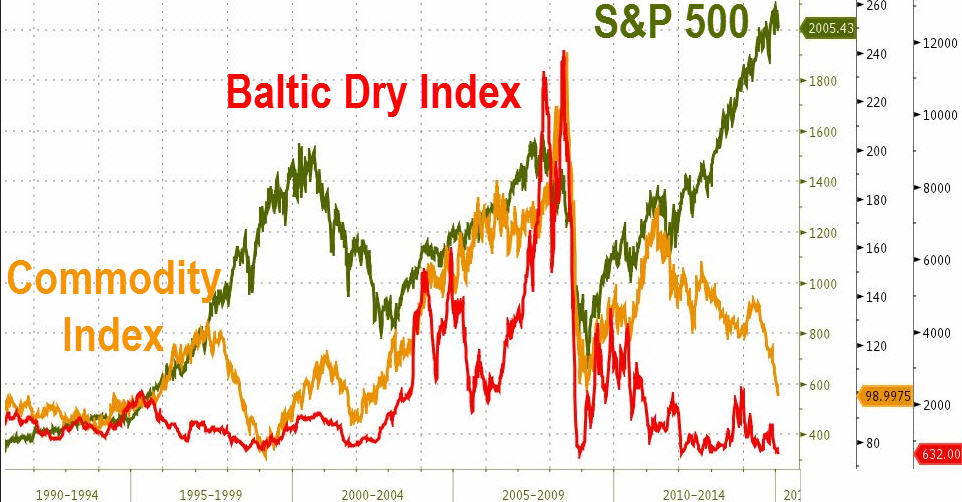
I have to say that I get a great deal of sound, independent information from zerohedge.com which I find to be very useful for formulating trades. One more interesting chart I found over the weekend in a totally different post on their blog is shown below:
So according to more than one article on zerohedge.com, the fundamental picture for earnings is being weighed down by a strong U.S. dollar. The earnings and valuation backdrop in the same article is also concerning in the intermediate to longer-term. Lastly, when looking at the correlation between the Commodity Index and the Baltic Dry Index, we see a sudden shift that places the S&P 500 Index in a major divergence compared to historic norms. Now that I have leaned heavily on zerohedge.com to handle the fundamental side of my research, it is time to dig into the derivatives side of the trade equation.
When looking at the S&P 500 Cash Index Options (SPX), another interesting observation is notable. When looking out to the June monthly expiration and Friday’s closing price in the S&P 500 Cash Index of 1,995, an interesting standard deviation skew appears. The June 1,525 Put is exactly 2 standard deviations from the current price on the downside. The June 2,200 Call is also 2 standard deviations from the current price.
This means that the market is pricing in about 205 points of upside or about 10.27% potential upside. Conversely, the two standard deviation move to the downside is roughly 400 points or about or roughly 20.04% potential downside. I would point out that the marketplace is pricing in a move of almost 2 times the severity on the downside in the S&P 500 Cash Index options. Pair this market expectation with the fundamental data discussed above, and the potential for serious downside does exist.
I want to be clear that I am already leaning short the S&P 500 Cash Index (SPX) in my portfolio as my beta weighted Delta against the S&P 500 Cash Index (SPX) is negative overall. However, I have not taken an actual short position in the S&P 500 Cash Index (SPX) or its cousin, SPY . . . at least not yet.
However, after seeing the U.S. Dollar strengthen recently I was able to enter a February call credit spread in EEM (Positive Time Decay / Profitable if EEM moves lower) for the members only portfolio. That trade will likely be closed for some strong profits in a short period of time. The option trade was taken on January 23rd for a credit of 0.37 per spread.
Members of our ETF trading newsletter also has a position in an emerging market fund that is setting up for potential 60% move!
The trade could have been closed on Friday for 0.06 debit per spread. The difference, representing the profit on the trade is 0.31 or $31 per spread. The maximum risk per spread was $113, so the actual return based on maximum risk was 27.43% based on Friday’s closing prices. While this is a great return, not every trade works this well and produces profit this quickly.
While I will be locking in profits in the EEM February Call Credit Spread early this coming week, I intend to take a similarly bearish trade in the S&P 500 in the near future. I may look to go out as far as March expiration to take in additional premium and to buy myself a little more room on my upside breakeven price. However, I will likely move the overall portfolio to a slightly more negative bias in the near future.
Going forward, when I highlight trades I intend on discussing the trade structure used in the future as well as an ongoing account as to which trades were profitable and which trades did not work. I am excited about the service I am offering and the new, no-nonsense pricing model. I realize newsletters are really a dying business model, but I simply have too much fun writing about my trades and running the service. Granted a little extra spending money never hurt anyone, but I am having too much fun to quit!
https://thegoldandoilguy.com/wp-content/uploads/2015/02/Chart1.jpg237335adminhttp://www.thegoldandoilguy.com/wp-content/uploads/2014/11/tgaoglogo.pngadmin2015-02-06 14:33:292015-02-19 18:24:26The S&P 500 Is Going Lower . . . Sooner Rather than Later


 We talked with the Gold and Oil Guy today,
  Click Here to Listen to the Audio