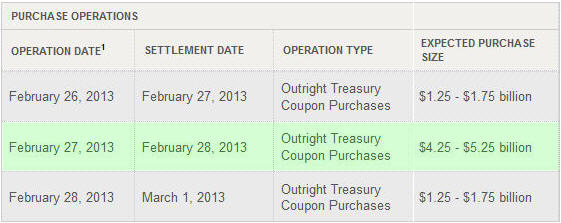
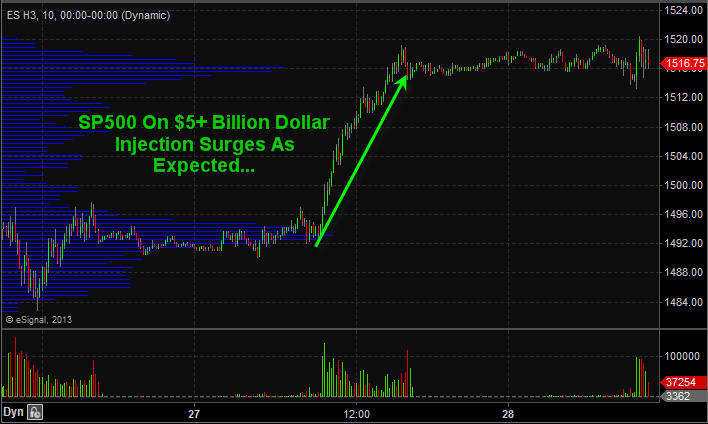
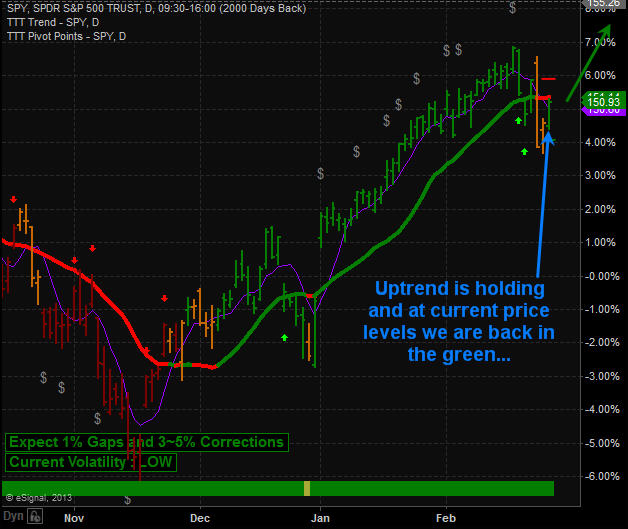
This week I talked about how the uptrend is to be the focus of trading positions until a down trend is actually confirmed via price and volume action. The SP500 was very close to reversing down this week but with the POMO’s (permanent open market operations) scheduled largest injection of money for February of over $5 billion dollars sent stocks soaring jamming stocks back up into its uptrend.
Take a look at the normal daily injections and then look at Feb 27th’s….
SP500 Futures 10 Minute Chart Zoomed Back 48 Hours…
SP500 Trend – Green, Orange, Red candles indicate trend direction
Short Term Trading Conclusion:
Following the bigger underlying trend of the market along with the big money will keep you on the right side of the market more times than not. My trading strategy which is now programmed into my trading system clearly tells me the current market trend, entry signals, profit taking, stop adjustments and exit prices.
Creating a proven trading strategy which works in all market conditions and having it programmed to do 95% of the analysis for you keep my trading emotions in check, saves me time and money and keeps things simple which is the key for long term success. So keep your eye on the POMO’s injection schedule each month for days to focus on long day trades or entry points for swing trades.
Since silver and gold topped in 2011 investors have been struggling with these positions hoping this cyclical bull market for metals continues. The simple truth is no one knows for sure if prices will continue and make new highs and those who say its a for sure thing we all know deep down is full of bull crap.
All investments move in cycles, waves or trends which ever you want to call it. The market has 4 simple yet distinct stages each require a completely different skill set and trading tactics to navigate.
Stage 1 – After a period of decline a stock consolidates at a contracted price range as buyers step into the market and fight for control over the exhausted sellers. Price action is neutral as sellers exit their positions and buyers begin to accumulate the stock.
Stage 2 – Upon gaining control of price movement, buyers overwhelm sellers and a stock enters a period of higher highs and higher lows. A bull market begins and the path of least resistance is higher. Traders should aggressively trade the long side, taking advantage of any pullback or dips in the stock’s price.
Stage 3 – After a prolonged increase in share price the buyers now become exhausted and the sellers again move in. This period of consolidation and distribution produces neutral price action and precedes a decline in the stock’s price.
Stage 4 – When the lows of Stage 3 are breached a stock enters a decline as sellers overwhelm buyers. A pattern of lower highs and lower lows emerges as a stock enters a bear market. A well-positioned trader would be aggressively trading the short side and taking advantage of the often quick declines in the stock’s price. More times than not all of stage 2 gains are given back in a short period of time. I do show some of my trade setups using these exact stages free here: https://stockcharts.com/public/1992897
Now that you know the stages and what it looks like its time to review the gold, silver and miners charts.
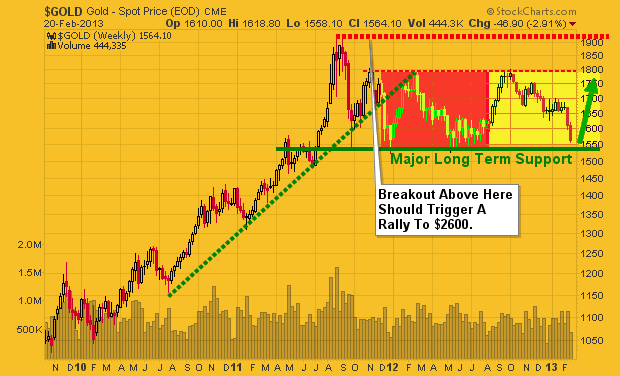
Gold Chart – Weekly
Gold has been in a bull market for several years but is starting to show its age in terms of the size of the price patterns, volume levels and extreme bullish sentiment. Back in 2011 a week before price topped we exited precious metals because the short term charts and volume levels were warning of a sharp drop. Since then I have not done many trades in either gold or silver because I do not like shorting in bull markets. Waiting for a bullish setup/price pattern before getting involved is my focus.
Gold has pulled back with a bullish 5 wave correction the last 5 months and at key support. While the long term charts are pointing to higher gold prices you must be aware that if gold and silver start to breakdown things will likely get ugly quickly. To be honest I do not care which way it goes, I just want it to either rally from support here and make new highs or breakdown and crash. Both will be very profitable if traded properly.
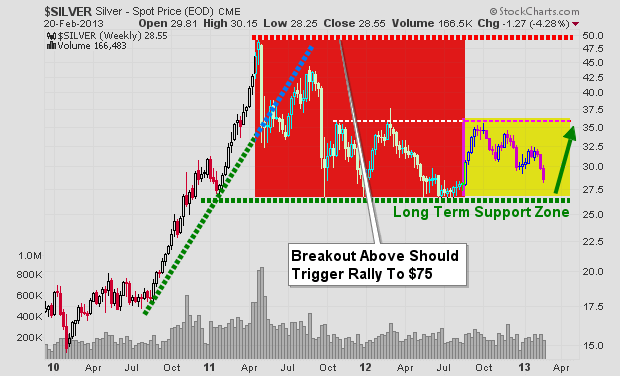
Silver Chart – Weekly
Silver has a very similar chart to that of its big sister (yellow gold). This shiny metal has the energy of a 3 year old making it a very volatile investment. I have touched on the topic of gold and silver being so called safe havens and if you have been reading my work for a while you know that any investment that can move 18-45% in value within 1 month is NOT a safe haven.
While it has done well in the past decade and boosted a lot of retirement accounts the day will come with these things collapse and most people holding them will give back most if not all the gains they had simply because people get attached to large positions and most do not know when to just exit a position.
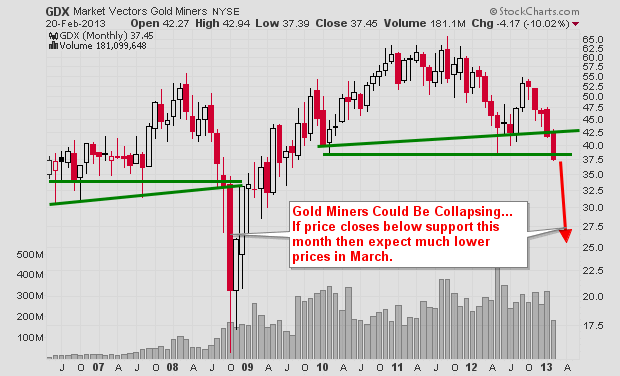
Gold Miners Chart – Monthly
This chart gives me cold sweats because I know how many people own gold mining stocks and I know how fast these things can move. If the price closed below the green support line the bottom could fall out and be very painful for those who get paralyzed by denial and do nothing but watch their accounts lose value week after week.
Precious Metals Investing Conclusion:
In short, this report is to show you the very basics of how investments move in stages. It is also to show a warning that precious metals are technically very close to a major breakdown which the big money players are watching closely. This thinly traded sector can move extremely fast when everyone rushes for the door.
Do not get me wrong, I am not saying a crash is about to happen, actually it’s the opposite. All I am doing is planning the idea in your subconscious so that if prices continue to move lower you will remember that these price levels and take action with your investments. Remember, you can always buy the investment back at any time again if the outlook changes in a week, month or year.
Get My FREE Weekly Gold, Silver and Mining Reports and Trade with the Stages: www.GoldAndOilGuy.com
Chris Vermeulen
http://www.thegoldandoilguy.com/wp-content/uploads/2014/11/tgaoglogo.png00adminhttp://www.thegoldandoilguy.com/wp-content/uploads/2014/11/tgaoglogo.pngadmin2013-02-27 20:43:072013-02-27 20:43:07Gold, Silver and Miners Remain Junk Grade Investments
Gold and silver along with their related miners have been under a lot of selling pressure the last few months. Prices have fallen far enough to make most traders and investors start to panic and close out their long term positions which is a bullish signal in my opinion.
My trading tactic for both swing trading and day trading thrive on entering and exiting positions when panic trading hits an investment. General rule of thumb is to buy when others are extremely fearful and cannot hold on to a losing position any longer. When they are selling I am usually slowly accumulating a long position.
Looking at the charts below of gold and silver you can see the strong selling over the past two weeks. When you get drops this sharp investors tend to focus on their account statements watching the value drop at an accelerated rate to the point where they ignore the charts and just liquidate everything they have to preserve their capital. A few weeks ago I posted my outlook on precious metals which seems to be unfolding as expected: http://www.thegoldandoilguy.com/precious-metals-miners-making-waves-and-new-trends/
Gold Bullion Weekly Chart:
The price and outlook of gold has not really changed much in the past year. It remains in a major bull market and has been taking a breather, nothing more. Stepping back and reviewing the weekly chart it’s clear that gold is nearing long term support. With panic selling hitting the gold market and long term support only $20 – $30 dollars away this investment starts to look really tasty.
But if price breaks below the $1540 level and closed down there on a weekly basis then all bets are off as this would trigger a wave of selling that would make the recent selling look insignificant. And the uptrend in gold would now be over.
Silver Bullion Weekly Chart:
Silver price is in the same boat as its big sister (Yellow Gold). Only difference is that silver has larger price swings of 2-3x more than gold. This is what attracts more traders and investors but unfortunately the masses do not know how to manage leveraged investments like this and end up losing their shirts.
A breakdown below the $26.11 price would likely trigger a sharp drop back down to the $17.50 level so be careful…
Gold Mining Stocks – Monthly Chart:
If you wanna see a scary chart then look at what could happen or is happening to gold miner stocks. This very could be happening as we speak and why I have been pounding the table for months no to get long gold, silver or miners until we see complete panic selling or a bullish basing pattern form on the charts. We have not seen either of these things take place although panic selling is slowly ramping up this week.
There will be some very frustrated gold bugs if they take another 33% hair cut in value… You can view some of my trading charts, setups and analysis free at my stockcharts.com list. Be sure to vote for me chartlist each day so I know its of value: https://stockcharts.com/public/1992897
Precious Metals Trend and Trading Conclusion:
In short, the precious metal sector remains in a cyclical bull market. That being said and looking at the daily charts the prices have been consolidating and are in a down trend currently. Until we see some type of bottoming pattern or price action form it is best to sit on the side lines and watch the emotional traders get caught up and do the wrong thing.
The next two weeks will be crucial for gold, silver and miner stocks. If metals cannot find support and close below the key support levels things could get really ugly fast. If you would like to receive my daily analysis and know what I am trading then check out my newsletter at: www.TheGoldAndOilGuy.com
Chris Vermeulen
http://www.thegoldandoilguy.com/wp-content/uploads/2014/11/tgaoglogo.png00adminhttp://www.thegoldandoilguy.com/wp-content/uploads/2014/11/tgaoglogo.pngadmin2013-02-21 06:11:282014-03-06 11:57:19Gold and Silver Nearing MAJOR Long Term Support