Over the past two months shares of gold (NYSE:GLD) and Apple (NASD:AAPL) have had a sizable bite taken out of their share price. Active traders along with the longer term investors have had a wild ride this fall watching these investments slide to multi month lows. The big question is when will gold and apple shares bounce?

Here we are again with another election behind us and Barack Obama in the White House again. Many think this means four years of the same thing… Printing, Inflation and higher stock prices.

Is this good or bad for Americans or the world for that matter? I doubt it, but who really knows and who cares because there is nothing anyone can do about it now. So buckle up your seat belt and focus on trading and investing with major trend both within the United States and abroad using exchange traded funds.

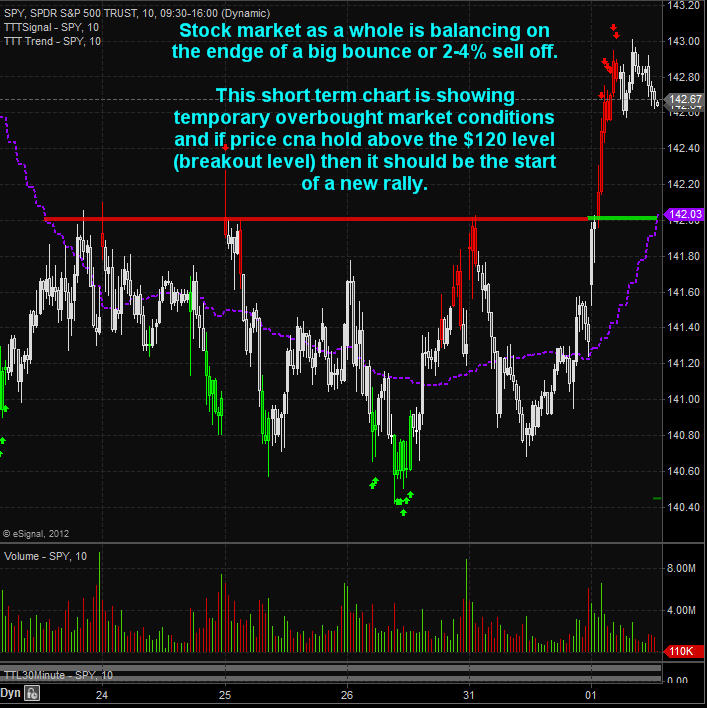
Currently the broad stock market and commodities are in a full blown bull market so the focus should be to buy the dips until proven wrong. Below are some charts showing the important breakout levels for Apple, metals, oil and key indexes like the Russell 2000.

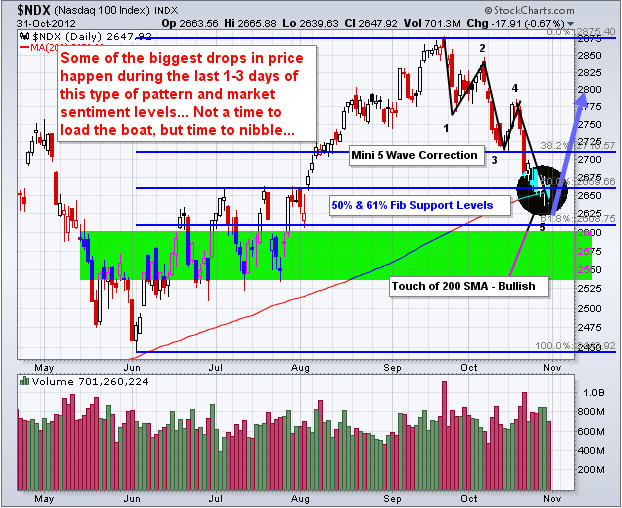
Be aware that during pullbacks which last more than a month which is the market has done, some of the biggest drops in price happen just before prices bottom… Scaling into positions is the key to minimal draw downs.


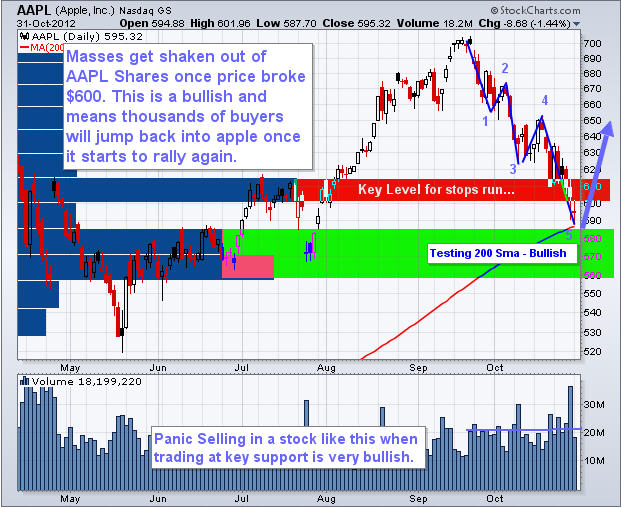
Apple Inc. – AAPL Stock Chart:

Shares of Apple clearly show the down channel which must be broken before investors start buying again. This stock seems to have big potential for $650 to be reached quickly. If Apple shares rise so will the overall stock market… Follow my live charts free here: http://stockcharts.com/public/1992897

AAPL - Apple Shares


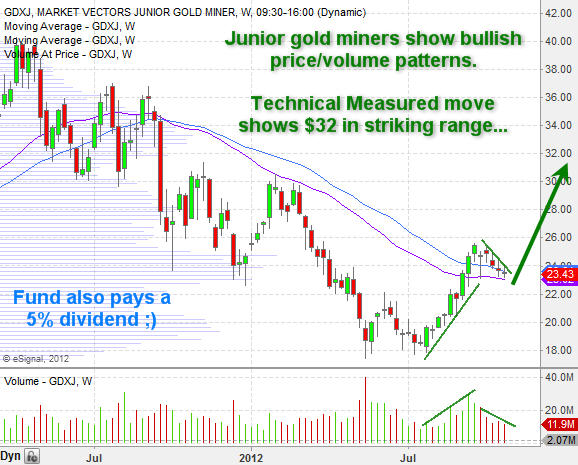
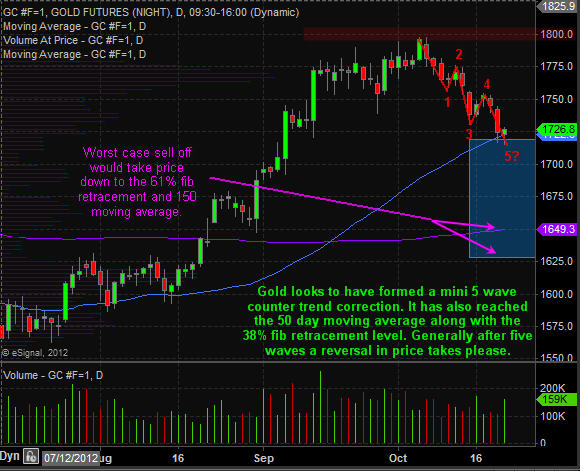
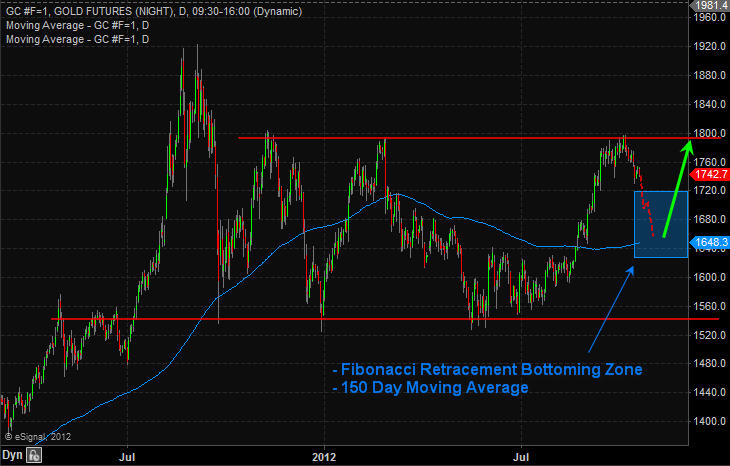
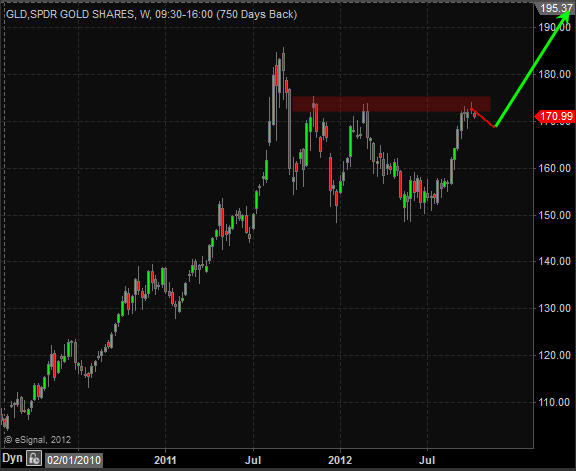
Gold Spot – GLD Exchange Traded Fund:

During August and September investors flooded the gold market in anticipation of QE3. Since then gold has been drifting lower with profit taking and because of some slowly strengthening economic numbers in the USA. Gold looks ready for a run to the $1800 but may stabilize here for a few weeks first.

Gold Breakout


Silver Spot – SLV Exchange Traded Fund:

The price of silver moves similar to that of its big yellow sister (Gold). While the charts look the same silver is highly volatile and can super charge your portfolio when metals rally.


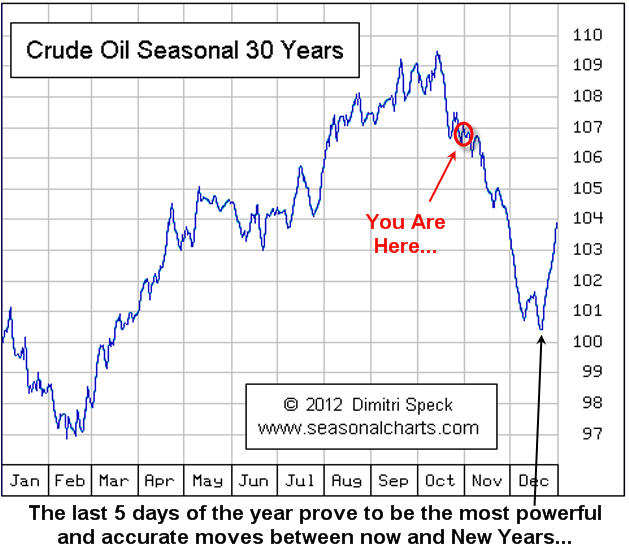
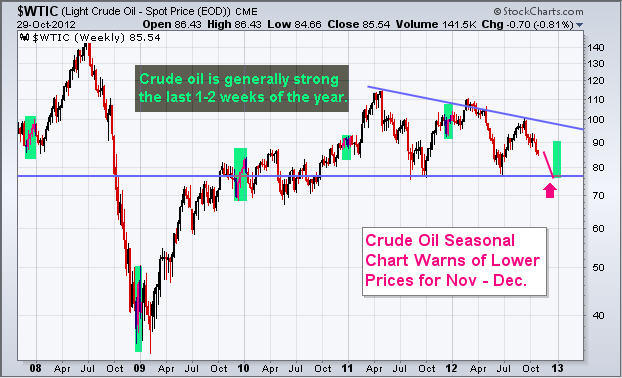
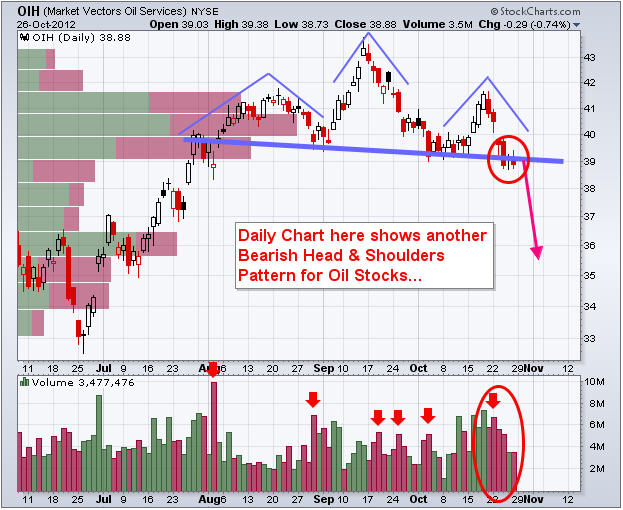
Crude Oil Spot – USO Fund:

Crude oil has been correcting for a couple months also and still has a lot of work to do before a new uptrend to be triggered. Currently oil is trading in the middle of is trading range but once the price breaks above $93 per barrel a good investment fund would be USO.

Oil Breakout


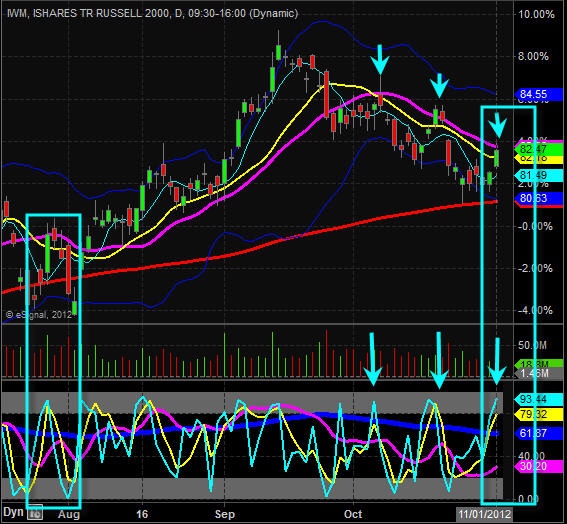
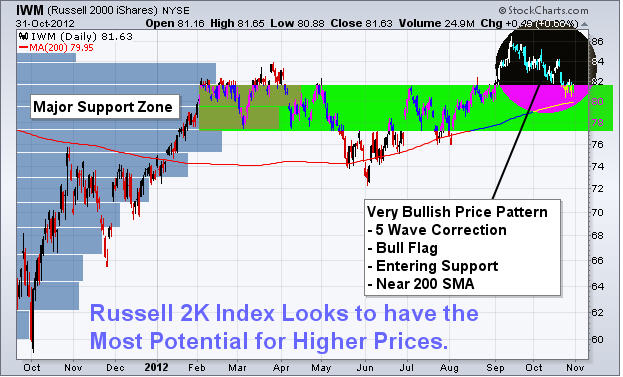
Russell 2000 Small Cap Index – IWM

Small cap stocks typically lead the broad market in both directions. They are the first to rally and the first to rollover and sell off. The major indexes like the DOW, SP500 and NYSE have not formed clean chart patterns which is why my focus is on the Russell 2000. Small cap stocks are now showing a rising relative strength compared to the SP500 large cap stocks and this is very bullish for stocks in general. The best way to trade this index is through the exchange traded funds IWM and TNA.

Rut Breakout


Post-Election Trading Breakout Summary:

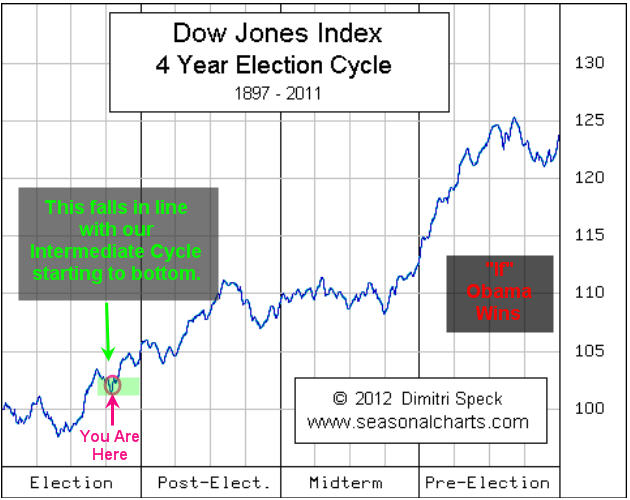
In short, history shows that equities tend to rally after an election. For a detailed outlook of how to trade stocks and indexes during the election cycles be sure to read my report “The Election Cycle – What to Expect in Stocks & Bond Prices

Chris Vermeulen
www.TheGoldAndOilGuy.com
Add to SocialTrade

By: Chris Vermeulen – www.TheGoldAndOilGuy.com

It is that time in the presidential cycle that gets everyone emotional and concerned with the future outlook of the United States. While everyone has their opinion on whom they think is best for America, I promised myself a long time ago to keep my thoughts to myself for two key reasons. ONE: only 50% of Americans will agree with me J, and TWO: I am Canadian so I do not experience what Americans go through on a daily basis.

My thinking is if Obama wins then we will see Quantitative Easing continue. And with the recent positive economic numbers on Friday it should give some confidence to investors that things are SLOWLY stabilizing (Bullish for Stocks). But, if Romney wins then we could see Quantitative Easing be cut or eliminated which is obviously bad for equities.

So, let’s just jump into the charts of what I feel will unfold in the next few days and months.

Using the season chart of the four year election cycle we can see what the Dow Jones Index has done in past election periods. Obviously every market environment is drastically different in each situation but overall we see stronger stock price. This is naturally a very emotional time for investors but once the election is finished most individuals become more confident simply because there is a leader that has four years to make things better and there is nothing they can do about it now and the campaigning and debating is over.

Dow Stocks Election

DIA – Dow Jones Industrial Average – Daily Chart:

Looking at the chart of Dow DIA Index fund you can see a 5-6 month cycle in the market which has a positive skew. Just so you understand what a positive skew is I will explain.

Positive Skew is when the market is trending up making a series of higher highs and higher lows. Because there are naturally more buyers during a bull market each cycle upswing lasts longer then when the cycle down downswing. So you get longer rallies which sends your secondary indicators (stochastics, volatility, put/call ratios, advance decline line etc…) in the overbought levels for extended periods of time. Those trying to pick a top continually get their head handed to them. The focus must be on buying the pullbacks. Keep in mind volatility is higher which meaning risk per trade is higher. Overall in the long run you stand a much higher chance of making money trading with the trend than trying counter trend trades (picking a top).

So as you can see below it looks like the stock market will be trying to put in the bottom over the next week or two which falls in line with our election cycle. It is very important to know that during intermediate cycle lows is where some of the biggest drops take place. These sharp drops are what is needed to cleanse the market one last time to shake as many traders with tight stops out of the market before it reverses and starts the next rally. I would like to see a 1-3 day market sell off as that would be the signature bottoming pattern I like to buy.

DIA Exchange Traded Fund Trading

Bond Prices – Moving Against the Norm…

Bond investors are some of the most conservative people in the market. They do not like to take risks so they dump their money into bonds to make a tiny profit in exchange for low risk (volatility). The nature of these investors put more money into bonds as we enter the election because they are nervous about not knowing who will be in control of the country.

After the election finished some money flows out of bonds and into stocks because there is now a president and direction for the country. Generally come the new year investors move to bonds as the safe haven as they try to figure out what their game plan is for new year.

So looking forward to this week and the next 2 months I would not be surprised to see bond prices rise or trade sideways while stocks move higher. This analysis is based on Obama winning. If Romney wins then I feel bonds will rally much more and stocks could sell off.

Bond Sentimentpre Election

TLT Bond Exchange Traded Fund – Daily Chart:

Here is a chart of 20+ year bonds showing a possible reversal to the upside that could trigger as soon as next week. This chart is forward looking 1 – 2 weeks. Overall the trend remains down but if Romney wins I feel bonds breakout above the red resistance levels and trigger a new uptrend. You can follow my stock charts and ETF charts live every day here: http://stockcharts.com/public/1992897

Bond TLT Exchange Traded Fund Trading

Election Year Trading Cycle Conclusion:

Next week is going to be very interesting to watch unfold. I generally do not like to trade or invest before news of this magnitude so trade smaller sizes if you do as price action could be wild.

Get my Daily Trading Analysis & Trade Setups at: www.TheGoldAndOilGuy.com

Chris Vermeulen
Add to SocialTrade

Disclaimer:
This material should not be considered investment advice. Technical Traders Ltd. and its staff are not a registered investment advisors. Under no circumstances should any content from this website, articles, videos, seminars or emails from Technical Traders Ltd. or its affiliates be used or interpreted as a recommendation to buy or sell any type of security or commodity contract.
Our advice is not tailored to the needs of any subscriber so go talk with your investment advisor before making trading decisions This information is for educational purposes only.

How to Get 50% off First StockCharts.com Monthly Subscription

Step 1: Enter Chris@TheGoldAndOilGuy.com email when joining as the person who referred you

Step 2: Enter Coupon Code BESTCHARTS and Save 50% off your first month of service.

CLICK HERE TO JOIN STOCKCHARTS TODAY

Its 1:00pm ET and volume is drying up.

We did see a nice pop this morning breaking some previous pivot highs from last week and volume looks strong. Long story short… stocks are overbought here very similar to the past two highs as seen in the chart below. The big question from here is what to do now? Well, I wanna see some bullish patterns and volume over the next 12-48 hours if we are going to be looking to get long for an intermediate rally that lasts several weeks taking the indexes to new highs.

Take a look at the 10 minute intraday chart of the past fiveOPEN trading sessions (Wed, Thurs, Fri, Wed, Today) as notice how choppy price has been…. It’s shaking traders up who do not know how to adjust their trading strategy during rising volatility and mixed market cycles. This is something I will be teaching in the near future using my own eSignal trading indicators and Signals as it has been CRUCIAL in the past 3 year to profit from and minimize losses.

SPY Index Trading - Custom eSignal Indicator

Daily Chart of my Cycles & Sentiment Indicator of the SPY:

eSignal Indicator Signals

Yesterday we saw utilities rally as fear worked its way into the market. Well today utilities (XLU) is trading lower. Interesting how the market move and why I love them so much…

Last week I mention how RIMM looked ready for a major breakout and rally. This week it has jumped over 12% which is exciting. The next to pop looks like KOL coal ETF.


One of my members sent an email asking for help and he could not have picked a better time to ask because the market is eating traders alive here…

———————————————–

MEMBERS QUESTION:

Hi Chris,
In the last week, with the chopping around, I’ve had the bad fortune of being short ES, and multiple times being stopped by a little spike, and then I am watching the market go lower without me.

Last Thursday, I put in a buy stop for 1392, and that got triggered during a spike down yesterday.  This afternoon (I live in Singapore), my sell stop of 1417 that had been set  last Thursday got hit, and I watch in frustration as ES dipped to 1412 without me.

This has been very frustrating and expensive – so I think I really need a tutorial/advice on setting proper stops.

It almost seems like someone can see my stops (set above or below what I measure to be resistance and support) and literally aims for them to take me out.

Some months ago, when this happened a lot, I stopped using stops completely.  Then got badly maimed by the Draghi and Bernanke bounces in September.

Hope this is something you can look at as an enhancement to your excellent service (and I would gladly pay for this).
———————————————–

MY RESPONSE:
Yes, stops are tough to figure out for sure. If you are getting shaken up as you stated then you are not setting your stops properly. Because of the leverage involved with futures most people put too tight of a stop at or just beyond recent pivot highs or lows… These levels are where the market makers TRY to get the price to reach on a regular basis so they end up with a huge position that is very profitable in most cased within hours. Unfortunately these positions should have been in your trading account and not in theirs.

The market moves on emotions and 95% of traders do not have a clearly documented step by step rule book to follow, which removes emotions allowing them to nail down a consistently profitable strategy and stick to it. While I already have rules for each type of trade setup use last week I took a course to help me fine tune what I have even more so I can pass along how I do things to you.  If you want to build your own documented system properly, then you really need to take Brian McAboy’s “Trading System Mastery” course. It’s a couple short manuals and 4 hours of VERY important step by step instructions on just how to document/create the perfect strategy for you.

Anyways, be sure to keep in mind that during overnight trading (After 4pm ET until 9:30am ET) is when most of your stops will trigger. That is when the market makers can walk the price up and down to these key levels and take your stops.

I focus on my stops only being active during regular trading hours to avoid most of this BS manipulation. While I am subject to price gaps using regular trading hour stops only, I know my risk and I know that an index is not going move more than 5% against me at the open in a worst case scenario. I manage my risk through position size and use wider stops thank most traders because I do not have all my money in ONE highly leveraged position.

I will put together an educational report on how, when and where you should place your stops along with how you can take advantage of it. It will take me a week or two to create but be on the lookout for it…

Learn More at www.TheGoldAndOilGuy.com

Chris Vermeulen

AAPL shares have been in free fall mode all October spooking investors with a $120 drop from the all-time high in September. As well all know, though it’s hard to follow without a proven trading strategy to keep us focused but the key is that you must buy when others are selling and then sell when everyone is buying.

Apple shares really have helped in holding the overall stock market up in the past but recently it has been a big drag on the broad market. Taking a look at the chart below you can see my analysis and thoughts of this giant.

The red horizontal line shows the key level where high volume traded in the past. For the market to reset (flush out investors/traders) it must shake as many longs out before it can start rising again. By the price breaking below that level which also happens to be a Century Number $600, most of the stops were placed down around this level. The volume spike of 40,000,000 shares clearly shows it triggered stops once that $600 level was broken. We want stops run because it give more power to the next rally/bounce.

AAPL Shares Bottoming


NASDAQ Index:

The NASDAQ has formed a similar chart pattern and is heavily weighted with AAPL shares. Trading NQ futures, QQQ, QLD or the XLK exchange traded fund as a much more affordable way to play a bounce/rally in the coming weeks.

NDX - QQQ Shares Bottoming


Russell 2000 Index:

I really like the Russell 2000 index because small cap stocks can rally hard and fast outperforming the large caps like AAPL, SP500, NASDAQ and DOW. This index is looking ripe for a bounce in the coming days which could trigger the next major rally to new highs. You can plan this index through TF futures contract, IWM, TNA, UWM exchange traded funds.

IWM - TNA Funds Bottoming


Trading Conclusion:

While this setup looks very promising because the election is almost over and the Santa Clause rally is just around the corner. Know that some of the biggest drops in the market happens during times when the market is running the stops. It is a natural tendency to take big positions which things look great, but that is not how you do it… Take calculated position sizes knowing indexes could fall another 2-3% before putting in a real washout bottom.

Get My Trade Alerts at: www.TheGoldAndOilGuy.com

Chris Vermeulen

By: Chris Vermeulen – www.TheGoldAndOilGuy.com

Crude oil has had some large price swings this year and another one may be on its way. This report shows the seasonality of crude oil along with where oil is trading and what the oil service stocks are telling us is likely to happen going into year end.

Since WTI Crude Oil topped out in September at the $100 resistance level (Century Number) many traders are looking for a bounce or bottom to form in the next week. Historical charts show that on average the price of oil falls during November and the first half of December.

The charts of oil and oil stocks shown below have formed patterns on both time frames (weekly & daily) that lower prices are to be expected. If you did not read my Gold Seasonality Report I just posted be sure to review it here: Gold Seasonal Report

Crude Seasonality

WTI Crude Oil Weekly Chart:

Here you can see that price tends to fall going into Christmas and rallies during the last week of trading. This price action falls in line with Dimitri Specks seasonal chart providing us with insight as to what we should expect. Later this week I will finish my report on the Election Cycle Seasonality report which shows weakness in the market during Oct & Nov when a president is up for re-election.

Crude Oil Price

Oil Services Stocks – Weekly Chart:

If you follow oil closely then you know likely know already that oil related stocks can lead the price of oil by a couple weeks. What this means is that if big money is flowing into oil stocks (bullish price patterns with strong volume), then you should expect the price of crude oil to rise in the coming days. That said, if money is flowing OUT of oils stocks then lower or sideways oil price should be expected.

The weekly chart oil stocks show a very large bearish head & shoulders pattern. While I do not think the neckline will be broken it is very possible.

One of the most important pieces of data on the chart is the VOLUME. Notice the lack of it… Volume tells us how much interest and power is behind chart patterns and declining volume clearly tells us these investments are out of favor currently and that big money is not moving into them.

Oil Stocks Weekly

Oil Services Stocks – DAILY Chart:

Zooming into the daily chart of the oil service stocks we can see there is yet another bearish pattern unfolding. Another head & shoulders pattern which looks as though it is just starting to breakdown as of this writing. Next support level is $35-36.

Crude Oil Stocks Daily

WTI Crude Oil and Oil Service Stocks Trading Conclusion:

Looking forward 1-2 months (November – December) taking the seasonal price swings in oil, re-election cycle seasonality and price action of oil stocks I feel oil will trade sideways or down from here. With that being said, expect crude oil to rally during the last week of the year. I hope this provides some useful info for your trading!

Get my Daily Trading Analysis & Trade Setups at: www.TheGoldAndOilGuy.com


 Chris Vermeulen Chris Vermeulen is Founder of the popular trading analysis website www.TheGoldAndOilGuy.com. There he shares his highly successful, low-risk trade ideas. Since 2001 Chris has been a leader in teaching others to skillfully trade Currencies, Stock Indices, Bonds, Metals, Energies, Commodities, and Exchange Traded Funds. Reach Chris at: Chris[at]TheTechnicalTraders.com


Disclaimer:
This material should not be considered investment advice. Technical Traders Ltd. and its staff are not a registered investment advisors. Under no circumstances should any content from this website, articles, videos, seminars or emails from Technical Traders Ltd. or its affiliates be used or interpreted as a recommendation to buy or sell any type of security or commodity contract.
Our advice is not tailored to the needs of any subscriber so go talk with your investment advisor before making trading decisions This information is for educational purposes only.

By: Chris Vermeulen – www.TheGoldAndOilGuy.com

If you own physical gold, gold mining stocks or plan on buying anything related to precious metals before year end, you are likely going to get excited because of what my analysis and outlook shows.

Since gold topped abruptly a year ago (Sept 2011) with a massive wave of selling which sent the price of gold from $1920 down to $1535, technical analysts knew that type of damage which had be done to the chart pattern could take a year or more to stabilize before gold would be able to continue higher.

Fast forwarding twelve months to today (Oct 2012). You can see that gold looks to have stabilized and is building a basing pattern (launch pad) for another major rally. The charts illustrated below show my big picture analysis, thoughts and investment idea.

Weekly Spot Gold Chart:

The weekly chart can be a very powerful tool for understanding the overall trend. This chart clearly shows the last major correction and basing pattern in gold back in 2008 – 2009. Right now gold looks to be forming a very similar pattern.

Keep in mind this is a weekly chart and if you compare the 2009 basing pattern to where we are today I still feel it could take 3 – 6 months before gold truly breaks out to the upside and kicks into high gear. The point of this chart is to provide a rough guide for what to expect in the coming weeks and months.

Gold Stock Investing

Weekly Chart of Junior Gold Miner Stocks:

If you follow gold closely then you likely already know junior gold mining stocks can lead the price of gold up to two weeks. Meaning gold mining stocks which you can track by looking at GDX and GDXJ exchange traded funds will form strong bullish chart patterns and generally start moving up in price before physical gold.

The chart below shows the junior gold miner ETF with a VERY BULLISH chart and volume pattern. Remember that gold stocks are a leveraged play on gold in most cases. For example, if gold moves up 1% we typically see GDX and GDXJ move 2-4%. Because they act as a leveraged play on physical gold smart money and big institutions start accumulating these investments in anticipation of gold rising.

GDXJ has formed a tight bull flag and the volume levels confirm there is big money moving into these investments. The first price target on GDXJ using technical analysis for a measured move points to the $32 area. Looking forward twelve months with gold trading above $2000 we could see this fund more than double in value.

Bonus: while most traders focus on GDX gold miner fund, I prefer the GDXJ fund because its almost identical in price performance BUT it pays you a 5% dividend…

Junior Gold Mining Stocks

Gold’s Seasonality:

It’s that time of year again where gold tends to move higher. Below you can see where we are and what the price of gold typically does in November.

Gold Seasonality Trading

Gold Investing & Trading Conclusion:

Looking forward one month (November) and factoring in the recent pullback in gold to known support levels along with strong buying of junior gold mining stocks, I feel gold will take another run at the $1800 level and for GDXJ to test its previous higher of $25.50 at minimum. If both those levels get taken out then a massive bull market for precious metals could be triggered. Only time will tell…

Get my Daily Trading Analysis & Trade Setups at: www.TheGoldAndOilGuy.com


Chris Vermeulen

Disclaimer:
This material should not be considered investment advice. Technical Traders Ltd. and its staff are not a registered investment advisors. Under no circumstances should any content from this website, articles, videos, seminars or emails from Technical Traders Ltd. or its affiliates be used or interpreted as a recommendation to buy or sell any type of security or commodity contract.
Our advice is not tailored to the needs of any subscriber so go talk with your investment advisor before making trading decisions This information is for educational purposes only.

The $1800 per ounce level continues to be a major technical resistance area for gold. After hovering near $1800 recently, gold moved sharply away from that level last week to close at $1735 an ounce.

Despite that, more fund managers and analysts continue to point to a bright long-term future for gold prices. John Hathaway of the Tocqueville Gold Fund says gold will reach new highs within a year. He based his forecast, like many others, on the fact that negative real interest rates look likely to persist as Ben Bernanke and the Federal Reserve continue to print money.

Believe it or not, some mainstream analysts are also touting gold’s potential. Merrill Lynch analysts point to the correlation (discussed in a previous article) between the price of gold and the expansion of the Federal Reserve’s balance sheet since the start of QE1 in early 2009.

Based on the current path of the Fed’s balance sheet expansion, Merrill Lynch came up with two longer-term targets for the price of gold. They project gold to hit $2,000 an ounce next summer and to hit $2,400 an ounce by the end of 2014.

Another way to look at gold and the Fed is the so-called gold coverage ratio. That is the amount of gold on deposit at the Federal Reserve versus the total money supply. According to Guggenheim Partners, the gold coverage ratio is at an all-time low of 17%. The historical average is about 40%, meaning that gold would to more than double to reach the average.

Looking at the Fed’s balance sheet is a new and interesting way to look at and forecast gold prices. In the past, the conventional wisdom was that gold was merely an anti-dollar play: U.S. dollar down, gold up and vice versa. But that seems to be changing…..

Reuters had some interesting data. The value of the U.S. dollar net short position fell to $6.43 billion for the week ended October 9. This is substantially down from the previous week’s net short position of $16.3 billion. At the same time, the “managed money” net long gold position in gold futures rose to its highest level since August 2011. That was the time when gold hit its record high of $1,920 an ounce.

So much for conventional wisdom. Both currency and gold traders are seeing this long-term relationship between gold and the U.S. dollar breaking down into a “new normal” of direct central bank intervention into financial markets. Gold seems increasingly to be turning into more of a safe haven play than an anti-dollar one. It seems that more investors are worried about all fiat currencies that are burdened by huge debt loads.


The Technical Take…

Below is a daily chart of gold futures. Looking at the price levels and analysis you can see that a bounce or bottom could form at any time now. Price of gold has pulled back in a mini five wave correction touching both our first Fibonacci retracement level of 38% and the 50 day simple moving average. This is the type of pullback that longer term investors like to add to their long gold position. While gold does have the potential to fall all the way down to $1625, in the long run it should continue to rise for the long term investor.

From a trader point of view, it may be worth a stab to get long gold with a very tight stop, but until we see a real panic selling day in gold where volume is high I don’t think the final bottom is in yet.

Spot Gold Bullion Investing

Chris Vermeulen

Despite the decline this past week, gold seems to be regaining favor with global investors, as just a week earlier it had been flirting with the $1,800 an ounce mark. Quite a change from the sentiment in early summer when some investors were questioning whether the yellow metal’s decade-long bull run was coming to a close.

The rebound in investor sentiment toward gold, of course, coincided with the launching of open-ended QE3 (or QE infinity) by the Federal Reserve. Since then gold has “barely paused for breath. It has, as discussed previously, touched all-time highs in terms of euros or Swiss francs.

QE3 certainly seemed to worry some investors. These people moving into gold are concerned about things such as competitive devaluations and the debasement of currencies in an attempt to pay back enormous debt loads with a cheaper currency. This road – currency debasement – eventually leads to inflation most believe.

So it is really is not surprising that, according to UBS, investors in exchange traded funds raised their holdings by 158 tons since the beginning of August to a record 2,681 tons of bullion recently.

Many of the world’s best investors are in agreement with the average person putting his or her money into gold. The list of names is impressive: George Soros, John Paulson, Ray Dalio and Bill Gross.

Ray Dalio, founder and chief investment officer of Bridgewater Associates – the world’s largest macro hedge fund, told CNBC viewers recently: “Gold should be part of everybody’s portfolio. We have a situation now when you have too much debt. Too much debt leads to the printing of money to make it easier to service. All of those things mean that some portion [of a portfolio] should be in gold.”

Dalio’s conclusion? “Only gold and real assets would survive.

All of this positive macro news about gold has managed to influence the gold chart too. According to asset manager Blackrock, “the gold chart has turned decidedly bullish.” Blackrock was speaking about the so-called “golden cross”. That occurs when the 50-day moving average moves above the 200-day moving average.

Blackrock noted that the last time gold’s chart looked so good was shortly after the Federal Reserve announced QE1, the first round of money printing. It said that if gold does the same thing it did back then, the price of the precious metal will hit $2,400 an ounce by next summer. Of course, macro factors like Chinese and Indian demand for physical gold will play a major role in whether we reach those lofty levels.

While I am bullish on gold longer term the chart patterns, volume and sentiment for both gold and silver are overwhelmingly bearish looking for the next couple weeks. I sharp pullback is likely to unfold before they take another run at resistance and breakout to new highs.

Gold Bull Market Investing

Chris Vermeulen

Bill Gross is one of the most recognizable names in the investment world. He is the founder and co-chief investment officer at bond fund giant PIMCO. His long-term track record regarding bonds is among the best and he still runs the world’s biggest bond fund, the PIMCO Total Return Fund.

Gross is also known for speaking quite bluntly about the United States’ growing debt problem. His latest monthly market commentary came with a warning for the U.S. and investors alike. Gross stated that a number of recent studies have concluded that “The U.S. balance sheet, its deficit and its ‘fiscal gap’ is in flames and that its fire department is apparently asleep at the station house.”

The recent studies Gross pointed to came from the Congressional Budget Office, the International Monetary Fund and the Bank of International Settlements. The studies calculated that the United States needs to cut spending or raise taxes by 11% of GDP over the next 5-10 years. This translates to $1.6 trillion per year. That compares to the country’s 8% of GDP deficit in 2011. Those numbers put the U.S. in the ‘ring of fire’ with other countries with similar fiscal gap sizes. These countries include Greece, Spain, Japan, France and the U.K.

Gross warned that the U.S. debt problems have put the country in this “ring of fire” that will burn most investors. The only investors who will not get “burned”? He says the lucky few will be those that are protected by gold and other real assets, protected from a severe U.S. dollar depreciation caused by the Federal Reserve’s money printing.

In a white paper titled “GOLD – The Simple Facts” posted on PIMCO’s website, PIMCO analysts Nicholas J. Johnson and Mihir P. Worah also said some interesting things. Here is an excerpt, “Our bottom line: given current valuations and central bank policies, we see gold as a compelling inflation hedge and store of value that is potentially superior to fiat currencies.” They pointed out the positive supply/demand characteristics of gold as a big plus in their scenario. The PIMCO analysts went on to say, “We believe investors should consider allocating gold and other precious metals to a diversified investment portfolio.”

That is quite a statement coming from a “mainstream” investment firm. Wall Street’s usual reaction to gold is that it is a barbarous relic whose only use is in jewelry and that no sane investor should put any money into it, even paper gold instruments such as gold ETFs like the SPDR Gold Shares (NYSE: GLD) and others.

After Bill Gross’ bullish words, gold prices were trading a 7-month high on Thursday before falling Friday to finish the week at about $1776.00 an ounce.

Gold Investing Newsletter

Chris Vermeulen