Chris Vermeulen – www.TheGoldAndOilGuy.com

One of the top stories in the financial markets in 2012 has to be the stagnation in the price of gold at around $1600 an ounce, which is down approximately 17% from its peak at $1920.30. Those bullish on the yellow metal have been disappointed in gold’s performance while those bearish on the shiny metal have reveled in its stagnation, saying that gold’s status as a safe haven is over.

What is behind gold’s sluggish performance in 2012? There are several reasons, but one of the key fundamental reasons has been the lack of demand from traditionally the largest buyer of gold on the planet – India (although China will surpass it this year). India bought only 181.3 tons in the second quarter of 2012, a 2-year low, according to the London-based World Gold Council.

There are several factors at play as to why Indian demand for gold has fallen. One reason is the sharp drop in the value of its currency, the rupee, which is down by 25% versus the U.S. dollar this year. This decline has kept gold prices high in relative terms while the actual dollar value of gold was falling. Perhaps even more important has been the ‘war’ declared on gold by its central bank which has blamed all of the country’s economic ills on Indian citizens’ traditional buying of gold. In an attempt to slow down gold and silver imports, the Indian government has imposed new taxes on the purchase of these precious metals.

But even though demand for the precious metal is way down in India, the situation still offers hope for gold bulls. Why? Because we’ve been here before – in 2009 to be exact. In early 2009, the Indian economy and rupee tanked. Gold demand almost completely dried up. According to precious metals consultancy GFMS, Indian demand for gold in the first quarter of 2009 collapsed by 77%. For the full year GFMS said Indian consumption dropped by 19%.

Now with the Indian economy slowing to its weakest growth rate in nearly a decade and the rupee falling, we are seeing a replay of 2009. The monsoon season has been poor, hitting farmers – among the biggest buyers of gold – hard. Gold prices have hit a record high in rupee terms, and India is expected to purchase, as forecast by the World Gold Council, only 750 tons of gold, down 25% from 2011 levels. Meanwhile, the WGC forecasts that China will buy 850 tons of gold this year.

Investors should pay heed to the clues that recent history is giving us. The drop in Indian demand is simply a cyclical phenomenon due to the lousy state of the Indian economy. It will recover eventually. And when it does, look out for the fireworks from renewed Indian demand for gold added to the Chinese demand. In 2010, as pent-up demand for gold was unleashed, Indian gold consumption soared 74% to a record high of 1,006 tons according to GFMS.

Gold bulls surely hope we see something similar in 2013 and that is exactly what I talked about last week based around gold miner stocks and also what Dave Banister’s recent gold forecast was about at TheMarketTrendForecast.com sees in 2013.

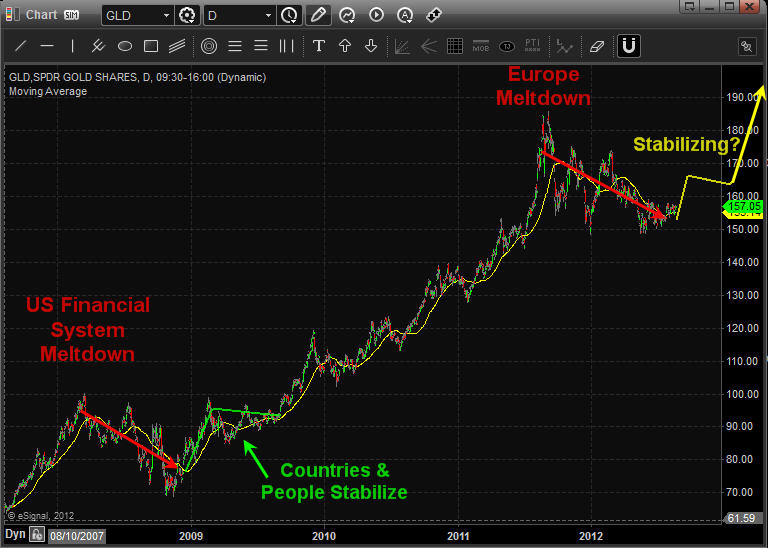
Gold Chart Showing 2009 Collapse and Outcome and Current Gold Price Analysis:

Gold Forecast - India Gold demand

Gold Forecast - India Gold demand

Gold Trading & Investing Conclusion:

In short, gold and gold stocks have a lot of work to do before they truly breakout into the next major leg higher. I feel we are nearing that point and they may have bottomed already. Starting a small long position to scale in I think is a safe play. But I would only add more once the trend actually turns up and shows strength in terms of price and volume action.

If you would like to get my weekly analysis on precious metals and the board market be sure to join my free newsletter at www.TheGoldAndOilGuy.com

Chris Vermeulen

Chris Vermeulen – www.TheGoldAndOilGuy.com

It is an endless debate for investors interested in gold. Should they buy a direct play on the gold price, either gold bullion itself or even so-called paper gold with an ETF such as the SPDR Gold Shares (NYSEArca: GLD)? Or should they invest into gold equities, particularly the larger, higher quality gold mining companies?

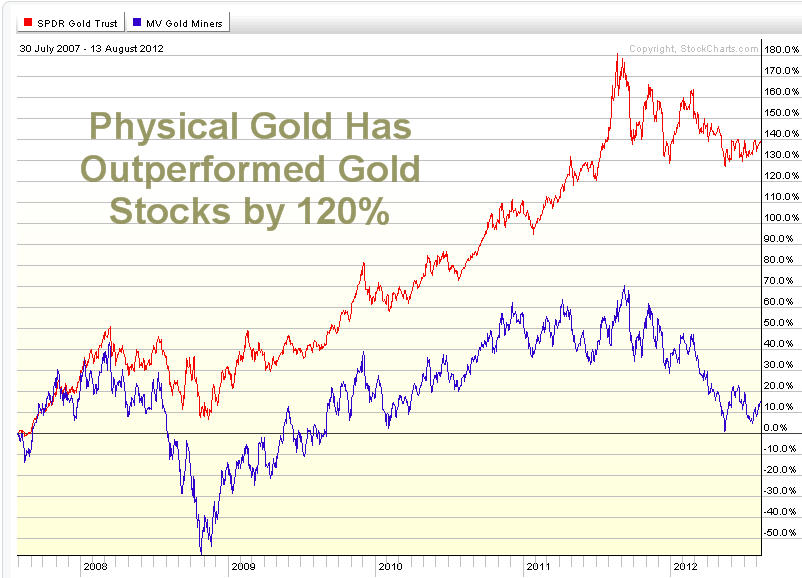
Recent history suggests the answer is gold itself. According to Citigroup, physical gold has outperformed global gold equities 120% percent of the time over the past 5 years. Stocks of the bigger gold mining firms seem to react adversely to bad news (which is normal), but the problem is they react with no more than a yawn to good news. These type of stocks are contained in the Market Vectors Gold Miners ETF (NYSEArca: GDX).

Gold Mining Stocks ETF - GDX

Gold Mining Stocks ETF - GDX

Evidence of this trend can been see in the latest news to hit the industry…the slowdown in expansion as recently signaled by the world’s largest gold producer, Barrick Gold (NYSE: ABX). The company’s stock has fallen by more than 30 percent over the last year due to cost overruns at major projects. The latest blowup in costs of up to $3 billion occurred in its estimate for development of its flagship Pascua-Lama project on the border of Chile and Argentina. The project may now cost up to $8 billion.

In addition, Barrick decided to shelve the $6 billion Cerro Casale in Chile and the $6.7 billion Donlin Gold project in Alaska. Barrick is not alone in its thinking among the major gold producers. The CEO of Agnico-Eagle Mines (NYSE: AEM), Sean Boyd, recently said “The era of gold mega-projects may be fading. The industry is moving into an era of cash flow generation, yields and capital discipline.”

Fair enough. But are gold mining companies’ management walking the walk about yields or just talking the talk? Last year, many of the larger miners made major announcements that they would be focusing on boosting their dividends to shareholders in attempt to attract new stockholders away from exchange traded vehicles such as GLD, which have siphoned demand away from gold equities. Barrick, for example, did boost its dividend payout by a quarter from the previous level. Newmont Mining (NYSE: NEM), which has also cut back on expansion plans, has pledged to link its dividend payout to the price of gold bullion.

So in effect, the managements at the bigger gold mining companies (which are having difficulties growing) are trying to move away from attracting growth-only investors to enticing investors that may be interested in high dividend yields. This is a logical move.

But rising costs at mining projects may put a crimp into the plans of gold mining companies’ as they may not have the cash to raise dividends much. And they have done a poor job of raising dividends for their shareholders to date. In 2011 the dividend yields for gold producers globally was less than half the average for the mining sector as a whole at a mere 1.3 percent. Their yields are below that of the base metal mining sector and the energy sector.

It seems like management for these precious metal companies have the similar emotional response shareholders have when they are in a winning position. When the investor’s brain has experienced a winning streak and is happy it automatically goes into preservation/protection mode. What does this mean? It means management is going to tight up their spending to stay cash rich as they do not want to give back the gains during a time of increased uncertainty. Smaller bets/investments are what the investor’s brain is hard wired to do which is not always the right thing to do…

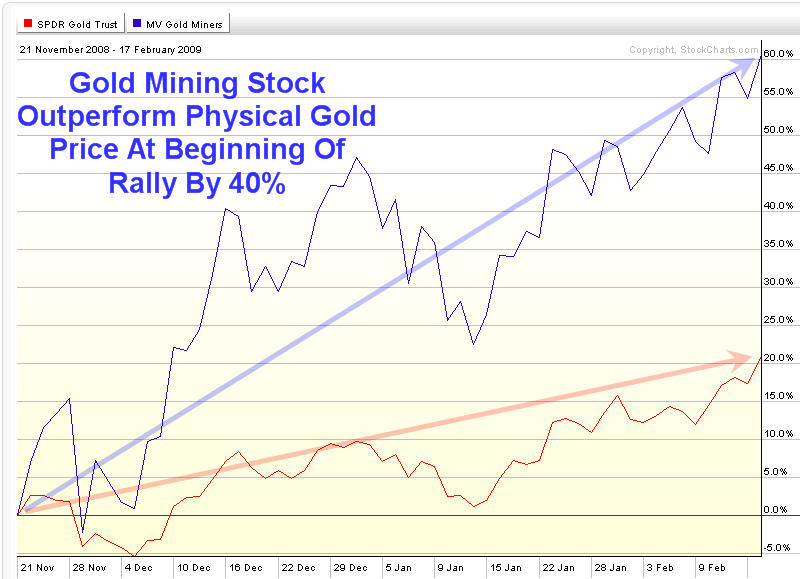
Looks like there is still a lot work to be done by gold mining companies’ to improve returns to their shareholders. But with all that set aside it is important to realize that when physical gold truly starts another major rally. These gold stocks will outperform the price of gold bullion drastically for first few months.

Gold Stock Rally

Gold Stock Rally


Gold Miner Trading Conclusion:

In short, last weeks special report on gold about how gold has been forming a major launch pad for higher prices over the past year. Gold bullion has held up well while gold miner stocks have given up over 30% of their gains. If/when gold starts another rally I do feel gold miner stocks will be the main play for quick big gains during the first month or two of a breakout. The increased price in gold could and value of the mining companies reserves could be enough to get management to start paying their investors a decent dividend which in turn would fuel gold miner shares higher.

Both gold and silver bullion prices remain in a down trend on the daily chart but are trying to form a base to rally from which may start any day now. Keep your eye on precious metals going into year end.

If you would like to get my weekly analysis on precious metals and the board market be sure to join my free newsletter at www.TheGoldAndOilGuy.com

Chris Vermeulen
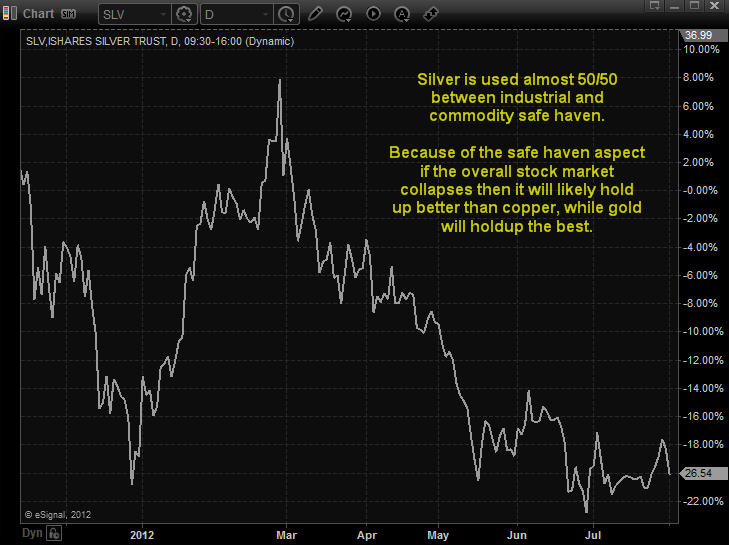
While the exchange traded funds for gold (NYSEARCA: GLD TRADING –  GLD QUOTE) and copper (NYSEARCA: JJC) fell today due to investors expressing disappoint at the modest response of the Federal Reserve to declining economic growth, it was silver (NYSEARCA: SLV Trading, SLV Quote) that was off the most.

SPDR Gold Shares (GLD) fell in trading today by 0.89%.    IPath Dow Jones Copper (JJC) dropped 1.89%.  Plunging the deepest was iShares Silver Trust (SLV), off by 2.14%.

SLV Trading

SLV Bullion Trust

Traders were hoping for more aggressive action by Federal Reserve Chairman Ben Bernanke.  But that will not come until after the November elections in the United States.  Remember that Quantitative Easing 2 did not begin until November 2010, though it was announced at the Jackson Hole economic policy summit in August of 2010.

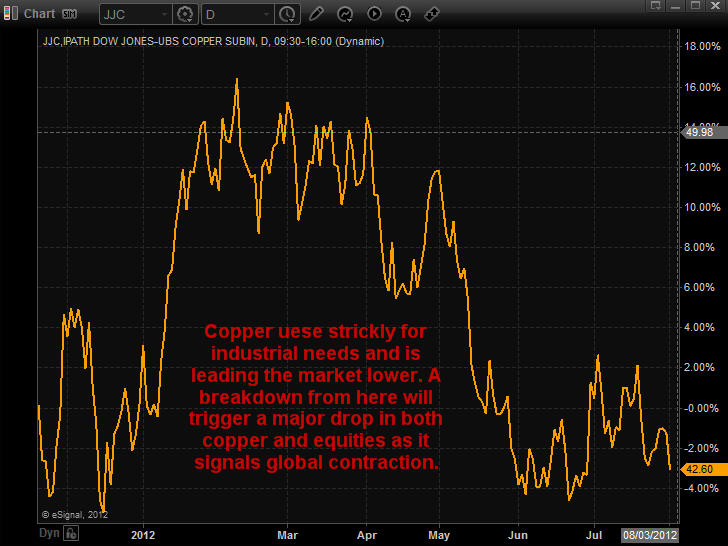
Silver is in what would seem to be the “sweet spot” between gold and copper.  Almost all of gold is used for investment or decorative purposes.  Almost all of The Red Metal goes for industrial needs.   For silver, it comes almost down right in the middle between commercial and a commodity for investments or jewelry.  The charts below show the trading relationship for each of the exchange traded funds when paired against each other.

JJC Copper ETF Trading

JJC Copper ETF Trading

Even though silver has a much higher industrial usage, the SLV moves along with the GLD.   As a result, it soared during Quantitative Easing 2.  Obviously, the charts reveal that most of the trading is from speculators as the JJC should move in an inverse relationship with the GLD.  That is due to gold being used almost entirely for non-industrial end uses while copper is used almost industrial for industrial uses.

Up slightly for the week as traders thought more dramatic economic stimulus efforts would result from the Federal Open Market Committee meeting  other than an extension until the end of the year for Operation Twist, the SLV is down for the last month, quarter, six months and 52 weeks of market action.  Year to date, the SLV is off by 1.48%.

For the last year, however, the SLV is down 33.35%.  Volume was up today, with the SLV below its 20-day, 50-day and 200-day moving averages.  In the most obvious trend, it is trading much lower under its 200-day day moving average at 11.67% down than underneath the 20-day moving average, beneath it by only 0.17%.  The only move worth noting in the technical indicators for silver were the long engulfing green bodies last week after Treasury Secretary Geithner’s  gloomy testimony on The Hill and more bad economic news from the US peaked buying as traders thought Quantitative Easing 3 was coming.

SLV ETF Trading

SLV ETF Trading

If traders long on silver are looking for help from Bernanke, it will not be coming until after the November election, though it could be announced when he speaks later this month at Jackson Hole.


Chris Vermeulen

The past 48 hours the stocks market has been on verge of a major meltdown in my opinion. The people with power who manipulate the markets are trying their hardest to hold prices up.

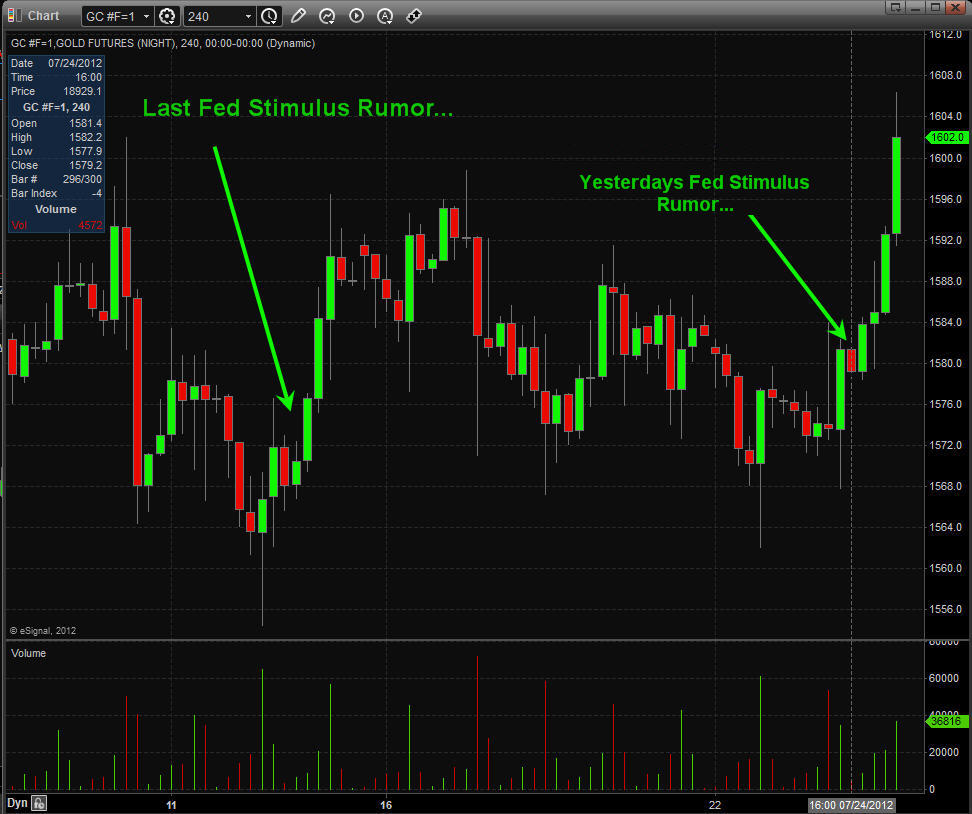
Yesterday we saw rumors about the Fed I the WSJ that they wanted to do more easing ASAP. That news could not have come at a better time as it saved the day/markets from more heavy selling. That news also helped prop gold bullion prices up.

Take a look at the 4 hour candle stick chart for a visual:

Buy Gold Bullion

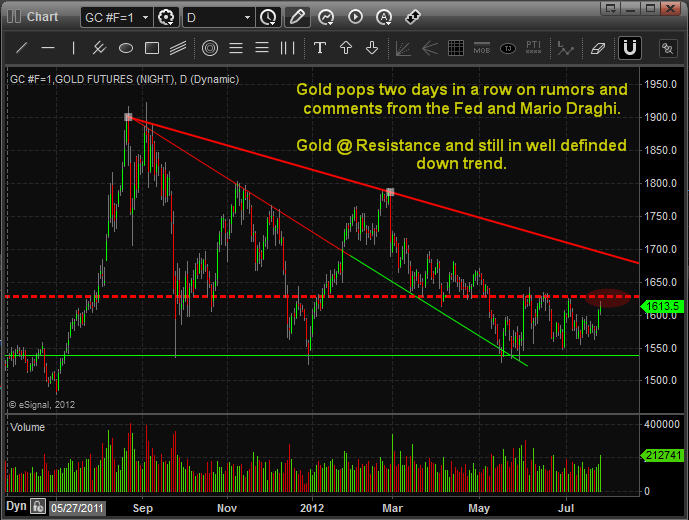
Now look at what Mario Draghi’s comments have done with spot gold prices in the daily chart below:

Gold is not nearing key resistance but the recent move up has been on nothing but rumors and comments… nothing set in stone. This makes me think sellers will continue to control gold prices as we near resistance.

Purchase Gold Bullion


When gold does breakout of this pattern I expect we see $2300 level reached. A great safe place to buy gold which I own some is through BullionVault and the even give you a FREE GRAM OF GOLD just for taking the 4 minutes to open up an account!

Get my Trade Alerts & Analysis Here: www.TheGoldAndOilGuy.com

Chris Vermeulen
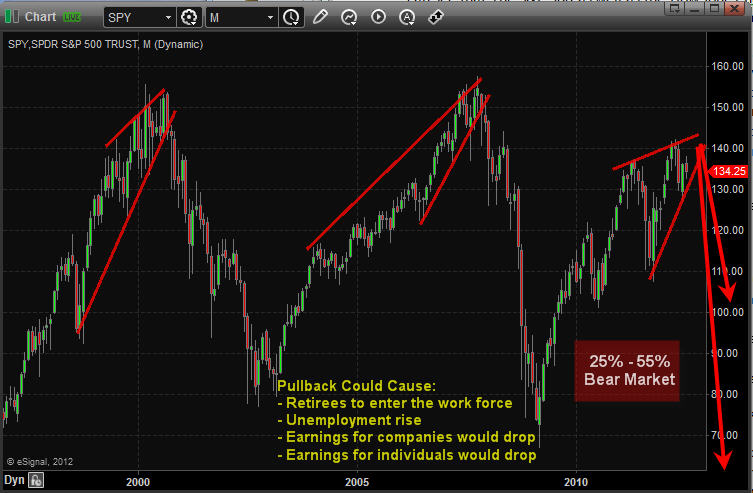
As mentioned last Friday just before things took a dive on the weekend, a look at the major market indices did not look promising.  If we take an even longer term look and examine the monthly charts we can see that The S&P 500 as well as the Dow Jones have been approaching multi-decade rising channel resistance lines.  Further, they also appear to be forming bearish rising wedge patterns.


Monthly Long Term Chart Analysis & Thoughts:

Monthly SPX Index Trading

As many of my longer term subscribers can attest to, I always preach that technical analysis is one part  art and one part science:  you can never be completely certain on what the outcome of a pattern is going to be.  However, we can use historical analysis to make better investments. The great American Novelist Mark Twain probably said it best in that “history does not repeat itself, but it rhymes”.  Regarding a rising wedge pattern, we know that roughly two-thirds of the time they will break to the downside.  This also means that one-third of the time they break to the upside.

In accomplishing our goal of capital growth we must do a number of things.  We must make returns on our investments, we must protect our investments, and we must limit our losses.  While all three aspects work in tandem with each other, there are times when focus must be allocated to one specific approach.

Regarding the current technical setup, I’m not so focused on the 67% chance that these wedges will break to the downside, but more so the impact of each outcome on the average Joe’s portfolio and mom and pop businesses.  The S&P 500 and the Dow are approaching long term resistance lines that have been in place for decades.  If we do break to the downside, which I suspect we will, there could be a very significant sell off with consequences that no one can predict at this point though I mention some things in the chart above.  Alternatively, there is significant overhead resistance in the various indices, and I don’t believe an upside break would be too monumental.

That being said, I always like to keep an open outlook and wait for the right opportunity.  I’m trying to think of scenarios that would prelude further upside action and I really am not coming up with much.  As evidenced by the completion of the recent 5 wave uptrend on the S&P that coincided nicely with the various quantitative easing policies, Ben Bernanke and the fed have had less and less impact.  I truly can’t see many fiscal developments that would prompt any significant bullish action.

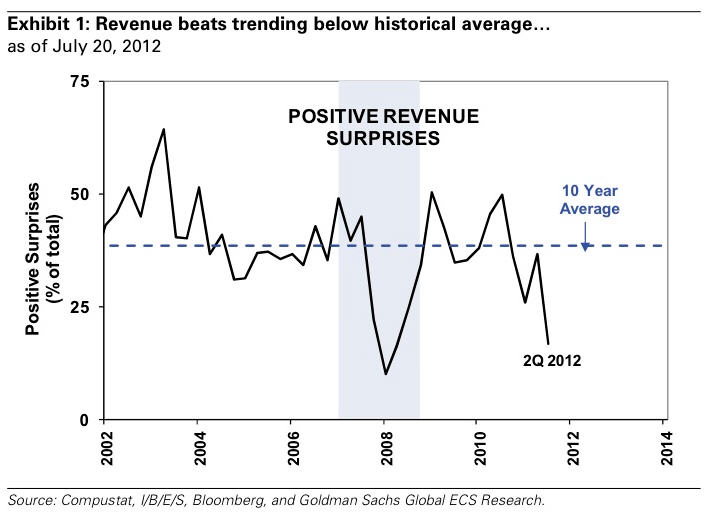
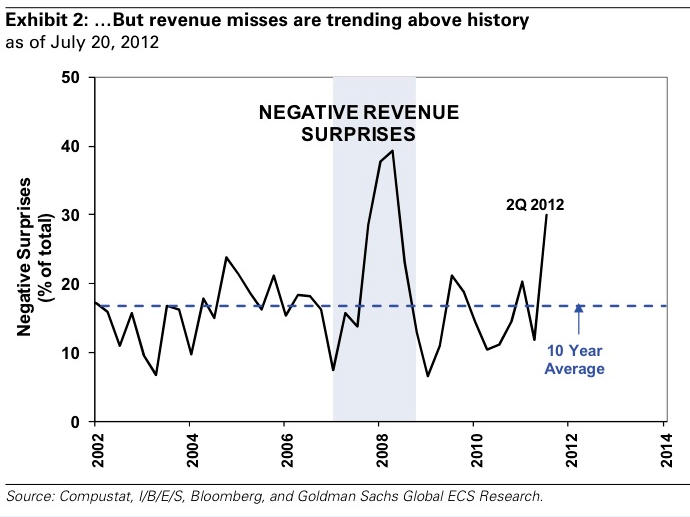
The only scenario I really think that could pump up equities is a series of positive earnings announcements.  A lot of expectations, earnings numbers, guidance, etc… have been revised downwards over the last couple of quarters, so there is the opportunity for some positive surprises that could lead to some bullish price action.  In absence of such a scenario, I really can’t think of much else that would prompt a run up.

Look at these charts of positive and negative earnings surprises… and the dates and remember what happened following this negative data….


Positive Earnings Surprise

Earnings Positive SurprisesEarnings Positive Surprises


Negative Earnings Surprise

Earning Negative Surprises

That being said, I am recommending two courses of action.  For those steadfast bulls, lock in some profits and/or buy some protection.  Missing out on some of the upside is a lot better than losing some of the gains you have fought so hard for over the past couple of years.  For the more aggressive traders and investors, start following my updates a little more regularly as I foresee many shorting opportunities coming up in the future.  As many of you know, sell-offs are often quick and abrupt, and timing is extremely important when playing the downside.

Further, trading could get very volatile in the near future.  Historically, and even more so looking forward as August and September have been very costly for the average investor.  Our focus will be in taking the highest probability trades that offer the best risk to reward scenarios.  There will be times when we miss trades, and times when they’re not timed perfectly.  But, as those who have been with me for a while can attest to, patience pays off in the long run…

Join my Free Market Analysis & Trade Idea Newsletter Now: www.GoldAndOilGuy.com

Chris Vermeulen
I have put together a very detailed video this morning coving bother some long term, short term and market cycles. The video is a little longer than normal but I want you to understand fully where the market is trading and what to look for in the coming days.

Pre-Market Analysis Points:

–          Dollar is trading higher this morning which is putting pressure on stocks & commodities.

–          Fed Chairman Bernanke Testifies at 10am ET which will cause all investments to move wild.

–          Oil is trading slightly lower and oil inventory numbers come out at 10:30am ET.

–          Natural gas is flat and continues to build a base at resistance for a possible future breakout.

–          Gold, Sold Miners and Silver continue to consolidate within a multi month pattern. A major move is brewing but has not been triggered as of yet.

–          Bonds are trading up from yesterday’s close after pulling back from reaching our double top price target on Monday.

–          SP500 is nearing a couple resistance levels (previous pivot high, down trend line) Momentum, short term and intermediate cycles are starting to top and that means we should be prepared for a pullback/down trend which could last 4-6 weeks.


Watch Video For Clarity


Get This Video Analysis EVERY MORNING here: www.GoldAndOilGuy.com

Chris Vermeulen
By: Chris Vermeulen – www.GoldAndOilGuy.com

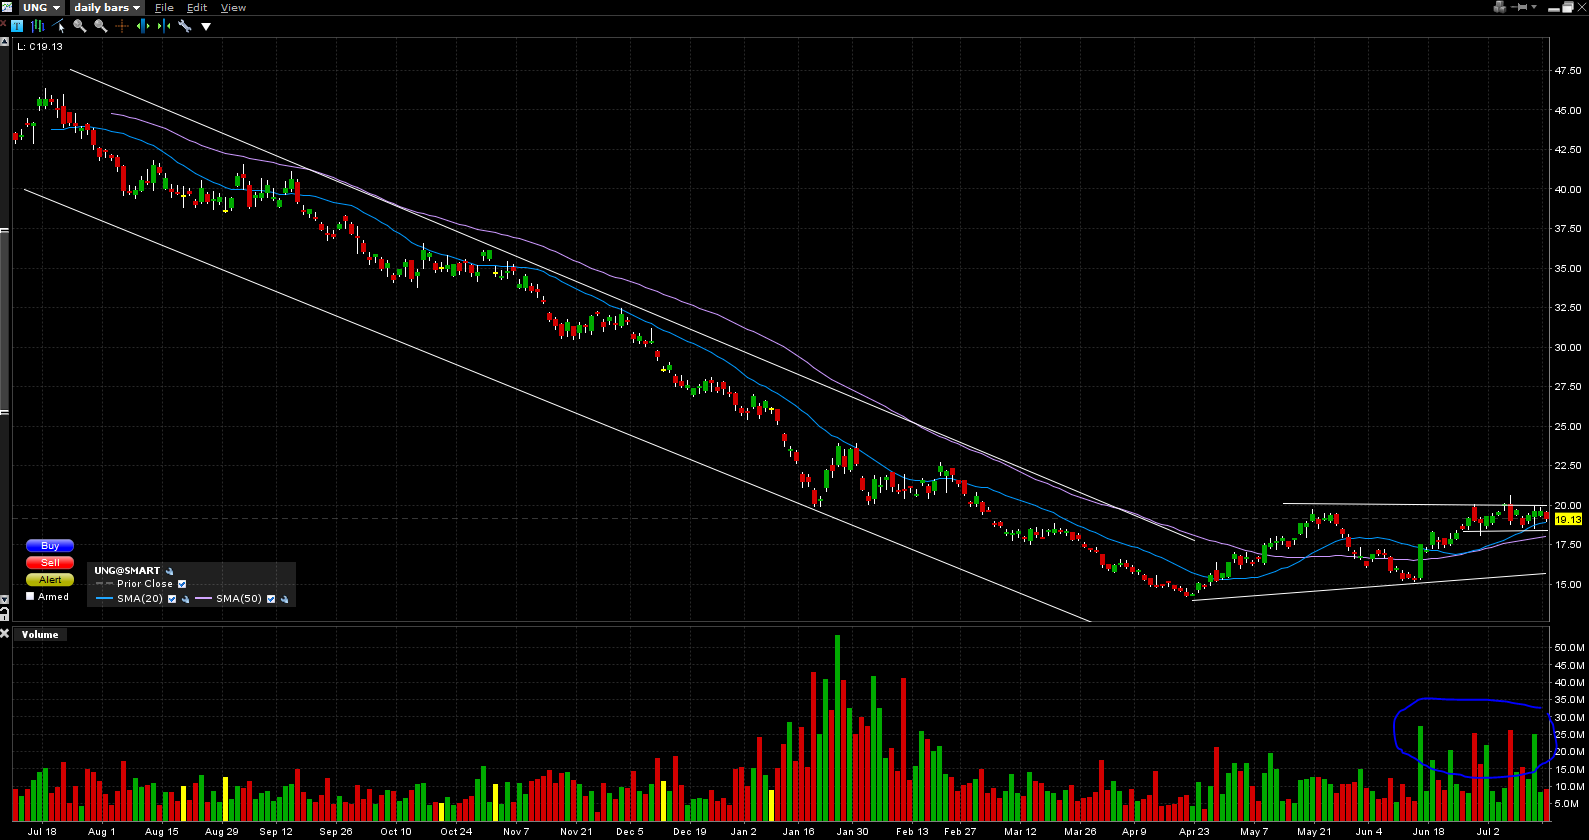
Nat gas (UNG) has recently caught my attention.  While it was in a significant downtrend for the better part of a year it has recently been consolidating right under the $20 level.  A look at the daily chart shows a long move down and then recently a sideways consolidation pattern.  While this is typically a continuation pattern I am beginning to believe think that the next move may be up rather than an extension of the previous down trend.

  • Over the last two weeks there been significant support above $18 and significant volume.
  • The $20/$20.50 level has been tested multiple times and the more tests it undertakes the more likely it is to break.
  • Both the 20-day and 50-day moving averages have turned upwards and UNG is trading above both


Natural Gas Trading UNG

Natural Gas Trading UNG


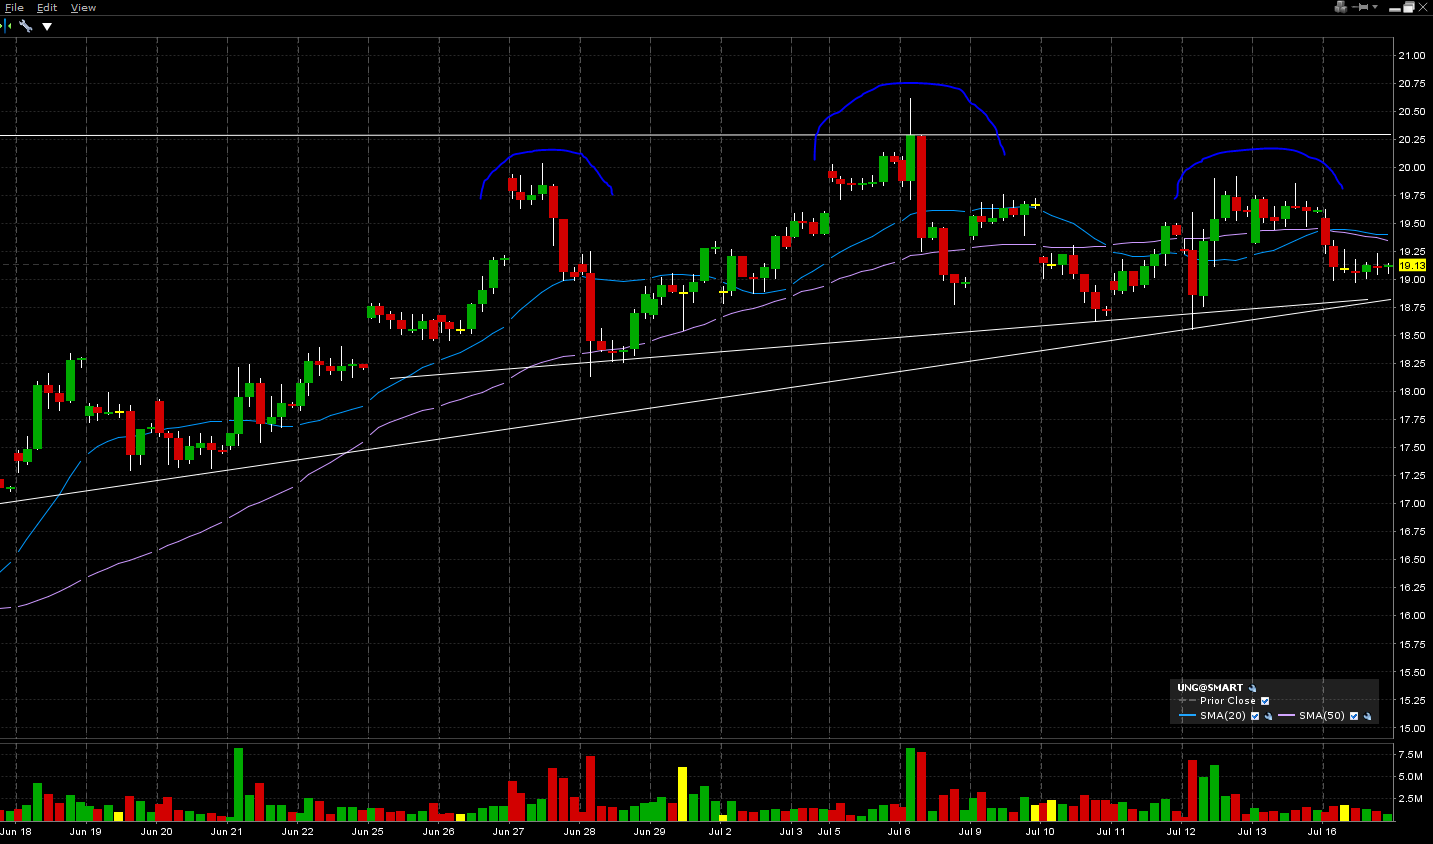
If we zoom in a bit and take a look at the hourly chart we are presented with two scenarios

  1. The rising wedge holds and UNG breaks through the $20 – $20.50 resistance level on high volume and a new long term up trend is produced
  2. The head and shoulders pattern within the wedge breaks  downwards and the downtrend resumes


Natural Gas ETF Trading

Natural Gas ETF Trading

I’m leaning towards option one but will be waiting for a breakout confirmed with volume in either case.

Get our Free Weekly Trade Ideas and Trading Education Videos: www.GoldAndOilGuy.com

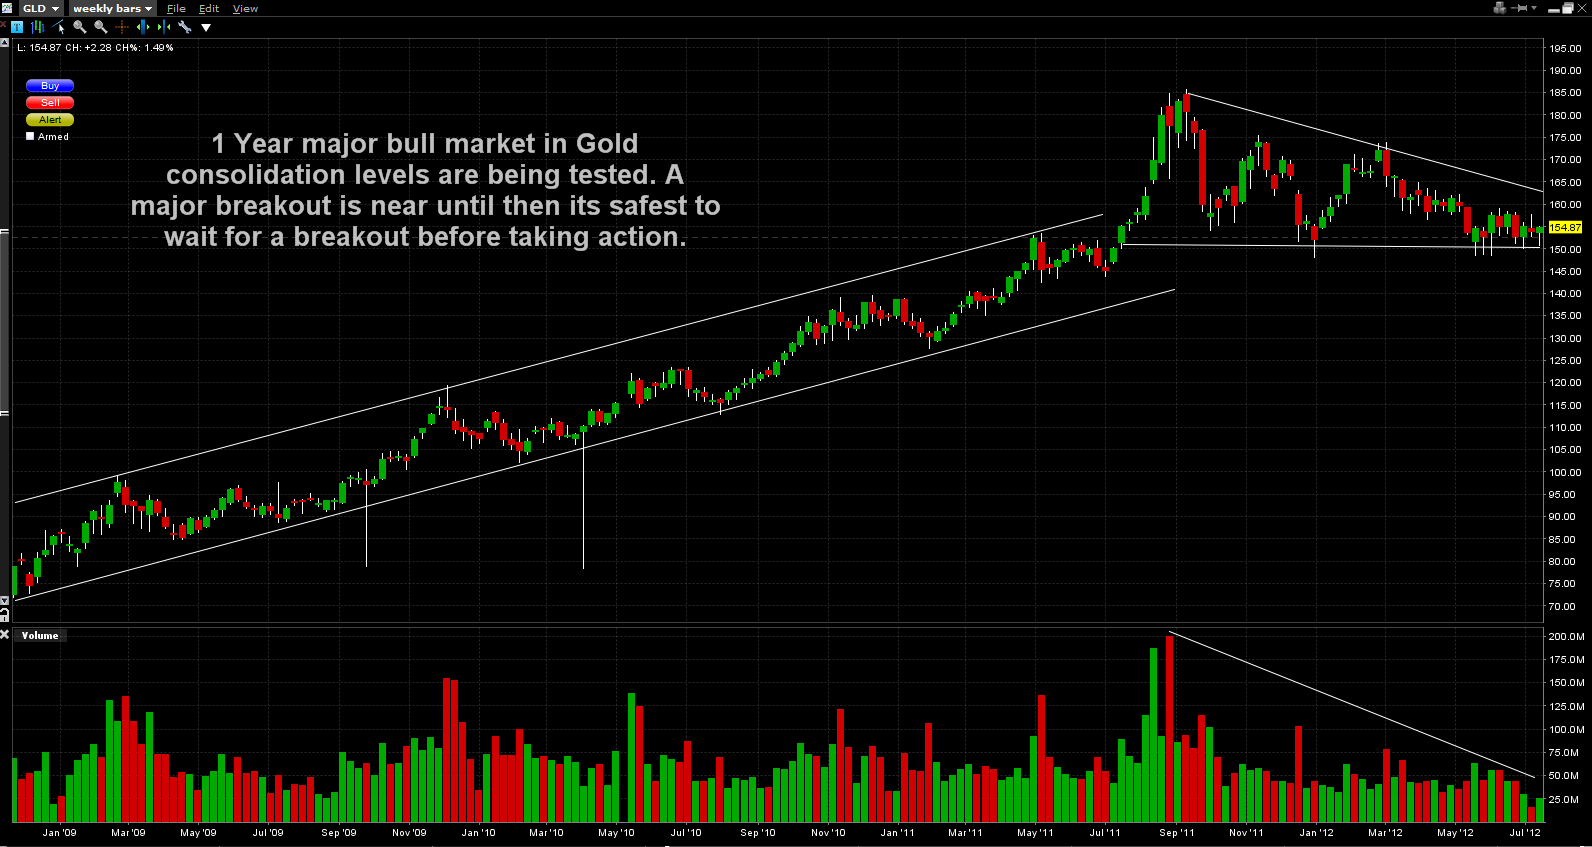
After making new highs about a year ago we have seen Silver and Gold consolidate for roughly the last twelve months.  Technically, it would typically be a bullish scenario with gold from the stand point that the last 12 months’ price action was a sideways consolidation in a bullish pennant formation.  However over the last year we have witnessed a series of lower highs and increasingly tested supports levels around $150 on GLD which raises caution.

  Click Gold Chart for Full Size

With the fed pulling any extensions on further quantitative easing in the form of QE3 or other programs, the bullish case has lately been criticised.  However I am still a firm believer that gold in most respects is a currency, and the only one that can maintain its value.  There are very serious issues looming in Europe and across the world that are far from resolution.  With few tools left in the toolbox to stimulate world economies, further easing can never be ruled out.

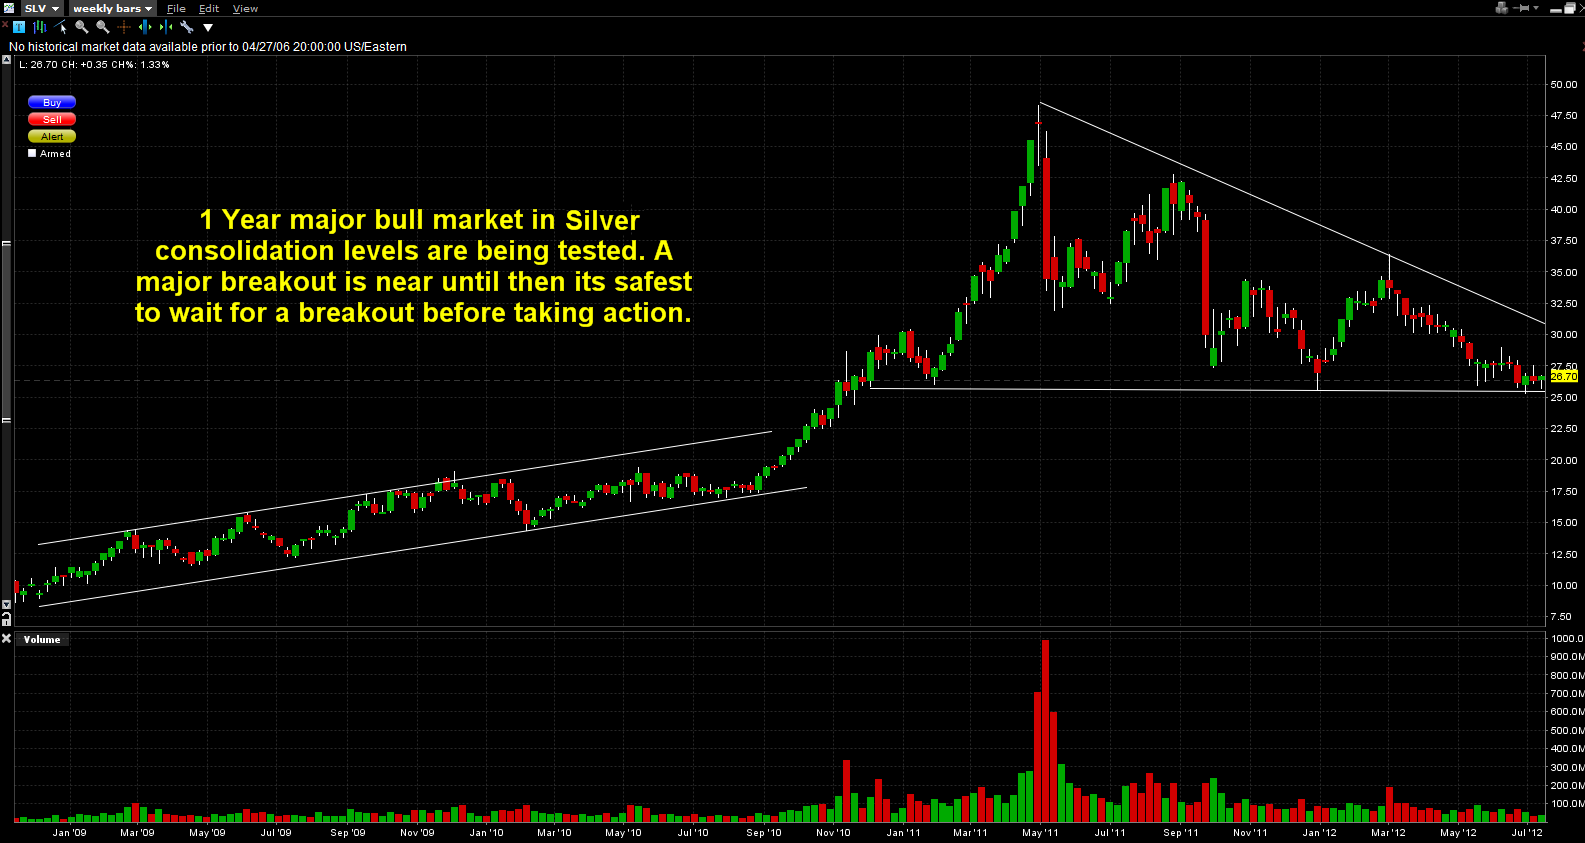
Silver, after breaking through strong resistance around $19- $20 in September 2011 went almost parabolic in spring 2011 prior to giving up most of its gains in the last year.  There seems to be significant support around $26 on SLV, however this level has been tested quite frequently over recent months and this again raises caution.  While silver owes some of its moves to its industrial application, the high correlation between the two metals is not to be ignored.

 Click Silver Chart for Full Size

I think the long-term trade will be long in both metals, but I’m waiting to see a significant breakout out of these consolidations on heavy volume to confirm a direction.  I would like to see both precious metals break out of their respective consolidations and ultimately have further confirmation in the USD.  Any major headlines over the next couple months involving Europe or quantitative easing may provide us with the trigger for the next big move.

Get My FREE gold cycles and trading analysis here: www.GoldAndOilGuy.com

Chris Vermeulen
Gold and stock market forecaster have been using cycles in price that repeat every certain amount of trading days to help them spot key reversal areas in the financial market. Almost everything in life seems to go in cycles and commodity prices and the stock market are no different.

As we all know the market is very difficult to forecast when using only one set of analysis like cycles. Analyzing price action, volume, market sentiment, market breadth, trends and inter-market analysis are the other key areas which one must understand before they can be in the zone (ZEN) with the financial market and properly forecast future prices.

This report will show you just how well cycles work if applied and traded properly.

How to Buy Dips and Sell Rips in Gold Using Cycle Analysis

The chart below is of gold and shows its short term trading cycles. I will admit this chart is hard on the eyes and as ugly as they get to bear with me.

Three different cycles have been applied to the chart using a short, intermediate and long term cycle wave length. The general idea here is that you want to trade with the underlying trend, then use these short term cycles to profit from weekly price swings.

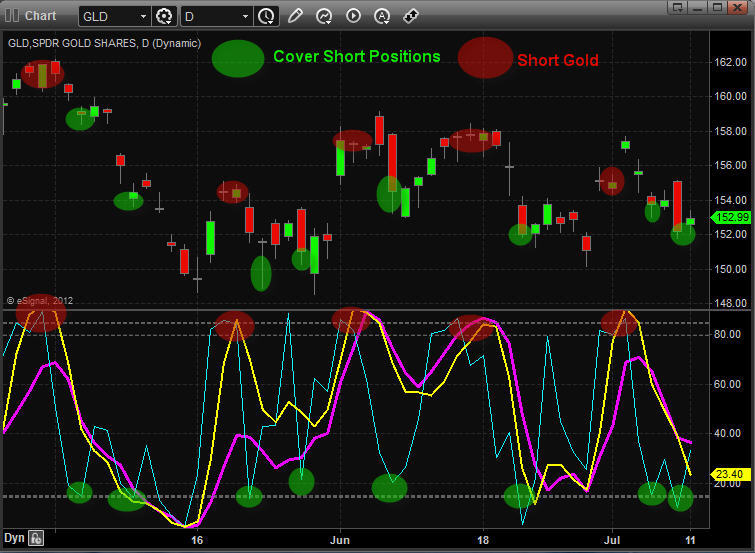
Gold has been in a down trend for a year so the focus should be on shorting the bounces. Focusing on selling short gold during a time with 2 or more cycles are topping as you stand a great chance of the price moving in your favor within 1-3 days.

Once the price starts to move in your favor you want to scalp to profits once the short term (green) cycle drops near a reversal level. Once this takes place I always tighten my stops to breakeven, lock in some profits and continue to wait for another cycle to reach the bottom at which point I take more profit off the table and tighten my protective stop once again.

As you can see this is not the perfect system but it makes money, and if you apply more analysis to the market you can lock in more of these moves using intraday charts, volume, and sentiment levels.


Gold Market Cycles

Gold Market Cycles


How to Find Market Cycles

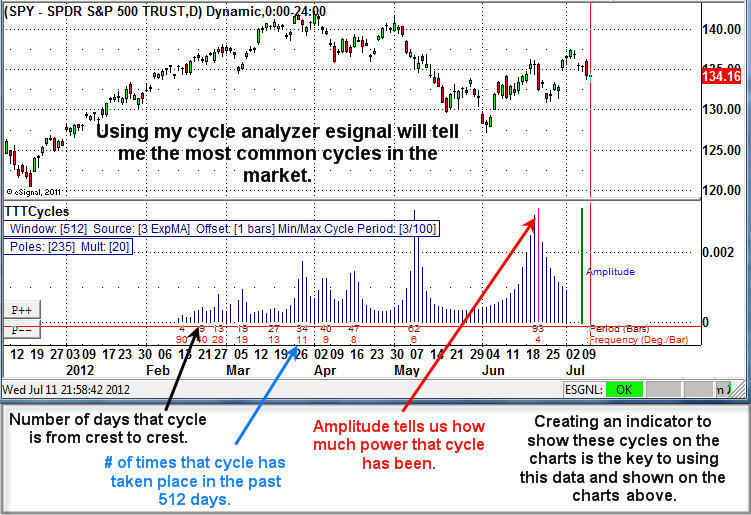
You must have an analysis tool that can read the market and find cycles within it. Once you know how many days the most frequent cycles are occurring you can then use a custom cycle indicator to overlay them on the charts as seen in the gold chart above. The visual overlay is the key to spotting market reversals and areas to add to a position or trim profits. Look at the chart below for a visual of how I find my cycles.


Market Forecast Cycles

Market Forecast Cycles


Gold Cycle Forecast Conclusion:

In short, gold overall remains in a down trend. But from looking at the gold chart and its short term cycles I have a feeling we will be seeing price trade sideways this week and a bounce next week.

The next week will be very interesting as these cycles will actually give us an early warning if the overall gold market is about to bounce or sell off. The question is what the cycles do in the next few days while gold flirts with support…

It does take some time/experience to read the cycles and get a feel for how they move so don’t worry about it if you don’t fully grasp the idea from this short article. Find out more on cycles and trading at www.GoldAndOilGuy.com

Chris Vermeulen
The term Stock market predictions is a very controversial topic and does seem to give off a negative/non-credible overtone to most traders, investors and the general public. We all know you cannot predict the market with 100% certainty, but knowing that you can still predict the market more times than not if done correctly. Keep in mind that the term “market prediction” is also known as a market forecast or technical analysis outlook and is nothing more than a estimated guess of where the price for a specific investment is likely to move in the coming minutes, hours, days, weeks and even months.

Getting back on topic, this report clearly shows how the US dollar plays a dominant role in the price of other investments. Understanding how to read the Dollar Index will make you a better trader all around when trading stocks, ETF’s, options or futures.

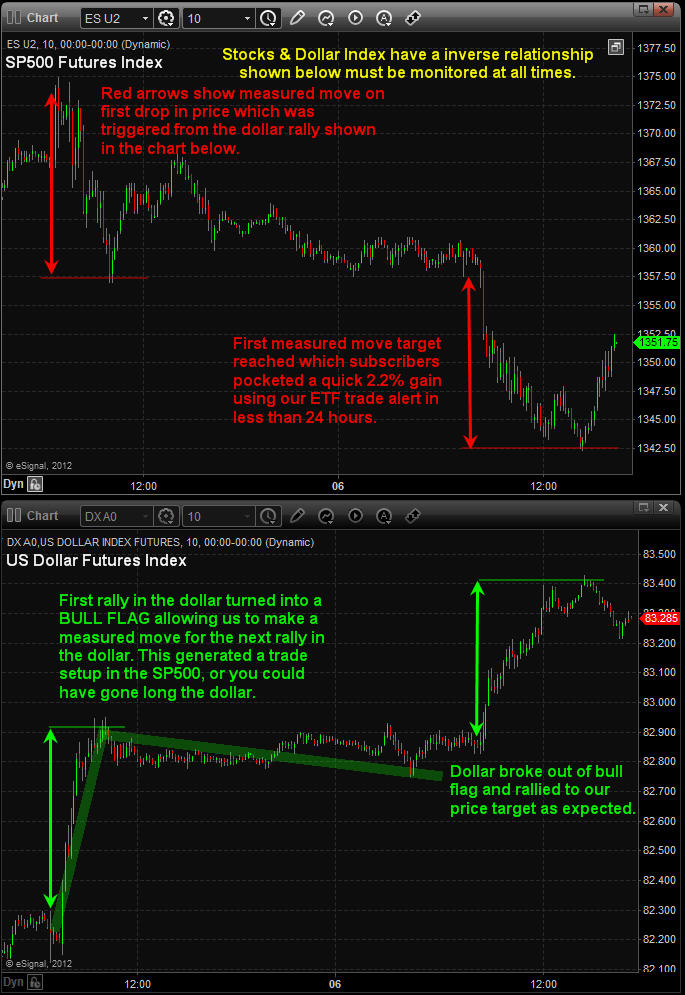
SP500 Stock Market predictions – 10 Minute Chart:
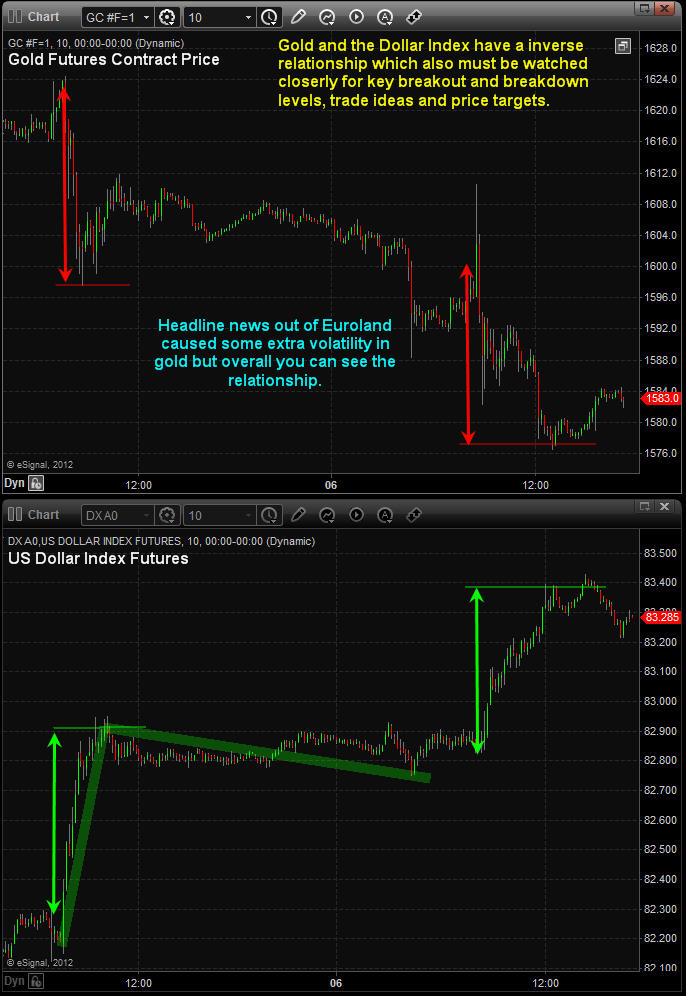
These charts clearly show the inverse relationship between the stock market and the dollar index. Knowing how to read charts (candle sticks, chart patterns, volume etc…) is not enough to give you a winning edge. You must also understand inter-market analysis as all markets are linked together in some way and the dollar plays a major role in where stock prices will move next. Review the charts and comments below on how I came up with my stock market prediction and trade idea.

Most Accurate Stock Market Predictions

Most Accurate Stock Market Predictions


Gold Market Prediction – 10 Minute Charts
Gold is another investment which is directly affected by the price of the dollar. Review charts for more details.


Gold Market Forecast Procetions

Gold Market Forecast Procetions


Long Term Stock Market Forecast:
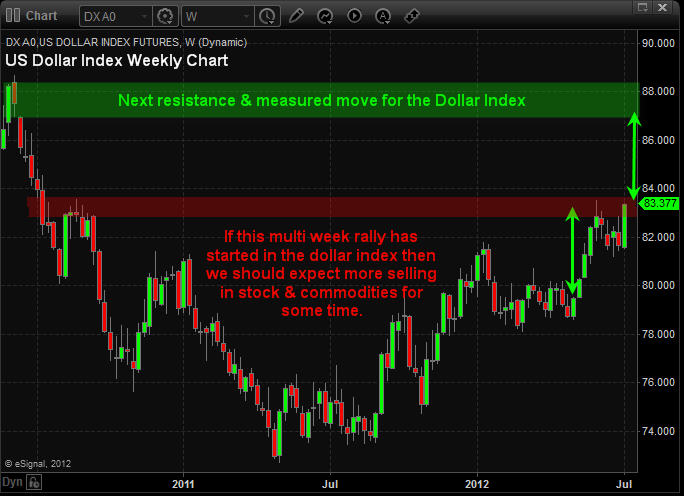
The weekly dollar chart is VERY IMPORTANT to watch as a short term trader and long term investor because trend changes in the dollar means you open positions will also likely change direction.

So, if we apply technical analysis to the dollar chart as seen below. You will notice we are able to create a market forecast and predict roughly where price is likely to move and how long it should take to get there. If the dollar can break above the red resistance level then we can expect a rally for 4 – 8 weeks and a price target around the 87-88 level.

If this is the case then stocks and commodities would likely do the inverse price action and move lower, sharply lower…

Dollar Long Term Market Forecast

Dollar Long Term Market Forecast


Stock Market Predictions & Gold Market Forecast Conclusion:

In short, the next weekly candle stick on the dollar chart could be a game changer for those who are long the overall stock market.

I will admit that the current market conditions are not easy to trade because of all the headline news rolling out of Europe each week along with economic data. And I feel as though we have been tip toeing through a mine field for the past 12+ months waiting for extremely negative news are extremely positive news to trigging a wave of buying or selling that will make our jaw drop, but it has yet to happen. Remember always use stops and don’t get over committed in a headline driven market.

If you would like to receive my free weekly analysis like this, be sure to opt-in to my list: www.GoldAndOilGuy.com

Chris Vermeulen