June 16, 2010
It’s been a bright week so far for stocks and commodities. It appears that the down trend could have ended as of yesterday (Tuesday June 15th). In this mid-week report I figured I would bring back the 80’s colors to see if I can spice things up!

Below are some charts I did showing my current views on the market. You may want to put on your hyper color shirt, sunglasses and zinc when viewing them in order to get into the zone… lol

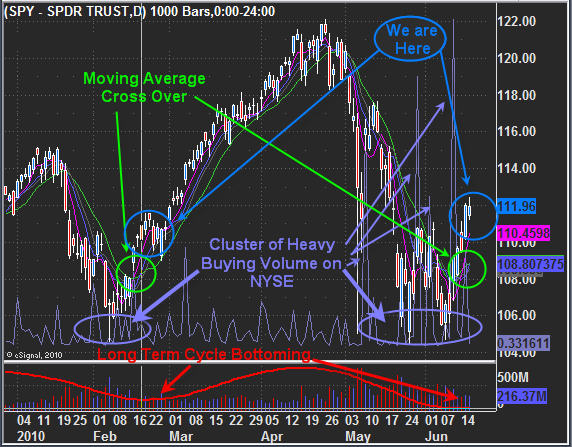
SPX – S&P500 Index Exchange Traded Fund – Daily Chart

I’ll keep this short and sweet here are the main points.

Moving Averages crossed over this week and when we see this a trend reversal generally occurs. That being said it is best to wait for the moving averages to cluster which means we need a pullback or sideways movement for a few days. I feel this is very likely to happen.

NYSE Buying Spikes have returned! We saw these during the previous bottom back in February. As the market continues to trend higher and mature these volume spikes tend to increase also.

Long Term Cycle has bottomed and should start to rise this week. As we can see from the February bottom the cycle was also bottoming which is very bullish for the index.

We Are Here shows where I think we are currently trading. The market is over bought right now and I feel a quick pullback or sideways move is needed before we see a continued move up.

Here is my Pre-Market Trading Video & Squawk Box Recording for today if you want to see my charts as of this morning: http://www.futurestradingsignals.com/trading-education/june-16th-market-reports/

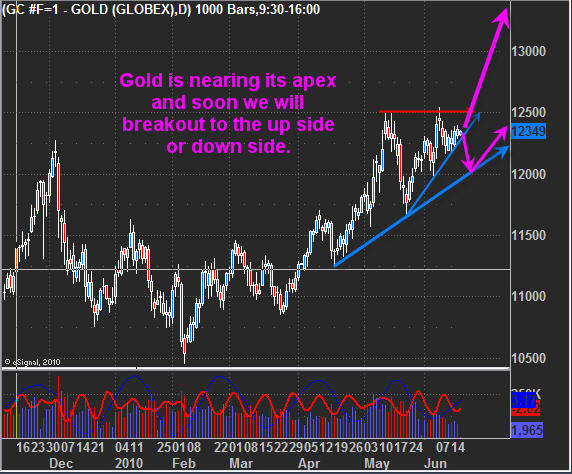
Gold Futures – Daily Chart

Gold is trading in a tight wedge at the moment. The long term picture is pointing to higher prices but I feel there is a good change of one last drop which should shake out a bunch of traders before rocketing upwards. August and September are good months for gold to move up and if you have been following the market as long as I have then you know patterns and prices can drag out much longer than we anticipate. So as much as the chart of gold looks like an imminent breakout is about to occur, it could still be a few months way. And to be honest that’s how the market works…. If it doesn’t shake you out, it will wear you out!

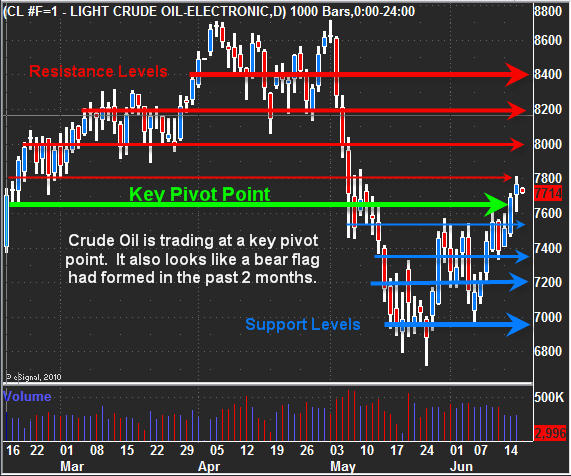
Crude Oil Futures – Daily Chart

Oil is trading a key pivot point and also looks to have formed a possible bear flag. At the moment I am neutral on oil, it’s a 50/50 guess as to which way it will go, so I am just watching for now… But I have pointed out some key resistance and support levels for those with oil positions… This small chart makes it look like I put a ling at ever $2 but if you look closer some are above and below those even numbers.

Mid-Week Stock and Commodity Wrap Up:

In short, I think the market is on the verge of another rally which is very exciting since we cashed out in late April before the market had the big sell off. It will be nice to put some long term plays to work so we are not so dependent on the short intraday plays which last 1-2 days because of the extreme volatility in the market.

I figure we will see stocks and gold move up together but I’m not really sure about oil at this point… If oil does not move up then the market will have limited up side and instead of a new bull market rally to new 2010 highs we could just see move up to test near the April high. Then it could roll over and start heading back down triggering much larger sell off as we enter another bear market.

All that being said… it looks to be a couple months away still and a lot can happen in that time. As a market technician I take each chart one day at a time.

If you would like to learn my intraday and swing trades along with my trading signals checkout my website: www.FuturesTradingSignals.com

Chris Vermeulen

Take A Close Look At What I Offer:

June 16, 2010
It’s been a bright week so far for stocks and commodities. It appears that the down trend could have ended as of yesterday (Tuesday June 15th). In this mid-week report I figured I would bring back the 80’s colors to see if I can spice things up!

Below are some charts I did showing my current views on the market. You may want to put on your hyper color shirt, sunglasses and zinc when viewing them in order to get into the zone… lol

SPX – S&P500 Index Exchange Traded Fund – Daily Chart

I’ll keep this short and sweet here are the main points.

Moving Averages crossed over this week and when we see this a trend reversal generally occurs. That being said it is best to wait for the moving averages to cluster which means we need a pullback or sideways movement for a few days. I feel this is very likely to happen.

NYSE Buying Spikes have returned! We saw these during the previous bottom back in February. As the market continues to trend higher and mature these volume spikes tend to increase also.

Long Term Cycle has bottomed and should start to rise this week. As we can see from the February bottom the cycle was also bottoming which is very bullish for the index.

We Are Here shows where I think we are currently trading. The market is over bought right now and I feel a quick pullback or sideways move is needed before we see a continued move up.

Here is my Pre-Market Trading Video & Squawk Box Recording for today if you want to see my charts as of this morning: http://www.futurestradingsignals.com/trading-education/june-16th-market-reports/

Gold Futures – Daily Chart

Gold is trading in a tight wedge at the moment. The long term picture is pointing to higher prices but I feel there is a good change of one last drop which should shake out a bunch of traders before rocketing upwards. August and September are good months for gold to move up and if you have been following the market as long as I have then you know patterns and prices can drag out much longer than we anticipate. So as much as the chart of gold looks like an imminent breakout is about to occur, it could still be a few months way. And to be honest that’s how the market works…. If it doesn’t shake you out, it will wear you out!

Crude Oil Futures – Daily Chart

Oil is trading a key pivot point and also looks to have formed a possible bear flag. At the moment I am neutral on oil, it’s a 50/50 guess as to which way it will go, so I am just watching for now… But I have pointed out some key resistance and support levels for those with oil positions… This small chart makes it look like I put a ling at ever $2 but if you look closer some are above and below those even numbers.

Mid-Week Stock and Commodity Wrap Up:

In short, I think the market is on the verge of another rally which is very exciting since we cashed out in late April before the market had the big sell off. It will be nice to put some long term plays to work so we are not so dependent on the short intraday plays which last 1-2 days because of the extreme volatility in the market.Last week we saw the financial market including commodities move higher which was great to see. But the recent run up has brought both equities and commodities to their key resistance levels. With Gold, Oil and the SP500 trading near key resistance points we will most likely have some sharp movements this week so buckle up tight!

Gold – Daily Chart

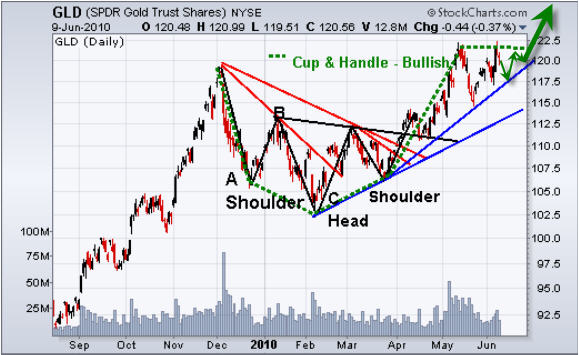
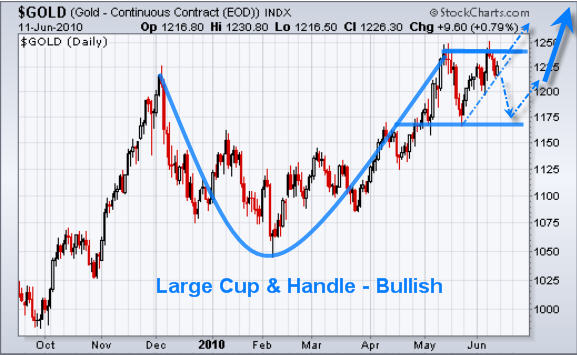
Gold Future Prices continue to form the large cup and handle pattern and is trading near resistance. This week I figure we will see gold make a move up or break the dotted support trend line and drop towards the blue support level. I continue to wait for a low risk setup for gold.

Crude Oil – Daily Chart

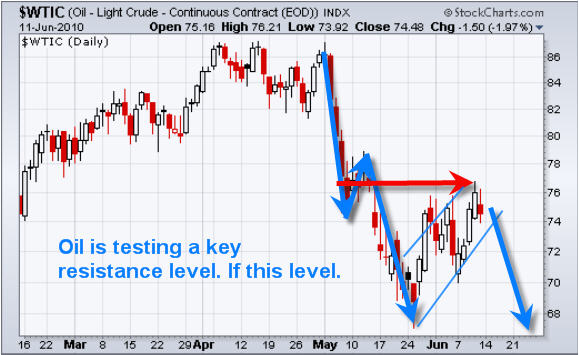
Crude oil has been trending down for a couple months and recently rebounded to test its resistance level. It looks as though oil is forming a bear flag which generally means we should see lower prices in the near future. But another $1-2 move up could trigger a surge of buyers if this resistance level is broken which is why this week should be volatile… it’s a 50/50 chance for commodities to either rally or sell off.

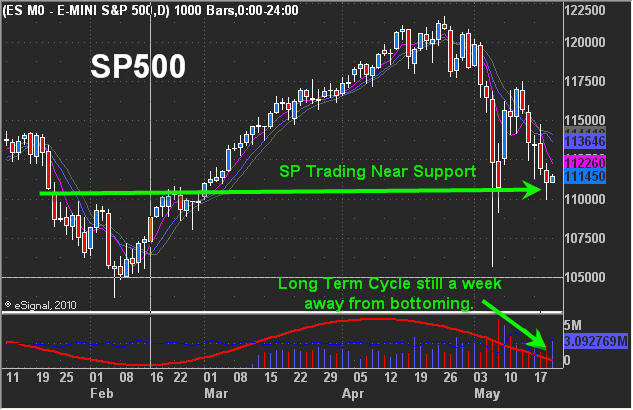
SP500 – Daily Chart

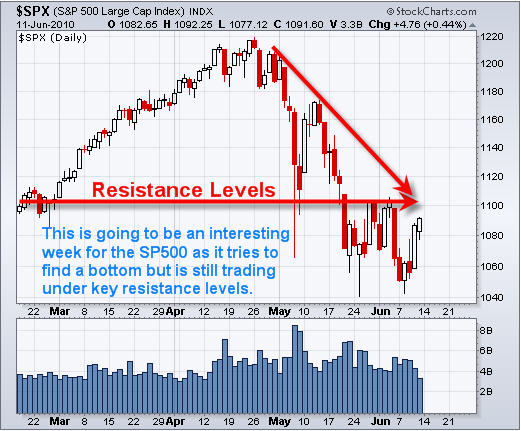
The SP500 has posted some decent gains the past couple days but it’s still no in the clear just yet… Most technicians are looking for a move above 1100-1110 area with heavy volume before they start to commit serious money to the long side.

It looks and feels as though the market could drop or rally very sharply from here and if you are caught on the wrong side of the move then it’s going to really hurt the trading account. During times like this when the market is at a critical pivot point with increased volatility levels along with mixed market internals I tend to stay on the side lines until some dust settles.

Weekend Gold, Oil and SPX Trading Conclusion:

In short, everything is trading near key pivot points giving mixed signals for prices to rally or drop. My analysis is pointing to a small move up Monday morning to break Fridays high followed by some selling late Monday or Tuesday. How much of a move down I don’t know for sure but there is potential for a 3-4% move. On the flip side if buyers step in pushing the price above 1100 then we could see a surge higher of 3-4%…

Very dicey times right now to be trying to pick a direction, which is why it’s best to wait for the risk level to diminish before getting involved or at least trade a small position with a protective stop if you feel confident in a direct.

If you would like to receive my Low Risk ETF Trading Signals be sure to checkout my service at: www.TheGoldAndOilGuy.com

Chris Vermeulen

Get My Technical Charts Emailed To You:

I figure we will see stocks and gold move up together but I’m not really sure about oil at this point… If oil does not move up then the market will have limited up side and instead of a new bull market rally to new 2010 highs we could just see move up to test near the April high. Then it could roll over and start heading back down triggering much larger sell off as we enter another bear market.

All that being said… it looks to be a couple months away still and a lot can happen in that time. As a market technician I take each chart one day at a time.

If you would like to learn my intraday and swing trades along with my trading signals checkout my website: www.FuturesTradingSignals.com

Chris Vermeulen
Take A Close Look At What I Offer:

Wednesday June 9th
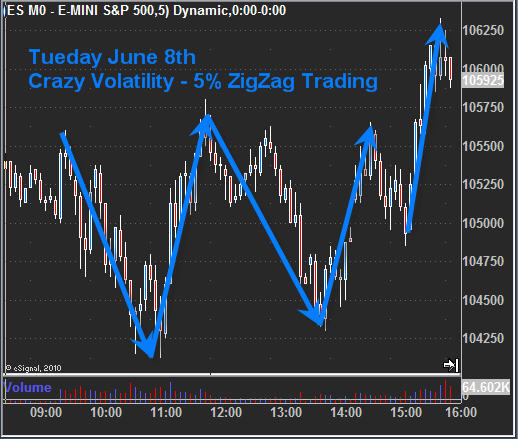
Market volatility continues to shake things up making it profitable for traders who are quick to spotting key reversal points, manage risk and taking profits before it evaporates. On Tuesday we saw the market go up and down more than I have seen in a long time… It moved over 5% as it trended up then down in 1% increments as shown in the chart below. Members of FuturesTradingSignals were able to capture a 1-2% gain which may not sound like much but when trading the leveraged ETFs, Futures or CFD’s we are making 4-200% profit within a few hours. That being said this type of price action is proof that the market just does not know which way to go and why trades must be very quick to enter and exit positions.

The SP500 daily etf chart shows my simple volume analysis during market corrections. During the early stages of a trend, pullbacks are quick and simple. But as a trend matures we start to see corrections become much more complex. We first saw the simple 1 wave corrections in 2009, then we saw a much deeper 3 wave correction which was enough to shake most retail (average Joe’s) out of the market before heading higher, and now it looks as though we are headed into a complex 5 wave correction which should be enough to shake out the majority again.

It’s important to note that the longer a trend lasts the larger the corrections/shake outs must be in order to get everyone out. From what I am reading and seeing everywhere online are doom and gloom scenarios. In my opinion this is good. One more leg down should be enough to shake everyone before we see a nice 10-20% rally. Once we see that bounce/rally then we can reanalyze the market to see if we are headed back up to test the 2010 highs or if its just a bear market rally. In the end it does not matter as we play both the long and short side of the market.

Gold ETF continues to unfold as planned. We caught a good chunk of the recent rally and are now in cash waiting for another low risk entry point in the coming days or weeks.

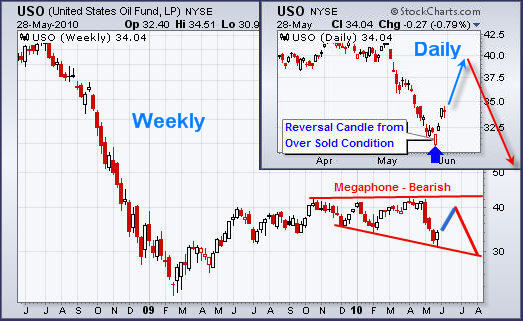
Crude oil Fund (USO) has been struggling to stay up the past 2 months. As you can see the chart below it’s trading at a key resistance level and at this point it could go either way… I don’t like to get involved in trades when they look to be a 50/50 probability of going each direction. If anything I would think oil will head back down as the US dollar continues its strong rally.

Mid-Week ETF Trading Conclusion:

In short, the broad market is in a down trend and selling volume continues to rise. Investors around the world continue to accumulate gold and the US dollar as they seem to be the safe havens for the time being. Oil is also in a down trend and trading at resistance which means we should see lower prices for oil and oil companies and this will weigh heavily on the equities market.

Cash is king and during times of uncertainty that’s for sure… It is very comforting to know we are in cash most of the time and only get involved with the market when there is a low risk, high probability setup on the charts.

If you would like to get my trading analysis and trading alerts check out my services at: www.FuturesTradingSignals.com and www.TheGoldAndOilGuy.com

Chris Vermeulen

GET MY FREE WEEKLY TRADING ANALYSIS

It was another extremely volatile week sharp rallies followed by sharp sell offs. Fear is in no doubt controlling the market. The bulls and bears continue to battle it out. The charts below cover some important trends and market internals I pay attention to on a daily basis.

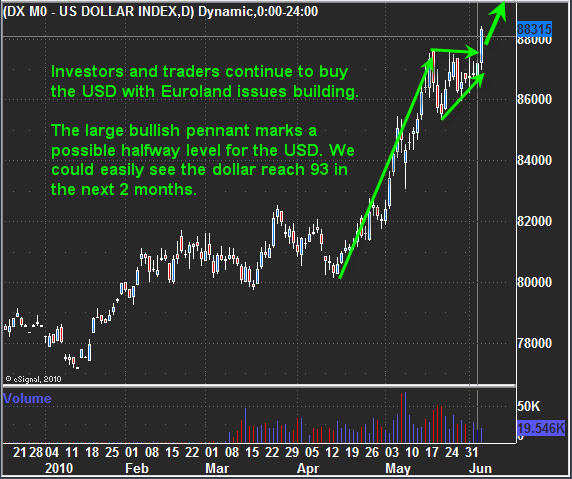
US Dollar Index – Daily Chart

The past two months the dollar as been in rally mode. The last 14 days we have seen a large bullish pennant form and this pattern typically marks the half way point for the current tend. The measured move for the USD is pointing to 93 over the next few months.

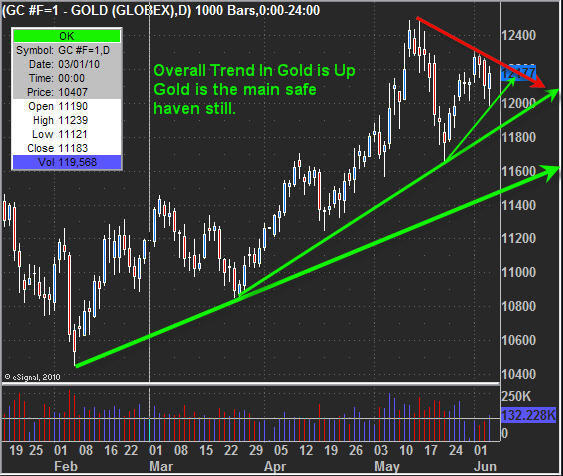
Gold Futures Prices – Daily Chart

Gold as we all know is seen as the major safe haven and the price per ounce has been steadily climbing. Friday we saw the major indexes sell down very hard but both the dollar and gold posted some solid gains. Gold does looks as though it needs some time to digest the recent move higher and this could take a week or two before anything exciting happens but I am on the lookout for low risk setups.

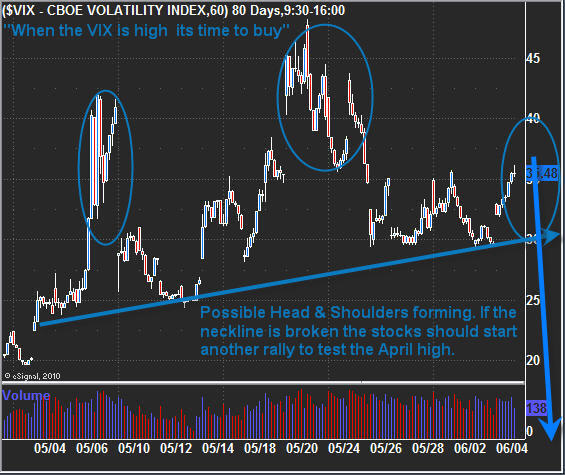
VIX – Volatility Index – 60 Minute Chart

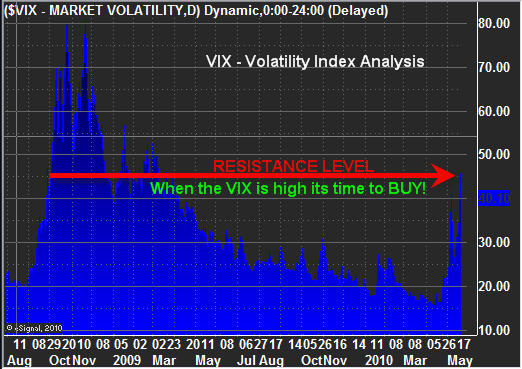
This index measures the fear in the market. When fear is high and everyone is selling their positions we see the VIX jump in price. Over the past month we can see a possible Head & Shoulders pattern forming. If this pattern unfolds like it should then we will see the price of equities bottom in the coming week with the VIX dropping below the blue neckline. The old saying is “When the VIX is High is time to Buy, when the VIX is low its time to Go”.

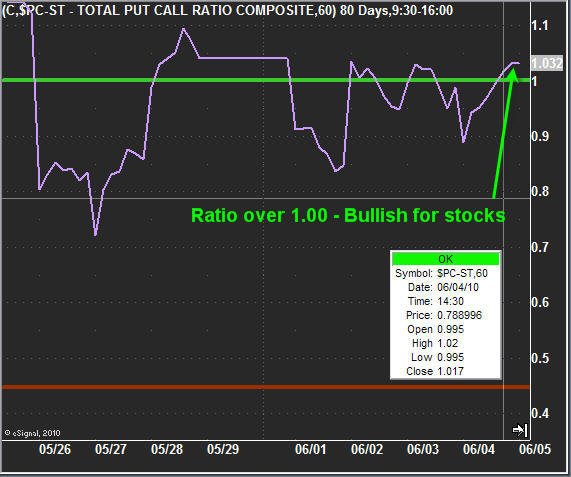
Put Call Ration – 60 Minute Chart

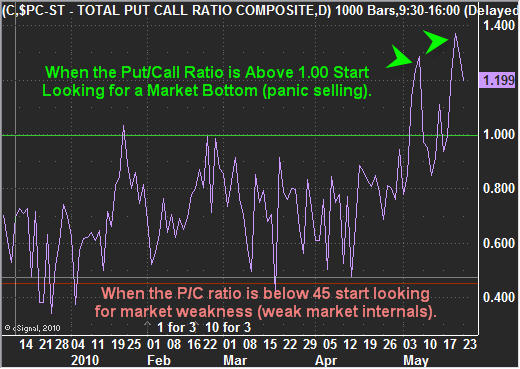
In short, when the put/call ration is over 1.00 then there are more traders/investors buying Put Options than Call Options. Put options are when people are buying leverage to take advantage of lower prices. My thought/opinion about this is when more people are trading with leverage anticipating lower prices, I figure they have sold all their long positions and are now using leverage to profit from lower prices. Well if the majority of individuals have sold everything then in reality there should not be much left to be sold… So I feel this correction which started in April is almost finished.

NYSE Advance/Decline Line – 60 Minute Chart

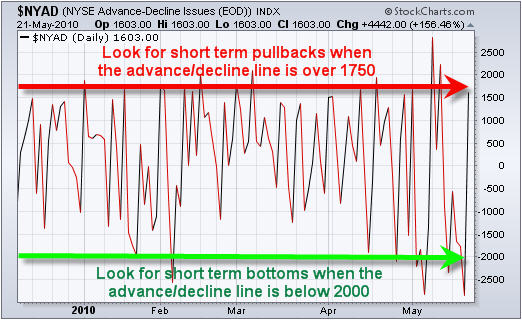
This is one of my favorite charts to look at. While there are several indicators, market internals and technical analysis needed to clearly determine if the market is currently overbought or oversold, this chart is one that can help give you a good idea if you should be looking to buy, short or just stay in cash for the time being.

SP500 Futures Prices- 2 Hour Chart

The SP500 has been up and down like a yo-yo with some very dramatic moves. Up 2+% day down 2+% the next… very sharp and powerful moves can be both every profitable or costly if not traded correctly. Last week we caught a nice 2% gain in less than 24 hours which was an exciting trade. It looked at though the market was about to breakout to the upside and possibly reach the 1150 level but early Friday morning there were rumors about some Euro bank having serious problems and that was just enough to cause a domino effect sending the market lower throughout the entire session closing on a very strong negative note for the day/week.

That being said the market internals are indicating that equities are oversold at these current prices and a bounce is due any time. With the panic selling on the NYSE Friday reaching 119 sell orders for every 1 buy order I think we will see some follow through next week with lower prices, then a rebound once investors finish selling everything they own at which point we will be looking to get involved again.

Weekly Trading Conclusion:

In short, money continues to flow into the safe havens (Gold & US Dollar). The major indices are showing extreme panic selling and look ready to in the next few days. There is a possibility that the market could break down and start another major leg lower which is a big concern to me. I will be glued to the market internals and support levels for the major commodities and equity sectors in hopes to catch the bottom or to avoid another melt down.

If you would like to receive my Daily Pre-Market Videos and Trading Alerts please checkout my website at: www.FuturesTradingSignals.com

Chris Vermeulen
Get My Free Weekly Technical Updates Free Below:

It’s been a very exciting week so far for gold and SP500 traders as we take advantage of mass crowd behavior. Trading against the masses can be very profitable during certain situations but more times than not it’s a great way to lose money which is why I focus on taking the opposite side of these moves.

This week I decided to do the mid week report in a video format which I think not only saves everyone time but also allows me to get more information over to you. The video shows a low risk gold setup and a low risk SP500 trading setup which I think will open your eyes to some new things.

Last week we took a long position in gold at $1180-85 level buying near the bottom as investors panicked out of their positions. Using market internals, sentiment readings and my own special blend of technical analysis to find these low risk setups which pack a powerful punch when traded correctly.

The chart below shows gold from its bull market in 2009 right through to the current rally, which is making us some decent money. While I am bullish on gold and feel it will eventually reach $1400 per ounce I do think there will be several more opportunities to cash in on gold’s price action as this rally matures… I explain more in the video below.

Gold & SP500 Low Risk Trading Setups


Click Here to View the Video: http://www.futurestradingsignals.com/trading-education/gold-and-es-futures-trading-video/

Mid-Week Low Risk Gold & SP500 Trading Conclusion:

I hope you enjoyed the video as I showed you some important trading tools for helping to trade extreme conditions in the market. As my buddy from ActiveTradingPartners.com always says “Buy when they Cry, Sell when the Yell” which is exactly what needs to be done in order to profit from the market month after month.

If you would like to get my Low Risk yet Powerful Trading Alerts be sure to checkout my service at www.FuturesTradingSignals.com

Chris Vermeulen
Wednesday May 26th
It’s been an exciting week for traders as volatility levels are through the roof and the broad market is moving up and down like a yoyo. You cannot take your eyes off the screen if you have a large amount of money invested as you can quickly find yourself with a large profit or loss in the matter of minutes….

Although we have seen stocks jump around the past few days precious metals have held strong with very little volatility. This is because of the economic fears looming for the US and other countries of possible financial collapse. This fear is helping to boost gold and silver prices because they are seen as the safe haven. Also we are seeing money move in the US dollar because the country is still seen as a leader in many ways helping to boost the US dollar.

Below are a couple charts on Gold and Silver ETF’s showing the end of last years rally and the correction in prices which are now looking to setting up for another leg higher.

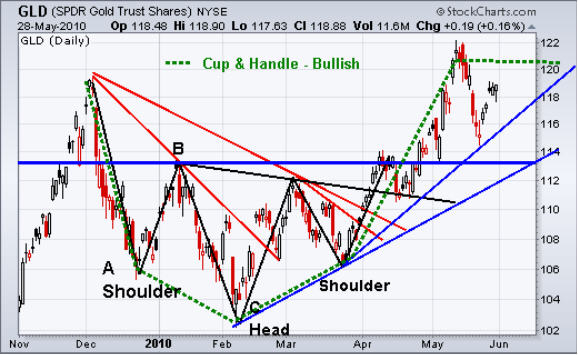
GLD – Gold ETF Trading Vehicle – Daily Chart

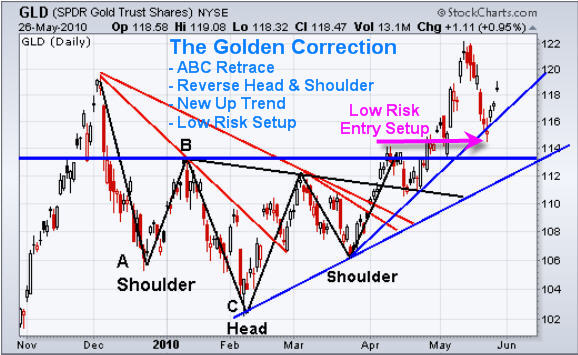
I called this chart “The Golden Correction” because it literally is. We saw prices rally late in 2009 finishing off with a parabolic spike which we know is not sustainable and almost always results in a VERY sharp drop. This correction unfolded as planned with an ABC retrace which shakes out weak positions. We then we saw a reverse head & shoulders pattern form which again also shakes out weak positions. Once the neckline was broken from the reverse H & S the new up trend was started providing a couple trading opportunities for us along the way. The most recent low risk entry point can be seen on the chart as gold prices dropped back to a key support level.

ETF Trading Newsletter

Gold Futures Price – 60 Minute Day Trading Chart

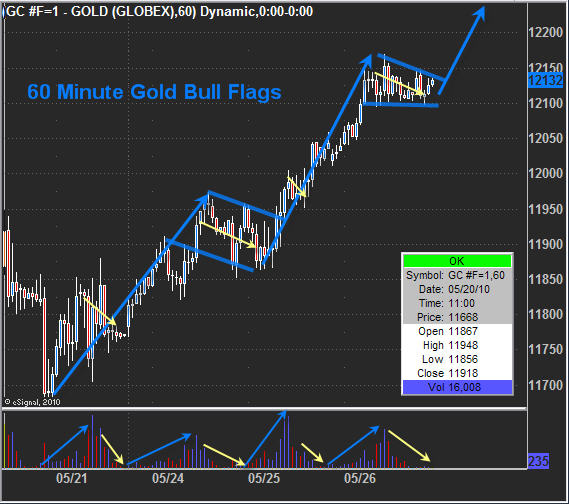
Gold has been showing some very bullish price action the past week forming several mini bull flags with confirming volume levels. I think we should see gold pop another $5-10 bucks in the very near future if not continue higher for several days.

Index ETF Trading Newsletter

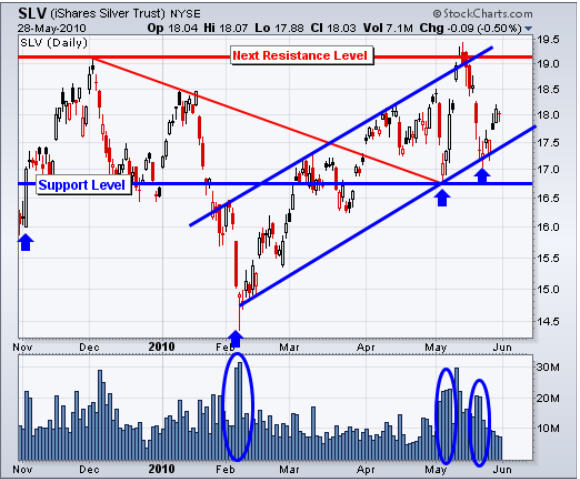
SLV – Silver ETF Trading Vehicle – Daily Chart

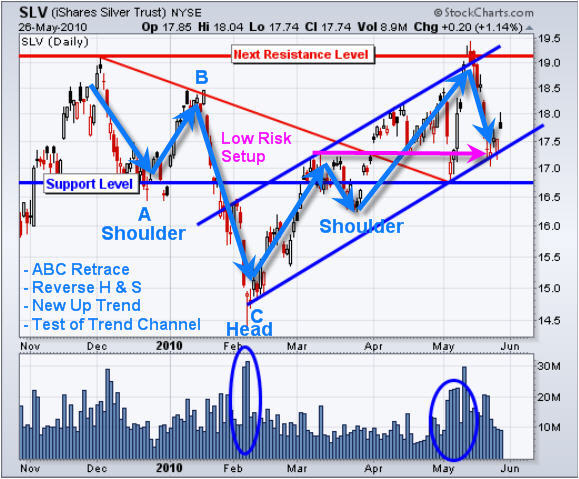
Silver formed much of the same patterns as gold but with much more volatility. Also silver has yet to break the 2009 high which is surprising but with a large part of silver being use for industrial purposes it does make sense as the economy is not as strong as it was thought to be in 2009. Silver carries much more risk when trading because it has more random moves and increased volatility.

ETF Trading Strategy

Mid-Week Precious Metals Trading Conclusion:

In short, gold and silver are in an uptrend and looking strong. Both are currently trading at short term resistance levels on the daily chart which has caused them to stop moving up today (Wednesday May 26th) but on an intraday basis they look solid and could break though these resistance levels.

That being said buying way up here adds a lot more risk because a good chunk of the move has already been made and if prices do roll over and start heading back down the next support level is several percentage points away for placing a protective stop with the proper amount of wiggle room.

If Trading Gold, Silver and Index Futures and ETFs interested you check out my trading services at www.TheGoldAndOilGuy.com

Chris Vermeulen

Get My Free Weekly Stock Market Trading Analysis Sent To Your Inbox:

May 23 2010
The stock market topped in April which was expected from analyzing stocks and the indexes. Back in April I posted a few reports explaining how to read the charts to spot market tops. Today’s report is about identifying market bottoms. Market Top Report: Click Here

It does not get much more exciting than what we have seen in the past 2 months with the market topping in April and the May 6th mini market crash. This Thursday we saw panic selling which pushed the market below the May 6th low washing the market of weak positions.

For those of you who have been following me closely this year I am sure you have noticed trading has been a little slower than normal. This is due to the fact that the market corrected at the beginning of the year and we went long Feb 5th and again on Feb 25th. Since then the market rallied for 2 months and never provided another low risk entry point. In April the market became choppy and toppy and we eventually took a short position to ride the market down. Now were we are looking at another possible reversal to the upside.

Only a few trades this year which I know frustrates some individuals but if you step back and look at my trading strategy you will learn that we only need to trade a few trades a year to make some solid returns. I don’t know about you but I would rather trade a few times a month and live life between trades… not trade all day every day getting bug eyed in front of the computer.

Ok enough of the boring stuff let’s get into the charts…

SP500 – Stock Market Index Trading ETFs & Futures

The pullback in the broad market was expected but the mini crash on May 6th really through a wrench into things for us technical analysts. We don’t really know the truth about what happened that day… was it just a simple error or was it a planned error for the US government to take a massive short position to move something in their favor quickly to generate MASSIVE gains? It leaves us technicians hanging wondering if that was a shift in trend from up (accumulation) to down (distribution)?

My thoughts are if the crash was truly an error then we will see months if not another year of higher prices… But if it was a planned sell off with banks moving to the sidelines then we are most likely headed into another bear market. Personally it does not matter what happens as big money will be made in either direction. Problem is if we do go into another bear market then the majority of individuals will lose capital as investor’s portfolios get smaller and smaller. That will lead to a lot of depressed people…

In short, I am neutral on the stock market for the intermediate and long term. Once we have a few more months of price action only then will I have a plan for longer term investments. But on the short term time frame the market is screaming at me with extreme sentiment levels lining up on the stock market and gold.

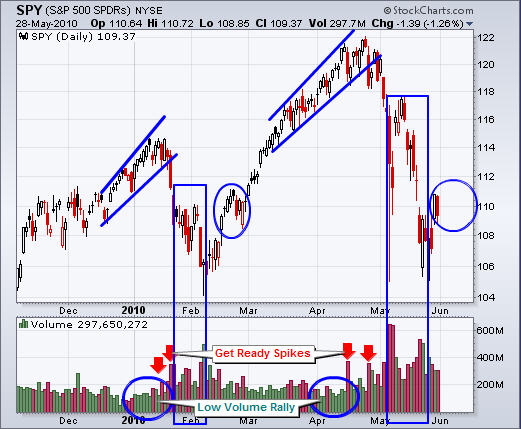
The daily chart of the SPY – SP500 Index shows several important points which help me time market bottoms. We have prices trading at a support zone. Buyers step back into the game here and should provide a decent bounce which started Friday Morning.

Next we have the panic selling spikes from an indicator I created. Generally the day after we see panic in the market like we did on Thursday we will see a big bounce and many times a large rally.

Down at the bottom you can see my custom market cycles which are both starting to bottom. During times like this the market has a natural tendency to move higher.

v


VIX – Market Volatility Daily Chart

The VIX has an old saying “When the VIX is high its time to buy, When the VIX is low, its time to go”. Simple analysis clearly shows the VIX trading high and at a resistance zone.

VIX - Volatility Index Trading

Put/Call Ratio – Daily Trading Chart
This chart measures the amount of put and call options traded each day. When it is trading over 1.00 then we know for every 1 call option traded (wanting the market to go up) there is 1 put option traded (wanting the market to go down). Over 1.00 is extreme and when that many people are bearish and using leverage to profit from a drop in price then in my opinion it means everyone has already sold and the selling pressure is about to end.

Actually if you go back in time and review SP500 and this ratio you will notice 2-3 days after this ratio reaches 1.00 or higher the market bounces/bottoms.

Put Call Ratio Trading Strategy

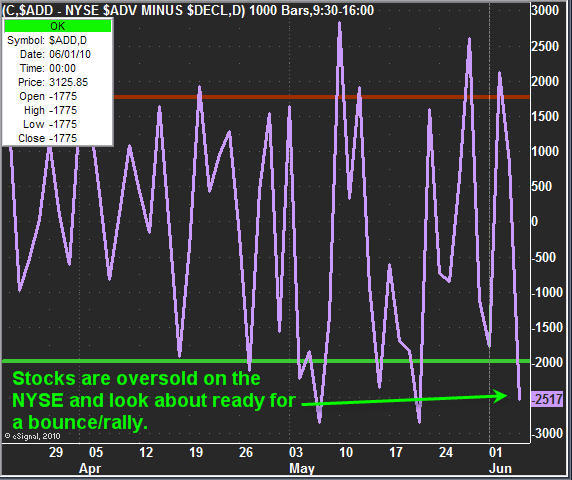
NYSE Advance/Decline Line for Equities – Daily Chart
This chart shows us how many stocks are advancing or declining on any given day. When extremes are reached look for a short term bounce or bottom 1-3 days following.

NYSE Advance Decline Line Trading

How to Identify Stock Market Bottoms with Simple Analysis:
In short, I feel the market is forming a bottom here. How big of a rally will we get? I don’t know because of the mixed signals from the May 6th EXTREME heavy volume selling session. As usual I focus on trading with the trend, trading the low risk setups and I manage my money/positions scaling in and out of those positions as I see fit.

If you would like to receive my Real-Time Trading Signals & Trading Education check out my website at www.FuturesTradingSignals.com

Chris Vermeulen
8:41am ET, May 21, 2010

Yesterday we started to see extreme panic selling in the broad market. This can be seen by looking at the up/down volume, advance/decline line for stocks and the speed at which the market was dropping. Only a few times a year do we get extreme levels like this and they tend to lead to sizable gains if traded correctly.

A lot has changed with my overall market outlook in the past month. At first I thought the intraday market crash was a human error and should be somewhat ignored but with the level of selling we are seeing now I am starting to think we have formed a market top in April. Don’t get me wrong, I do not have a bias as to which way I want the market to go. It does not really matter as I simply follow the trend and trade the setups.

Here are my charts and thoughts of what is happening in the market:

Broad Market – Indexes and Stocks

As you can see from the chart below the red broadening pattern is starting to concern me. During a bull market like we are in now, a broadening pattern is seen as neutral or bearish price action. This type of pattern has be on edge because in the past patterns like this have been the top. But I think we should see a bounce up to retrace half of the sell off from the April top. Then we will evaluate the situation from there.

Blue Support Levels currently the market is trading around a support level which tends to force the price to change direction. We have yet to break the May low and that could be broken today depending on the follow though from yesterdays panic selling. We could see the low get penetrated briefly then reverse back up sharply. This quick break of the early May low will shake out the final group of traders/investors before the market bottoms.

Green Panic Selling has helped to point out market lows for all of 2009 and 2010. Yesterday we had new high showing us that there were 37 sell orders for ever 1 buy order on the NYSE. I was getting a lot of emails yesterday from traders in panic wondering what to do. These emails are also an indicator that the market is bottoming…

SP500 - SPY - ES Mini Trading Newlsetter

US Dollar Index

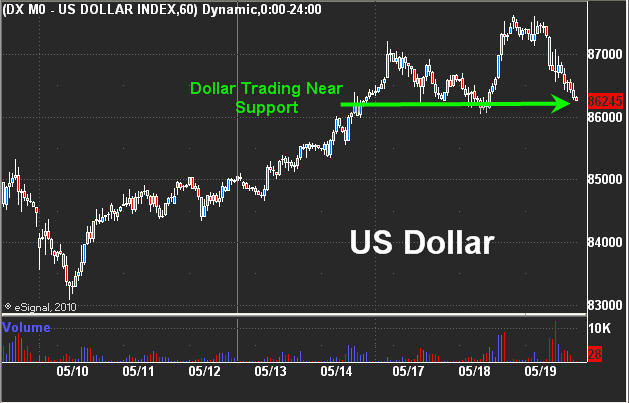
The US Dollar chart below looks as though it has topped on the 4 hour chart. We could see the dollar drop for 1-3 weeks which in turn will help boost stocks and gold s they both seem to be bottoming.
US Dollar Index Trading Newsletter

Trading Conclusion:

In short, the market is trying to bottom as I mentioned in the Wednesday report. Volatility has spiked, stocks and commodities are jumping around shaking out stops and investors are in a panic selling what they own and getting back into cash…

It’s Friday and when a big move happens on Friday we have to expect some follow through on Monday as all the weekly chart traders and people not watching the market last week will see the sell off and exit their positions on Monday adding more pressure on the market.

With all the recent selling I feel most of the risk has been taken out of the market already but we must remain cautious still. I am looking to buy (scale in over a couple days) the SP500 and Gold using the Best Trading vehicles which members have access to along detailed trading information like entry, price targets, protective stops money management and trading education.

If this is of interest to you be sure to checkout my Stock, ETF and Futures Trading Services www.TheTechnicalTraders.com

If you want to receive my free weekly technical reports be sure to opt-in to this Free Trading Newsletter:

Chris Vermeulen

May 19th 2010
It has been an interesting week in the market as stocks and commodities push to extreme support levels. Below I have posted some charts showing where the market is currently trading at and what I think is likely to unfold.

Gold Futures – 4 Hour Candle Stick Chart
The price of Gold is testing a key support level. I figure we will see gold try to stabilize over the next week or so as it digests the recent drop in value then start to head back up.

US Dollar Index – 60 Minute Candle Stick Chart
The US Dollar and gold have been moving together the past few weeks as more countries pop up on the radar for serious financial issues. This is helping to boost both the US Dollar and gold as investors around the world starting buying what seems to be safety. The dollar has had a sizable pullback and is now testing a key support level.

This could be the start of a possible Head & Shoulders pattern forming which means the dollar rally could be nearing maturity in the next couple weeks.

Crude Oil Futures – Daily Trading Chart
Oil has been under serious selling pressure because of the rising USD. It has now dropped to a key support level and is starting to look very interesting. If the US Dollar bounces in the next week or two it will keep downward pressure on oil. I think this bottom is going to be a process not a one day event.

SP500 – Daily Trading Chart
Stocks have been under dropping like flies the past few weeks and shorting the SP500 last week at 1170 has played out very nicely for members. The broad market is giving me mixed signals and when I am unsure of a trade I stand on the sidelines. It’s always better to sit in cash and watch things stabilize than it is to watch your hard earned money evaporate. We could see a wave of panic selling in the stock indexes testing the previous lows so be cautious.

Mid-Week Stock & Commodity Trading Report Conclusion:
In short, I feel gold and the dollar will bounce in the coming days from their support levels. This will keep pressure on oil & the SP500 holding them down near support. Once the US Dollar forms a possible right shoulder we will most likely see them pop and rally.

We are still 7 trading days away from a cycle low on the broad market making this scenario very likely to play out. At the moment I am getting a lot of mixed signals and during times like this I prefer to stay in cash because volatility will rise and it is easy to get shaken out of trades.

If you would like to get my Real-Time Trading Signals & Setups checkout my services at www.TheTechnicalTraders.com

Chris Vermeulen