The market continues to become quicker and fiercer as it move up and down 2+% on a regular basis This week we have seen some wild price swings due to earnings, events and the Fed’s which just makes trading that much more intense.

I have pointed out yesterday that this market only gives you a brief moment to take profits before it starts going wild shaking traders out of positions. This increased volatility is caused from a couple of things:

1. Traders/Investors know the financial system is still riddled with unethical practices/manipulation. This causes everyone to be extra jumpy/emotional and causes volume surges in the market as the herd starts to get greedy or fearful.
2. Volume overall on the buying side of things just isn’t there… I see some nice waves of buying but it doesn’t move the market up much… then it only takes a small wave of sellers for the market to drop… Investors are just scared to buy stocks and that is not a good thing…

I keep a close eye on the buying and selling volume for the NYSE as it tends to help pin tops and bottom within a 2-3 day period. In short when we get panic buying meaning 75%+ of volume is from buyers then I know the general public is jumping into the market buying everything up and that’s when the smart money starts to scale out of their position selling to these retail investors. These retail investors are buying on news and excitement much like what we are seeing now with earnings season. Stocks have run up for 5-10 days, as the smart money buys in on anticipation of good news, then the earnings are released which are better than expected and the stocks pop and drop. Well the pop higher on BIG volume are all the retail investors buying and are generally the last ones in. The smart money is quickly selling into this buying surge so they end up getting out at high prices.

My point here is that in general I see 4-6 of these panic buying or selling days a year which I find are tradable. The crazy part is that we have seen 11 of these panic days (both buying and selling) in just 8 weeks… We are seeing more selling than we did at the bottom in 2009! Something big is about to happen and I want to make sure we get a price of it once the moves starts.

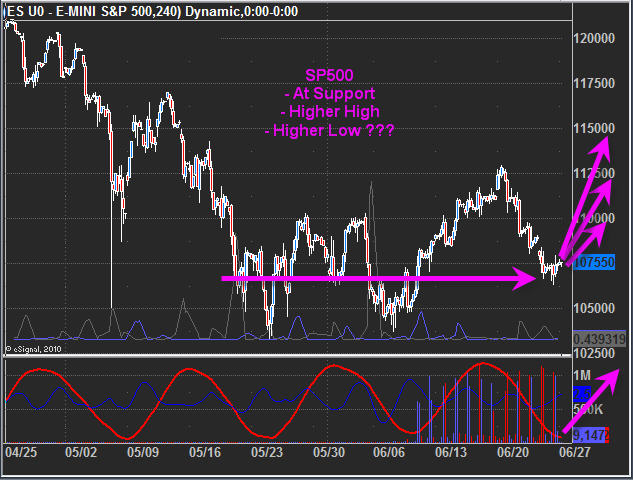
Anyways, below is a chart of the SP500 showing how its trading under some key resistance levels. Today the market gapped up testing the 50 day moving average and above the 5 day moving average then sold down very strongly during Ben Bernanke’s speech. This is not a good sign for the overall health of the market.

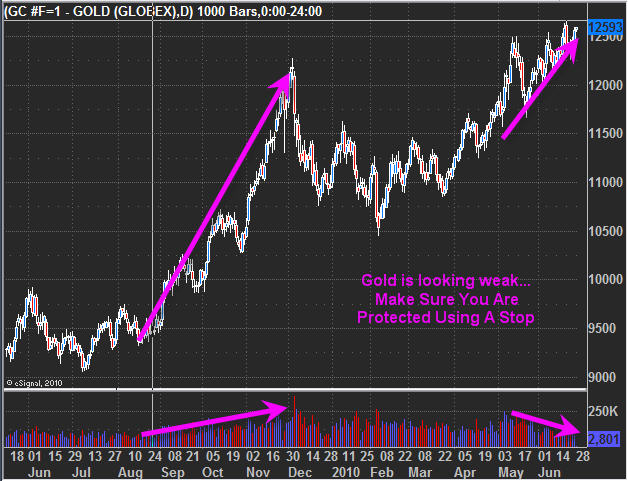
On the commodities side of things we are not seeing much happening with gold or oil at the moment. Gold is still in a short term down. And gold took an $8 drop today when Ben Bernanke said inflation would remain low for an extended period of time.

As for crude oil, yesterday afternoon I pointed out to members that oil had a big run up on virtually no volume Tuesday and it would most likely give back those gains today. We saw this today with oil dropping from $78 down to 76.50 per barrel. Overall Oil looks like it wants to go higher but has some work to do before that can happen.

Mid-Week Trading Conclusion:
In short, the market remains choppy and we are getting more than normal news/events which are moving the market and this is causing extra noise and volatility for traders. Cash is king during volatile times and if you are doing some trades be sure to keep the positions small for another month or so.

If you would like to receive my detailed trading analysis and alerts be sure to checkout my websites at www.TheGoldAndOilGuy.com or www.FuturesTradingSignals.com

Chris Vermeulen

Get My Free Weekly Trading Reports!

It was an interesting options expiration week for equities that’s for sure. We saw some very choppy price action with large waves of buying and selling as the bulls and bears fought for control.

Both Gold and Oil closed lower for the week which is not a good sign considering the US Dollar dropped like a rock along with them.

Below are a few of my charts

GLD – Gold ETF Price Action

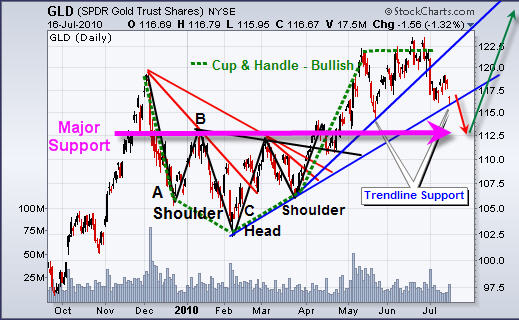
Gold continues to pull back from the June highs. It looks as though it could form an ABC retrace pattern if the July 7th low is broken. If $1085 is broken we should see gold drop to $1165-75 level. On the GLD etf that would be around the $112.50 – $113.50 level. That should shake out the majority of weak positions and start to rally towards the $1250/60 level.

Crude Oil – USO Oil Fund

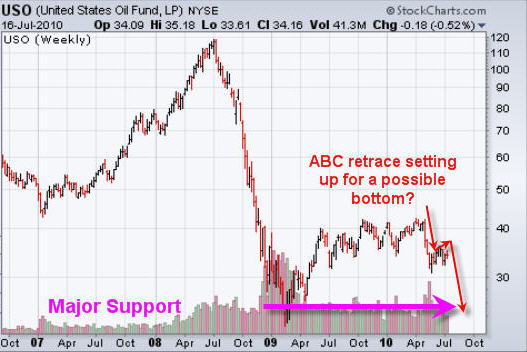
This is a weekly chart of oil which clearly shows how selling volume has risen and the trend since 2009 has gone up, sideways and is now heading back down. The bear flag forming on this weekly chart looks about ready for another leg down. Once that occurs we could see a test of the 2009 lows.

Using some inter-market analysis crude oil tends to move in the opposite direction of the US Dollar. From a quick glance at the dollar chart is looks about ready to bounce which will send oil sharply lower. It will be interesting to see how this unfolds over the next 2-3 weeks.

SP500 – SPY Index Fund

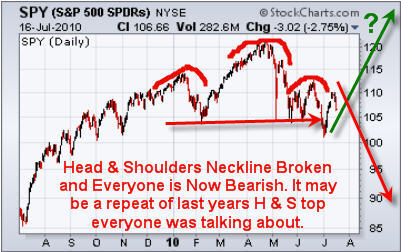
Friday we saw some the SP500 sell off on heavy volume after testing its 50 and 200 day moving averages which are key levels for trading and investors to take profits or add to their short positions in hope for another multi day sell off.

That being said, there is still a good change of higher prices and for all we know this could be the start of another multi month rally. While I am more inclined for us to play the down side this week I will not have a problem taking a long position if we start to see the market internals and breadth improve alone with bullish price action. I monitor the 60, 30 and 10 minute charts which allow me to get a feel for the overall short term trend and strength.

Weekend Trading Conclusion:

Overall it looks like we could have a couple more days of weakness for stocks and commodities. The US Dollar is very much oversold and as of this writing it looks like its starting a small bounce. A rising dollar tends to put downward pressure on gold and oil along with the large multi national companies.

Equities sold off Friday with a slow grind down from 9:30 -4pm never putting in any type of bounce when looking at the 60 minute chart. The SP500 and other indexes are way over sold after Friday and I am expecting some follow through Monday as investors review the charts over the weekend and see what happened on Friday. That should cause another wave of selling in the morning as traders panic out of positions.

It’s going to be an exciting week for sure!

If you would like to receive my trading analysis and trade alerts be sure to checkout my services at: www.TheGoldAndOilGuy.com & www.FuturesTradingSignals.com

Chris Vermeulen

It’s been another strong week for equities but are stocks and commodities about to get hit with some selling pressure?

I have put together a short video coving all of these investments but here is my Coles Note Version:

US Dollar:
The Dollar is way oversold and looking ready for a multi day bounce. This will put pressure stocks and commodities.

Crude Oil:
Oil is trading at resistance and with the Fed minutes reported today saying they are some what concerned about the economy still this pulled oil down late in the day. Also if the US Dollar bounces it will add downward pressure to oil.

Gold:
It’s a tough call on gold because it could go either way here… It could be seen as a safe haven in stocks fall in the coming days, or if the US Dollar moves up then it will put more downward pressure to gold. I feel money can be made a breakout to the up side or the down side. Explained in the video.

SP500:
Stocks are overbought across the board making things look toppy. We are seeing good earnings from Alcoa, CSX and Intel but the stocks are selling off on the good news which is a bearish sign for the equities market overall. The SP500 gapped up on Tuesday and has been trading sideways in a tight sideways channel building power for the next breakout. Tension is building and we should see a breakout from this channel tomorrow (Thursday). The Odds are pointing to lower prices but only time will tell.

TECHNICAL MARKET VIDEO:

Cant See the Video? Click Here: http://www.thegoldandoilguy.com/july-14th-technical-market-analysis/

Get my Trading Analysis and Alerts:
www.TheGoldAndOilGuy.com
www.FuturesTradingSignals.com

Chris Vermeulen
Last week we saw stocks move sharply higher as traders started to cover their short position which added fuel to an already oversold market ready to bounce. Overall volume was not that strong on the move up which is a bearish sign. On Friday afternoon we saw the SP500 continue to move into the $1075 resistance level on very light volume. This indicates to me that buyers are not willing to pay these higher prices because the market has moved up so quickly and the fact that it’s trading at a resistance level.

I feel the market will gap higher on Monday just like we say on June 20/21 deep into a resistance level and the big money will short the pop sending it sharply lower.

Gold looks to be shifting its momentum from a down trend to an uptrend. It’s forming a reverse head & shoulders pattern which is shown in the video posted below.

Here is My Technical Trading Report Video Covering:

– Gold
– US Dollar
– SP500
– Market Internals
– On Balance Volume

iPhone/iPad Video Format: Click Here

Weekend Conclusion:

In short is looks as thought the market is at a critical pivot point. We could see prices stall out here and continue the down trend or see strong buying step in sending prices higher in the equities market. We need to wait and see what type of price action unfolds in the coming days.

If you would like to receive my trading alerts and education checkout my service at www.FuturesTradingSignals.com or my swing trading service at www.TheGoldAndOilGuy.com

Chris Vermeulen

Get My Free Weekly Update Delivered to Your Inbox!

July 7th, 2010
It’s been a short but exciting week so far. Investors and traders are have been scratching their heads the past few days as stocks continued to bounce around giving mixed signals. But today was a clear day of short covering from this much oversold market condition.

Below are a few charts showing what I’m currently thinking will unfold in the near future.

Gold Futures Trading – 2 Hour Chart

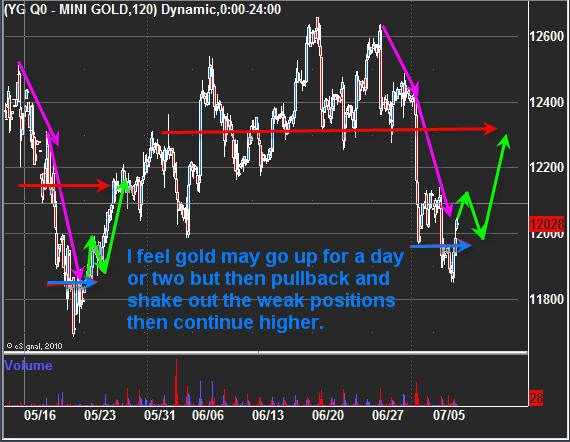
In the past couple weeks we sold our position in gold at $1255-60 area in anticipation for this sharp drop. The market was kind enough to show us though its price and volume action that a nasty drop was just around the corner. Currently we are in cash waiting for the down trend momentum to stall and reverse before taking another long position in gold. I feel it could still drop one more time, but the chart is giving mixed signals when reviewing the short term charts.

Crude Oil Futures – Daily Trading Chart

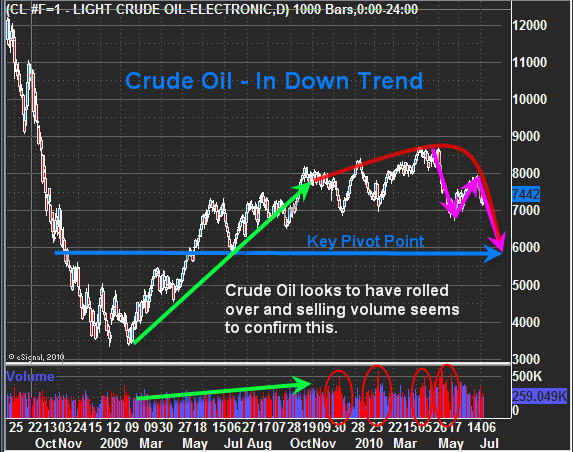
Crude has seen a shift in the trend over the past 2-3 months. Selling volume over took the buyers and are now pulling prices down into bear flag pattern which means lower prices still.

SP500 Futures – 60 Minute Trading Chart

SP500 and other major indexes have been selling down the past couple weeks. Tuesday we saw the market gap up very big then sell off. But that surge higher was an early warning sign that the selling momentum was slowing for the time being.

1075 on the SP500 is a key resistance level and a point which many traders will be taking profits and trying to short the market. That will create a lot of selling pressure at that level and only time will tell if we can clear it.

Mid-Week Commodity and Index Trading Conclusion:

It looks as though we are getting the over due bounce in the stock market everyone has been anticipating. The large rally today (Wednesday) has covered most of the ground as it has moved up over 3% today. Overhead resistance looks to be only 2% away before sellers step back in and try to pull the market back down.

If the market goes up for another couple days then gold should have a small pullback to test support. When the equities market starts to drop again money should flow back into gold and send it higher as the safe haven of choice.

Crude oil broke down late last week and this week it bounced back up to retest the breakdown level. This is common and once complete oil should continue to drop.

The market is still in a strong down trend on an intermediate basis so be sure to lock in profits once your investments reach key resistance levels. If you don’t the market has a way of taking back those gains very quickly in the current market condition.

To get my detailed trading signals signup to my trading services:
ETF & Futures Swing Tradingwww.TheGoldAndOilGuy.com
ETF & Futures Active Trading & Educationwww.FuturesTradingSignals.com

Chris Vermeulen
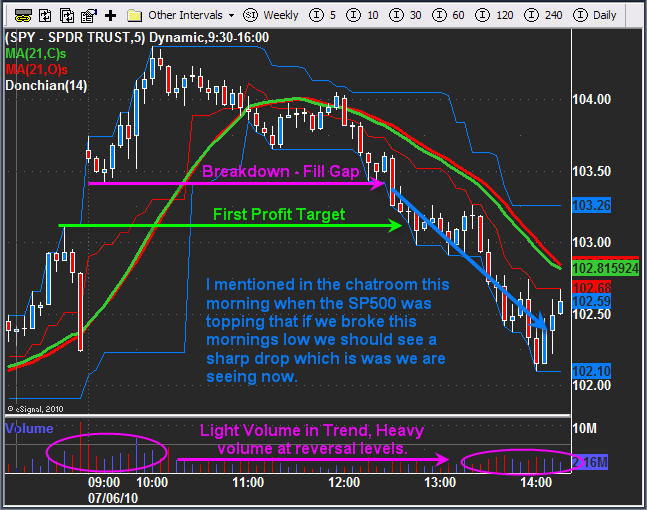
Its been an exciting day with the SP500 breaking below this mornings low using the regular trading hours 9:30-4 for this analysis. As i mentioned before I don’t trade during the afternoon. Most large moves tend to happen between 9:35am – 11:30am, and 3:30-4pm. I did mention at 11:28am this morning in the chatroom that if we saw this mornings low broken then we should see a short drop. Below is a chart of how it has unfolded so far today.

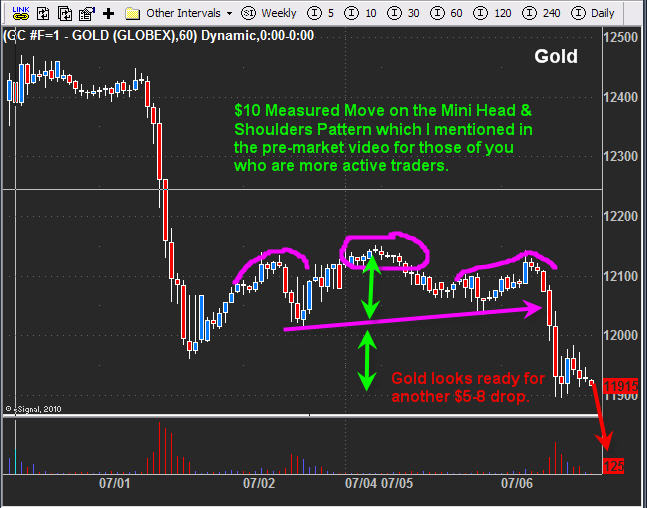
Also in this mornings pre-market video I pointed out how gold looked ready to drop again with the mini head & shoulders patterns and bearish volume levels. We saw a nice drop this morning which is posted in this chart below.

Overall we are waiting for a larger setup using the 60 minute chart and daily charts for some sizable setups. As most of you know I do point out trading opportunities in the chatroomn for those of you who are more active with some experience under your belt. But to be honest these quick intraday moves are just to fast for me to type up an alert, send it out, then have everyone read it and take action if the setup occurs. Those of you who do not feel experienced enough for these quick day trades can just stick with my momentum trades which are based on the 60 minute chart and the swing trades as they come available.

That being said I am looking into some live webinar services so you can view my screen and hear me talk during the morning or afternoon hours depending on the market conditions. I’m not saying this is going to be the way of things going forward but I want to test it out because I do think it will be much better than just a chatroom and we can do more trades over the long run as well.

Chris Vermeulen
www.FuturesTradingSignals.com

Another blood bath in the market today but this time it’s a total market melt down with Stocks, commodities, precious metals, and the US Dollar plummeting lower.

Since late April the market has become very unstable with large intraday price swings. Since then it has only gotten tougher and tougher to trade. While there have been some decent setups having caught a few nice SP and gold trades, this is a time when the big money guys step back from the market until the dust settles. Only taking small quick trades to profit from the wild daily swings which happen in a blink of an eye.

Gold, its trading at a key support level now that is dropped $20 to $1220. But this type of selling tends to carry over for a 1-2 days in gold as the rest of the world realizes the drop and they sell out of their position. So I’m not doing much on gold right now. If we get a nice low volume drift up today or tomorrow we could take a short position but going into the long weekend I think cash is the safe thing to do. We could see gold dip to the 1200, 1175, or 1150 area depending on how the rest of the world reacts to today’s sell off.

Oil, it’s in a down trend selling off hard with the US dollar which is not normal. If we see the US dollar bounce I figure oil will take another beating… It could drop to $62 a barrel over the next month or so…

SP500 is WAY oversold, and has been for about a week now. The index went from an uptrend and we bought the oversold dips, but then the market turned into a down trend and shorting the bounces is what we are now looking for. On the short term basis, trading the SP with a swing trade carries a ton of risk. If this is the breakdown of the head & shoulders pattern everyone is talking about then we could see the market drop another 100 points real quick. On the other side of that coin, this week we have seen 90% of volume being selling volume which indicates washout panic selling and tends to be a bottom for a bounce or rally. So you can see how shorting an oversold market is dangerous and why buying a falling knife is also equally dangerous. Waiting for a setup is crucial.

I am not sure if I will be around for the close today as I’m spending the holiday with my wife and daughter which is much needed. But what I am thinking could happen if the market stays down at least 0.5% lower for the day is an afternoon sell off around 3:40-3:45 when end of day orders, margin calls and the leveraged ETF rebalancing starts to happen. This sell off tends to last 4-10 minutes but it has the chance of triggere a much larger sell off into the close so scale out quickly once some of your position is in the green.

If any of you are day traders then you will know trading between 11:30 – 3:00 is a waste of time in most cases. The best trading is between 9:35 – 11:00, and 3:30 – 4:00pm. That’s when the market makes real moves/trends which are tradable for making real money. Many of you are trading through the afternoon and just churning your account trying to make money but you just paying a lot in commissions and adding more stress and risk to trading than there needs to be. As much as we don’t like to see large moves without us, part of trading is to wait for some good plays and not get sucked into trading the noise in the market…

Get my Real-Time Trading Alerts at: www.TheGoldAndOilGuy.com

Talk to everyone later
Chris Vermeulen

June 30th, 2010
What a nutty week for the equities market! The bleeding has not led up with almost 2 weeks of straight selling. Also we are seeing oil break down with a rather large bear flag and if that happens, which it looks like it will… then hold on tight or cash out of the market!

There has been nothing but negative news for the past month and its not looking like there is much light at the end of the tunnel for a long time still… The only places which people feel some safety is in gold and silver. That being said the market is way over sold here and we could get a bounce lasting a couple days soon. But that bounce will be sold and pulled back down as it looks like a new bear market is starting.

Here are few charts of how I am seeing things in general.

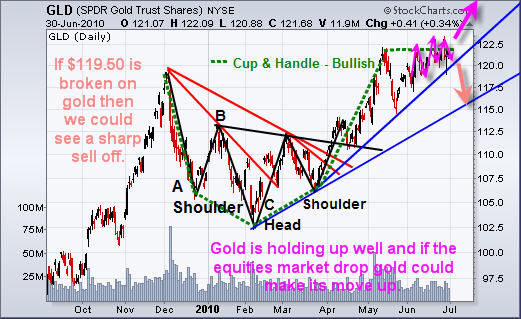
Gold ETF GLD – Daily Chart
Gold has formed a large cup & handle pattern. It has held up well during the recent weakness. But zooming into the intraday charts I do have some concerns about a sharp sell off in the very near future. We recently bought gold at $1226 and sold out between $1255-1260 a couple days later because it’s not just screaming at me as a great buy. I am not a gold bug, I’m a trader who finds low risk opportunities, gets in and out with maximum profits and minimal draw downs spending most of my time in cash. They way I see things is that there is always another trade just around the corner.

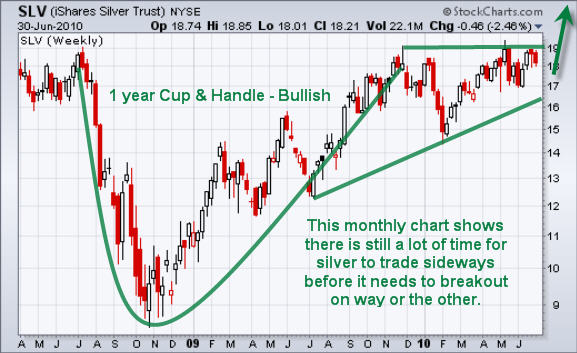
Silver ETF SLV – Weekly Chart
This is a weekly chart and goes all the way back to 2008 showing a very large cup & Handle. We could technically still see silver trade sideways for several months before it reaches the apex and is forced to breakout in either direction. The up side potential for a cup and handle pattern is 100- 300% of the height of the cup. So this means $1450 gold and $29 silver using the minimum potential. Now you can see why so many people are buying precious metals… they want a big move… All that excitement and greed could catch up to them if we see a complete market melt down again which will pull EVERYTHING down with it including gold and silver. This is one of the reasons why I cashed out this week near the high.

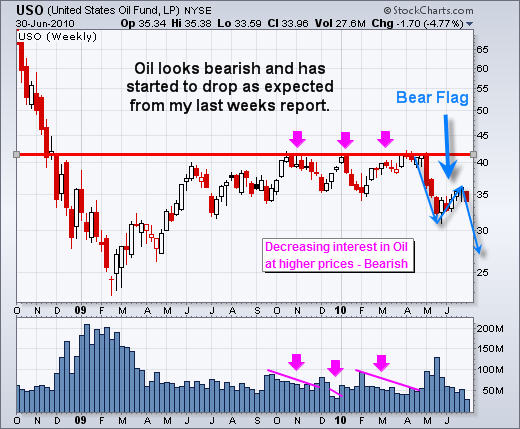
Crude Oil Fund – Weekly Chart
Oil formed a triple top over the past 10 months and has started to head south. We have seen selling volume drop during the test of resistance which is not a good thing. A heavy sell off from resistance as everyone bailed out of the investment sent oil tumbling and just this week oil started to break down from its bear flag. We are looking at USO to possibly drop to the $25-27 area and oil to drop to the $60-62 level over the coming 2-3 months.

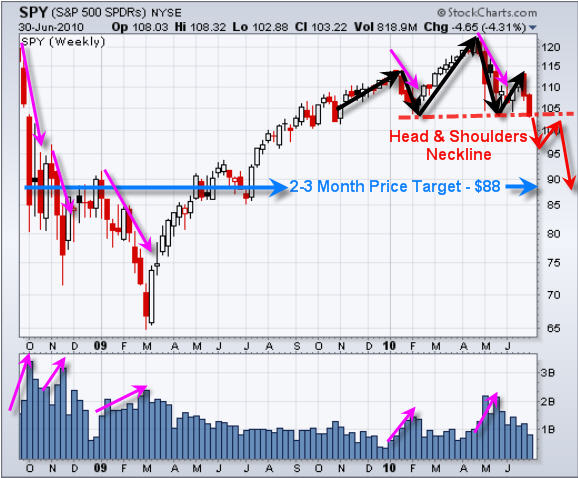
SP500 ETF SPY – Weekly Chart
The SP500 along with several other indexes have formed a head & shoulders patter and appear to be in the process of breaking down through the necklines. If this unfolds then we are looking at much lower prices for stocks. It is important to buy some protection on the down side or get into cash until the dust settles as we can always buy back in, but we cannot get back lost money as easily.

Mid-Week ETF Trading Conclusion:
In short, I really hate to be negative on the market and economic outlook. I know if the market crashes again the majority of individuals who have worked hard, saved money and invested using mutual funds will lose most of their money in a fraction of the time it took to create the wealth, and that is a uncomfortable thought. Nothing worse than just getting to retire then seeing half of your money vanish.

Anyways, the good news is that we can avoid these market crashes and actually take advantage of them using inverse ETFs which go up 2 or 3 times faster than what the market is declining. These powerful trading tools if used correctly can make us a fortune while others are losing their shirts.

Currently I am in cash and have taken a couple scalp short trades taking advantage of the market falling on Tuesday and again today. These trades only last about 10 minutes but generate some fast profits. You can see the short I did yesterday which explains what I saw and when I put on the trade: http://www.futurestradingsignals.com/trading-education/es-mini-scalp-trade-video/

On another note, Tomorrow is Canada Day and I am Canadian so… I will be done around 10:30am ET once the jobs numbers come out and the market trades for an hour incase there is a nice short or long trade for some quick money – eh!

If you would like to get my trading alerts please check out my websites at www.TheGoldAndOilGuy.com or www.FuturesTradingSignals.com

Chris Vermeulen
It was a non stop sell off last week in equities as the SP500 sold down 4 days straight with a small move up on Friday. While investors were cashing out of stocks, we saw that money move into the big shiny yellow safe haven – Gold.

I have put together a short video showing you how I see the market and what I think is likely to happen this week for gold, stocks and financials. But here are my Cole’s Notes version incase you cannot view the video.

Gold:
– Long term trend is up and I am currently long gold but feel a sharp correction could happen any day.
– Price/Volume action on gold is bearish short term
– We took some money off the table on Friday into the strength
– I am protecting my long position using a stop around the $1240 area
– I still like gold and hope it rallies, but if it turns around I will be in cash until the correction is over.

SP500:
– SP500 is currently oversold after its 4 day sell off
– This index is trading deep into a support level
– Financial sector and GS (Goldman Sachs) tend to lead the market and they performed well on Friday.
– I feel the SP500 index is due for a solid 2-3% bounce and possibly a 4-6% rally

Watch My Video For More Detailed Analysis and Price Levels

Can see the video above? click here – http://www.thegoldandoilguy.com/sunday-june-27th-gold-spx-video/

If you would like to get my detailed trading analysis and trading signals please visit my website: www.TheGoldAndOilGuy.com

Chris Vermeulen
Sunday June 20, 2010
Over the years we have seen the stock market make some pretty exciting moves for share holders. This year alone there have been some interesting events unfold causing wild market swings which most of us did not think could happen. Things like countries going bankrupt and the May flash crash. Also the BP Oil well leak which looks as though its about to kill not only businesses around the world but a large population of animals and fish which our planet will never be able to get back… It’s been a crazy year!

It sure would be nice if the financial situations between all he countries could be resolved, and if we could have some proper regulations on banks and the financial system to minimize fraud and manipulation. From the looks of everything we have a few years still before things get sorted out, fixed and some what stabilized.

Below are some charts showing where the Dow, Gold and Oil are currently trading and my thoughts on them.

DIA – Dow Jones Industrial Average ETF – Daily Chart

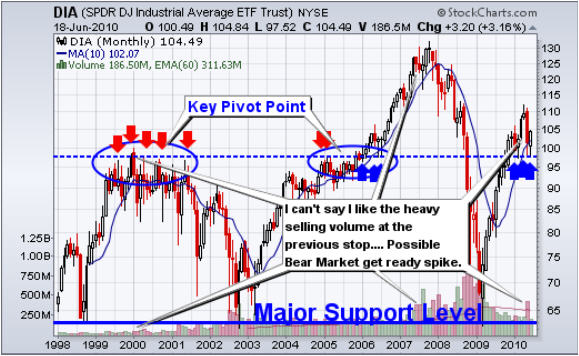
The past 12 years we have seen the DJIA go through some large bull and bear markets providing those with trading experience to generate large profits in both the bull and bear markets.

Recently we have seen the DJIA pullback and test the key pivot point and has started to bounce. Although this price action is positive I have my doubts about another bull market rally because of how the chart looks. I focus most of my analysis on chart patterns, volume and market internals. These allow me to monitor the overall heath of the market on a daily, week and monthly basis. Using these techniques I am able to pull money from the market consistently.

This year we saw some extremely heavy selling in May which could have been strong enough to shift the trend from an up trend to a down trend. I call these large volume candles Get Ready Spikes. If they are green then we are looking for higher prices but when they are red it means distribution is starting and lower prices could start to form in the coming months.

The DIA chart below looks to be forming a very large head and shoulders pattern which is currently trading near the top of the right shoulder. This pattern is very bearish and points to much lower prices in the next couple years if the major support level (neckline) is broken.

GLD – Gold Exchange Traded Fund – Daily Chart

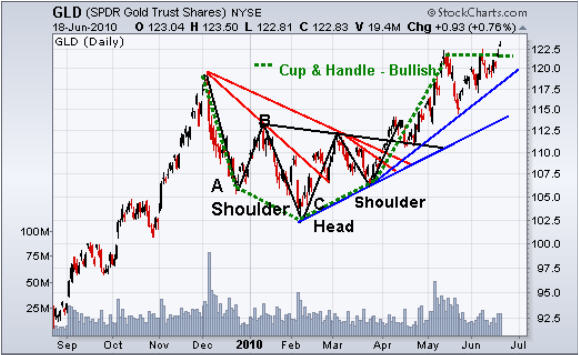
The chart of gold shows the same cup and handle pattern which I have been talking about for a while now. Last week the price of gold made a new high breaking out of this pattern. We could see the price of gold start to work its way up to the $1400-1500 level over the next 3-6 months which calculates to $140-150 on the GLD etf.

USO – Crude Oil Fund – Daily Chart

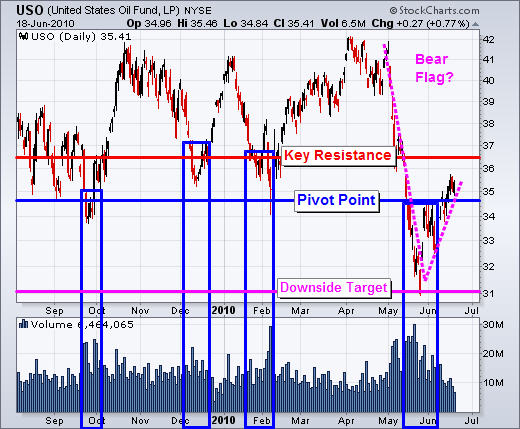
USO oil fund has been trend down for a couple months and recently put in a nice bounce from the May low. I feel as though oil is forming a bear flag and could head lower in the coming weeks. Until it breaks the key resistance level traders must be cautious if they have any long trades right now.

Weekend Dow, Gold and Oil Trading Conclusion:

In short, I’m bullish on stocks for the short term and think we could retest the April high in the next month or two. But after that the market could roll over and from there we could see much lower prices. Or we could see the indexes breakout and start another leg higher… During volatile times like we are in now… we must trade with caution until the overall health of the market clearly indicates the direction of stocks. Until then focusing on low risk setups and taking profits quickly is the safest trading strategy.

Gold looks to be setup for a strong move higher. I am hoping for another dip to shake out some investors before it continues its march upwards. Oil on the other hand is trading near a key resistance level. Only time will tell if it can break through and start a rally. If not then we will see the market struggle.

If you would like to receive my ETF Trading Signals take a look at my website: www.TheGoldAndOilGuy.com

Chris Vermeulen