Wednesday May 26th
It’s been an exciting week for traders as volatility levels are through the roof and the broad market is moving up and down like a yoyo. You cannot take your eyes off the screen if you have a large amount of money invested as you can quickly find yourself with a large profit or loss in the matter of minutes….

Although we have seen stocks jump around the past few days precious metals have held strong with very little volatility. This is because of the economic fears looming for the US and other countries of possible financial collapse. This fear is helping to boost gold and silver prices because they are seen as the safe haven. Also we are seeing money move in the US dollar because the country is still seen as a leader in many ways helping to boost the US dollar.

Below are a couple charts on Gold and Silver ETF’s showing the end of last years rally and the correction in prices which are now looking to setting up for another leg higher.

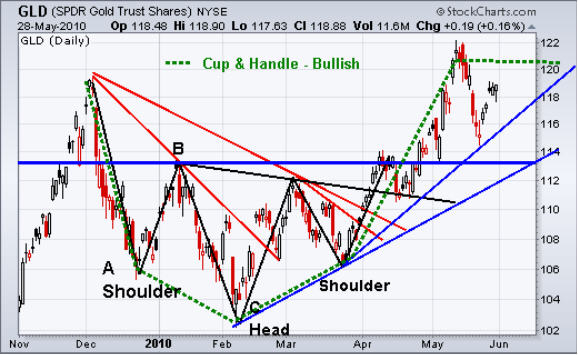
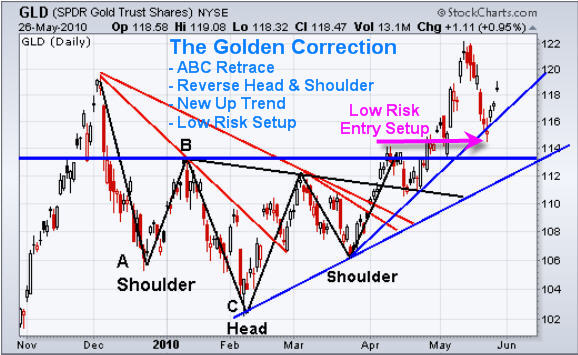
GLD – Gold ETF Trading Vehicle – Daily Chart

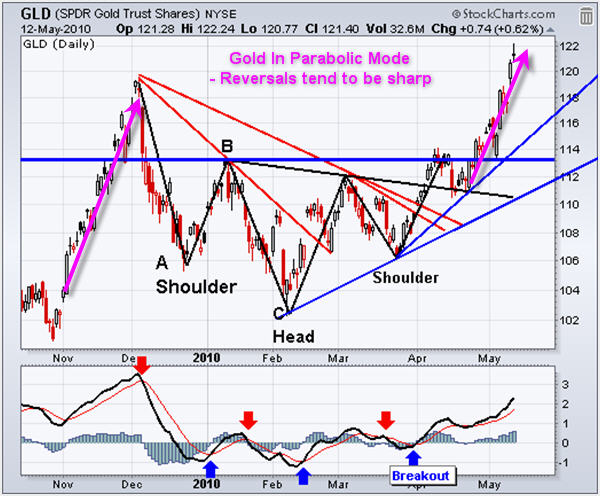
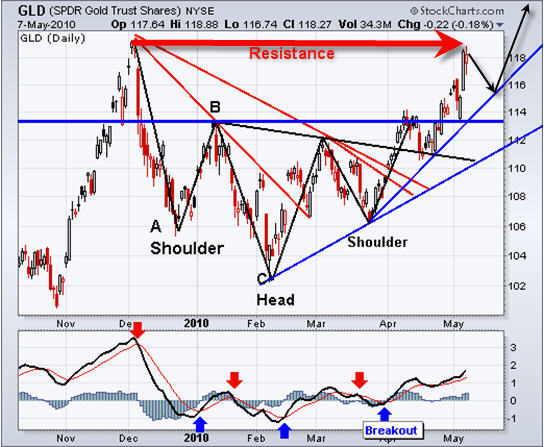
I called this chart “The Golden Correction” because it literally is. We saw prices rally late in 2009 finishing off with a parabolic spike which we know is not sustainable and almost always results in a VERY sharp drop. This correction unfolded as planned with an ABC retrace which shakes out weak positions. We then we saw a reverse head & shoulders pattern form which again also shakes out weak positions. Once the neckline was broken from the reverse H & S the new up trend was started providing a couple trading opportunities for us along the way. The most recent low risk entry point can be seen on the chart as gold prices dropped back to a key support level.

ETF Trading Newsletter

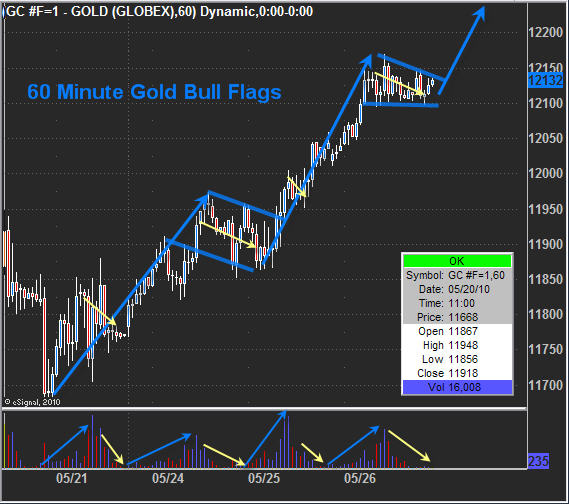
Gold Futures Price – 60 Minute Day Trading Chart

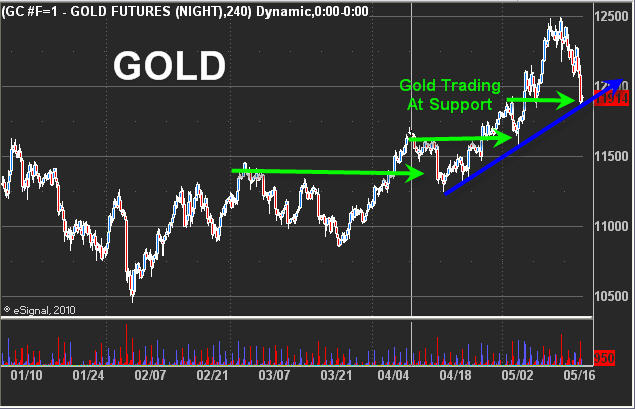
Gold has been showing some very bullish price action the past week forming several mini bull flags with confirming volume levels. I think we should see gold pop another $5-10 bucks in the very near future if not continue higher for several days.

Index ETF Trading Newsletter

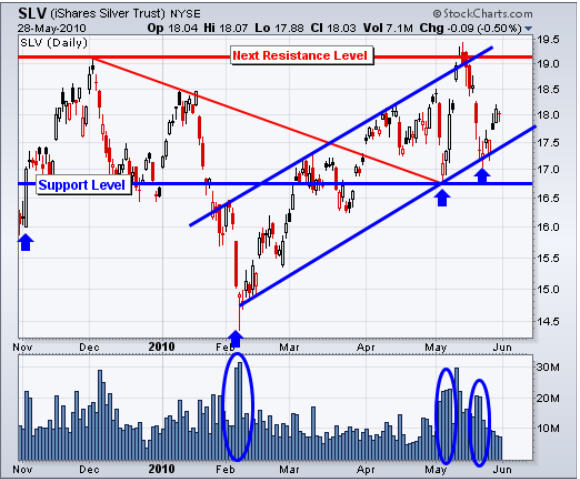
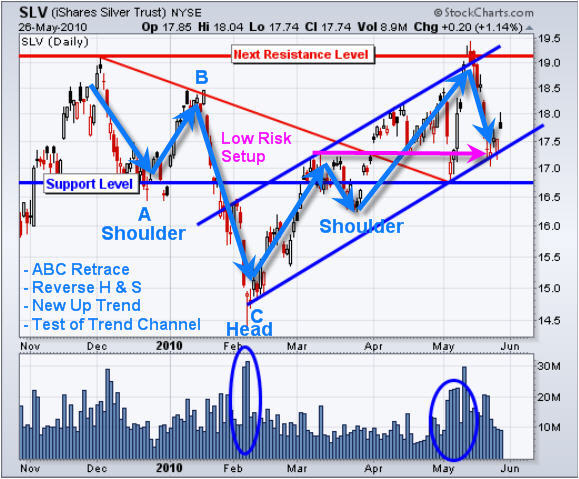
SLV – Silver ETF Trading Vehicle – Daily Chart

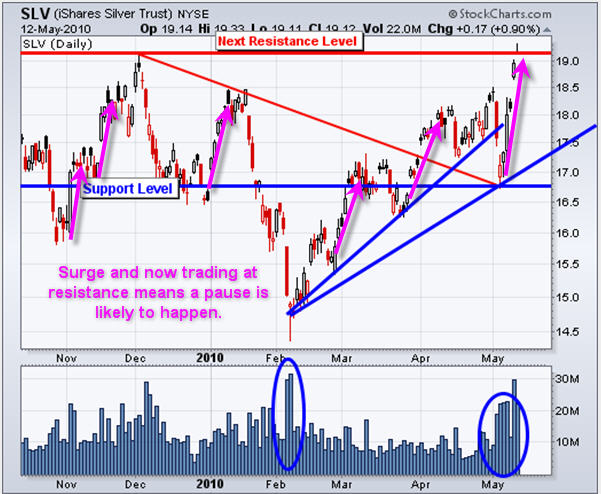
Silver formed much of the same patterns as gold but with much more volatility. Also silver has yet to break the 2009 high which is surprising but with a large part of silver being use for industrial purposes it does make sense as the economy is not as strong as it was thought to be in 2009. Silver carries much more risk when trading because it has more random moves and increased volatility.

ETF Trading Strategy

Mid-Week Precious Metals Trading Conclusion:

In short, gold and silver are in an uptrend and looking strong. Both are currently trading at short term resistance levels on the daily chart which has caused them to stop moving up today (Wednesday May 26th) but on an intraday basis they look solid and could break though these resistance levels.

That being said buying way up here adds a lot more risk because a good chunk of the move has already been made and if prices do roll over and start heading back down the next support level is several percentage points away for placing a protective stop with the proper amount of wiggle room.

If Trading Gold, Silver and Index Futures and ETFs interested you check out my trading services at www.TheGoldAndOilGuy.com

Chris Vermeulen

Get My Free Weekly Stock Market Trading Analysis Sent To Your Inbox:

May 23 2010
The stock market topped in April which was expected from analyzing stocks and the indexes. Back in April I posted a few reports explaining how to read the charts to spot market tops. Today’s report is about identifying market bottoms. Market Top Report: Click Here

It does not get much more exciting than what we have seen in the past 2 months with the market topping in April and the May 6th mini market crash. This Thursday we saw panic selling which pushed the market below the May 6th low washing the market of weak positions.

For those of you who have been following me closely this year I am sure you have noticed trading has been a little slower than normal. This is due to the fact that the market corrected at the beginning of the year and we went long Feb 5th and again on Feb 25th. Since then the market rallied for 2 months and never provided another low risk entry point. In April the market became choppy and toppy and we eventually took a short position to ride the market down. Now were we are looking at another possible reversal to the upside.

Only a few trades this year which I know frustrates some individuals but if you step back and look at my trading strategy you will learn that we only need to trade a few trades a year to make some solid returns. I don’t know about you but I would rather trade a few times a month and live life between trades… not trade all day every day getting bug eyed in front of the computer.

Ok enough of the boring stuff let’s get into the charts…

SP500 – Stock Market Index Trading ETFs & Futures

The pullback in the broad market was expected but the mini crash on May 6th really through a wrench into things for us technical analysts. We don’t really know the truth about what happened that day… was it just a simple error or was it a planned error for the US government to take a massive short position to move something in their favor quickly to generate MASSIVE gains? It leaves us technicians hanging wondering if that was a shift in trend from up (accumulation) to down (distribution)?

My thoughts are if the crash was truly an error then we will see months if not another year of higher prices… But if it was a planned sell off with banks moving to the sidelines then we are most likely headed into another bear market. Personally it does not matter what happens as big money will be made in either direction. Problem is if we do go into another bear market then the majority of individuals will lose capital as investor’s portfolios get smaller and smaller. That will lead to a lot of depressed people…

In short, I am neutral on the stock market for the intermediate and long term. Once we have a few more months of price action only then will I have a plan for longer term investments. But on the short term time frame the market is screaming at me with extreme sentiment levels lining up on the stock market and gold.

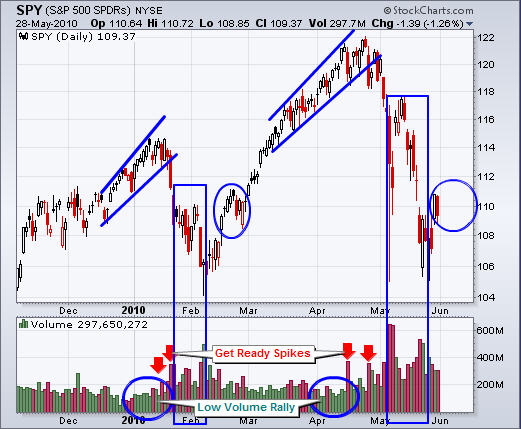
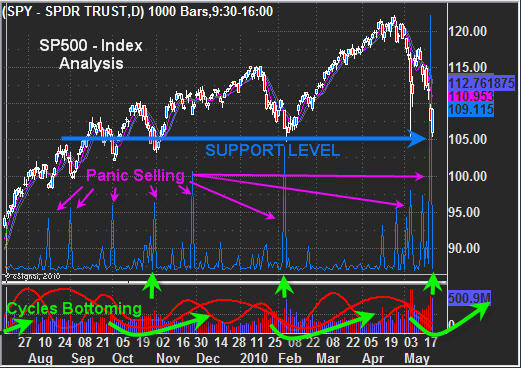
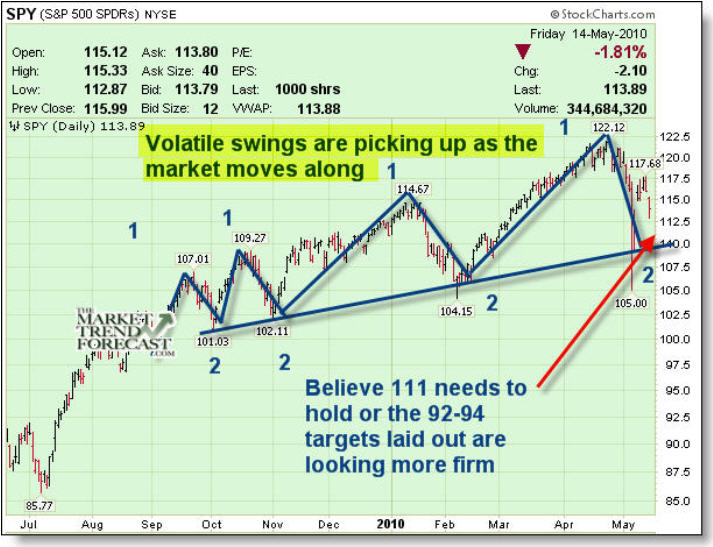
The daily chart of the SPY – SP500 Index shows several important points which help me time market bottoms. We have prices trading at a support zone. Buyers step back into the game here and should provide a decent bounce which started Friday Morning.

Next we have the panic selling spikes from an indicator I created. Generally the day after we see panic in the market like we did on Thursday we will see a big bounce and many times a large rally.

Down at the bottom you can see my custom market cycles which are both starting to bottom. During times like this the market has a natural tendency to move higher.

v


VIX – Market Volatility Daily Chart

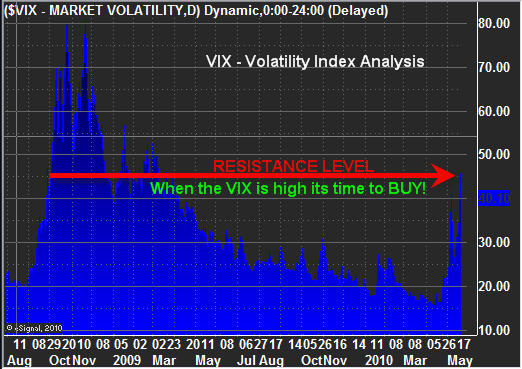
The VIX has an old saying “When the VIX is high its time to buy, When the VIX is low, its time to go”. Simple analysis clearly shows the VIX trading high and at a resistance zone.

VIX - Volatility Index Trading

Put/Call Ratio – Daily Trading Chart
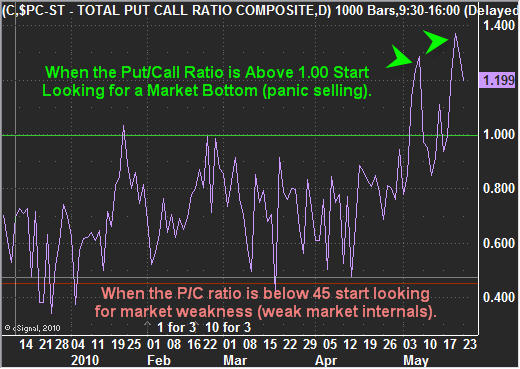
This chart measures the amount of put and call options traded each day. When it is trading over 1.00 then we know for every 1 call option traded (wanting the market to go up) there is 1 put option traded (wanting the market to go down). Over 1.00 is extreme and when that many people are bearish and using leverage to profit from a drop in price then in my opinion it means everyone has already sold and the selling pressure is about to end.

Actually if you go back in time and review SP500 and this ratio you will notice 2-3 days after this ratio reaches 1.00 or higher the market bounces/bottoms.

Put Call Ratio Trading Strategy

NYSE Advance/Decline Line for Equities – Daily Chart
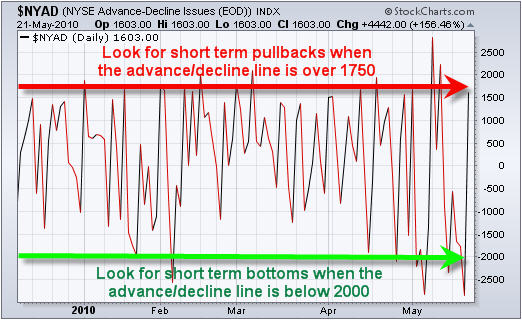
This chart shows us how many stocks are advancing or declining on any given day. When extremes are reached look for a short term bounce or bottom 1-3 days following.

NYSE Advance Decline Line Trading

How to Identify Stock Market Bottoms with Simple Analysis:
In short, I feel the market is forming a bottom here. How big of a rally will we get? I don’t know because of the mixed signals from the May 6th EXTREME heavy volume selling session. As usual I focus on trading with the trend, trading the low risk setups and I manage my money/positions scaling in and out of those positions as I see fit.

If you would like to receive my Real-Time Trading Signals & Trading Education check out my website at www.FuturesTradingSignals.com

Chris Vermeulen

8:41am ET, May 21, 2010

Yesterday we started to see extreme panic selling in the broad market. This can be seen by looking at the up/down volume, advance/decline line for stocks and the speed at which the market was dropping. Only a few times a year do we get extreme levels like this and they tend to lead to sizable gains if traded correctly.

A lot has changed with my overall market outlook in the past month. At first I thought the intraday market crash was a human error and should be somewhat ignored but with the level of selling we are seeing now I am starting to think we have formed a market top in April. Don’t get me wrong, I do not have a bias as to which way I want the market to go. It does not really matter as I simply follow the trend and trade the setups.

Here are my charts and thoughts of what is happening in the market:

Broad Market – Indexes and Stocks

As you can see from the chart below the red broadening pattern is starting to concern me. During a bull market like we are in now, a broadening pattern is seen as neutral or bearish price action. This type of pattern has be on edge because in the past patterns like this have been the top. But I think we should see a bounce up to retrace half of the sell off from the April top. Then we will evaluate the situation from there.

Blue Support Levels currently the market is trading around a support level which tends to force the price to change direction. We have yet to break the May low and that could be broken today depending on the follow though from yesterdays panic selling. We could see the low get penetrated briefly then reverse back up sharply. This quick break of the early May low will shake out the final group of traders/investors before the market bottoms.

Green Panic Selling has helped to point out market lows for all of 2009 and 2010. Yesterday we had new high showing us that there were 37 sell orders for ever 1 buy order on the NYSE. I was getting a lot of emails yesterday from traders in panic wondering what to do. These emails are also an indicator that the market is bottoming…

SP500 - SPY - ES Mini Trading Newlsetter

US Dollar Index

The US Dollar chart below looks as though it has topped on the 4 hour chart. We could see the dollar drop for 1-3 weeks which in turn will help boost stocks and gold s they both seem to be bottoming.
US Dollar Index Trading Newsletter

Trading Conclusion:

In short, the market is trying to bottom as I mentioned in the Wednesday report. Volatility has spiked, stocks and commodities are jumping around shaking out stops and investors are in a panic selling what they own and getting back into cash…

It’s Friday and when a big move happens on Friday we have to expect some follow through on Monday as all the weekly chart traders and people not watching the market last week will see the sell off and exit their positions on Monday adding more pressure on the market.

With all the recent selling I feel most of the risk has been taken out of the market already but we must remain cautious still. I am looking to buy (scale in over a couple days) the SP500 and Gold using the Best Trading vehicles which members have access to along detailed trading information like entry, price targets, protective stops money management and trading education.

If this is of interest to you be sure to checkout my Stock, ETF and Futures Trading Services www.TheTechnicalTraders.com

If you want to receive my free weekly technical reports be sure to opt-in to this Free Trading Newsletter:

Chris Vermeulen

May 19th 2010
It has been an interesting week in the market as stocks and commodities push to extreme support levels. Below I have posted some charts showing where the market is currently trading at and what I think is likely to unfold.

Gold Futures – 4 Hour Candle Stick Chart
The price of Gold is testing a key support level. I figure we will see gold try to stabilize over the next week or so as it digests the recent drop in value then start to head back up.

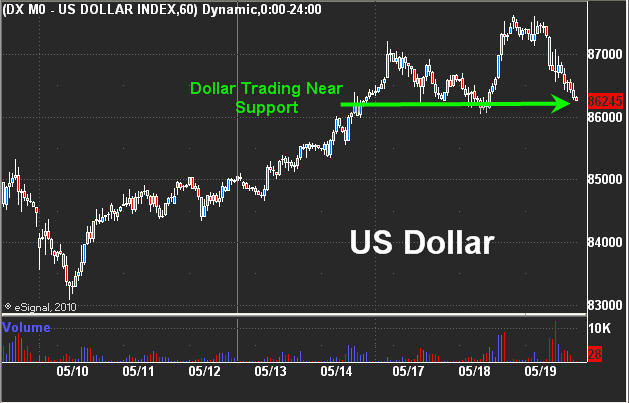
US Dollar Index – 60 Minute Candle Stick Chart
The US Dollar and gold have been moving together the past few weeks as more countries pop up on the radar for serious financial issues. This is helping to boost both the US Dollar and gold as investors around the world starting buying what seems to be safety. The dollar has had a sizable pullback and is now testing a key support level.

This could be the start of a possible Head & Shoulders pattern forming which means the dollar rally could be nearing maturity in the next couple weeks.

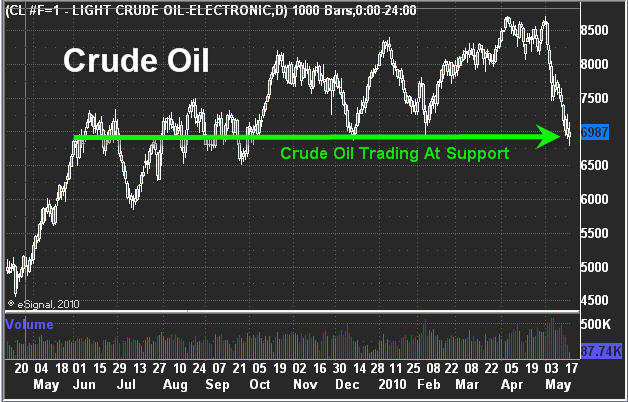
Crude Oil Futures – Daily Trading Chart
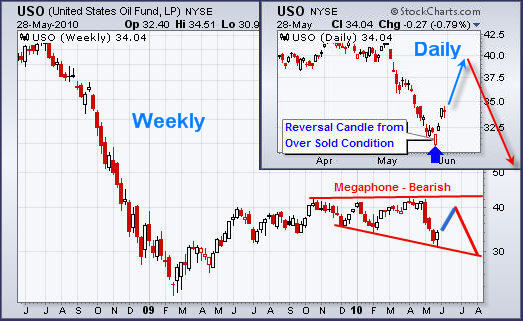
Oil has been under serious selling pressure because of the rising USD. It has now dropped to a key support level and is starting to look very interesting. If the US Dollar bounces in the next week or two it will keep downward pressure on oil. I think this bottom is going to be a process not a one day event.

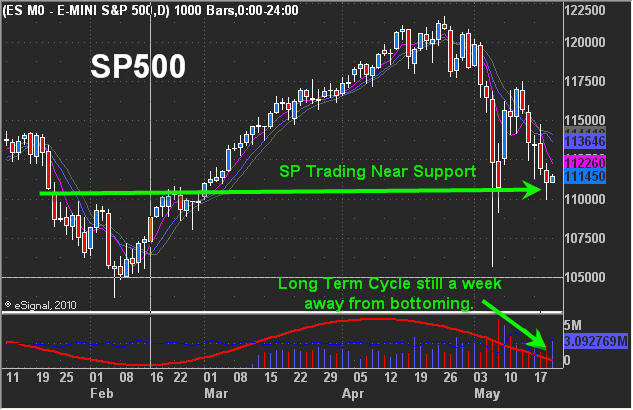
SP500 – Daily Trading Chart
Stocks have been under dropping like flies the past few weeks and shorting the SP500 last week at 1170 has played out very nicely for members. The broad market is giving me mixed signals and when I am unsure of a trade I stand on the sidelines. It’s always better to sit in cash and watch things stabilize than it is to watch your hard earned money evaporate. We could see a wave of panic selling in the stock indexes testing the previous lows so be cautious.

Mid-Week Stock & Commodity Trading Report Conclusion:
In short, I feel gold and the dollar will bounce in the coming days from their support levels. This will keep pressure on oil & the SP500 holding them down near support. Once the US Dollar forms a possible right shoulder we will most likely see them pop and rally.

We are still 7 trading days away from a cycle low on the broad market making this scenario very likely to play out. At the moment I am getting a lot of mixed signals and during times like this I prefer to stay in cash because volatility will rise and it is easy to get shaken out of trades.

If you would like to get my Real-Time Trading Signals & Setups checkout my services at www.TheTechnicalTraders.com

Chris Vermeulen

Trading Basics – A Must Read For ALL TRADERS
In order to keep trading as simple and profitable as possible, you must have the proper trading tools in place and understand how to use everything before you actually start trading with real money. There are numerous brokers and trading platforms available and I am only mentioning the ones I like and use myself as they work extremely well for me.

Not every broker will have what you are looking for so follow my guidelines below. Also, not every trading platform will do what you need. So again, read through this info even if you believe you are already setup properly.

What I Trade – Investment Vehicles
While there are thousands of different investment vehicles using ETF’s, stocks, options, and futures contracts, I focus on a small selection which consistently generate high probability trades with exceptional risk/reward levels.

I focus primarily on Gold and the SP500 using their related investment vehicles (ETF’s, Futures contracts and CFD’s). My trading strategy works well with all of these vehicles allowing you to trade the vehicle you are most comfortable with. As you gain experience, though, you also have the flexibility of experimenting with the more aggressive vehicles such as futures and CFDs. For instance, if you are an ETF trader then you simply use my buy and sell signals with the ETFs I follow. If you are currently a futures or CFD trader, or want to begin trading these vehicles, then you simply use the trading information for those buy and sell signals. I have created this service to allow the majority of traders to benefit without sacrificing profits or risk.

If you have a job which requires your time during normal trading hours, futures and CFD’s will allow you to get involved with trades outside of regular trading hours. For instance, if there was a buy signal during the day and you missed it, later on that day or during the night the price could move back into a our trading price range. At that point, you could enter the trade if you were using Futures or CFDs. This second opportunity happens more often than not.

In addition to gold and the SP500, I sometimes cover silver, oil and other commodities and indexes when a low risk setup presents itself. I will also cover some sector ETFs when something looks to be setting up for a sizeable move. Trading different sectors allows us to play off the sector rotation as institutions move money from one group of stocks to another with the changing economy.

Hot commodities and sectors can be identified simply by scanning through the charts during market weakness. I look for sectors which have been basing (consolidating/moving sideways) for several weeks and holding their value while the rest of the broad market is correcting or selling down. These sectors which hold up during market weakness often outperform the rest of the market once the broad market correction has finished.

Stocks in hot sectors can definitely provide some explosive returns which is what we can do also. I like the ETFs because they carry a basket of stocks, some good, some not so good, but overall you benefit from the strength or weakness of that sector. With ETFs, it is possible to take increased position sizes without unduly increasing your risk levels. This allows us to optimize our risk / reward levels without subjecting our capital to the larger price swings that are possible with individual stocks.

How To Use My Trading Signals:
Trading is easy as I provide entry, protective stop, profit targets and exit prices for the ETF’s and futures investment vehicles.

ETF traders do have some restriction regarding when they can buy and sell. Depending on the type of broker you use, ETFs are tradable between 8am – 7pm ET. In order trade the extended hours of 8am – 7pm, a direct access broker is required. If you are not sure why type of broker you have, give them a call and see if you can trade pre/post market hours with ETFs. If you would like more info please read the section on Choosing a Broker.

Time Required to Successfully Trade with this Service
Trading can be a very time consuming job but it does not have to be. I have created a trading strategy and designed this service so that it saves you hours of daily research. Important key market information is condensed into a short daily video and intraday updates keep you in the loop with changing market prices and markets dynamics.

While you can spend the entire day in the chat room, it is not required by any means. All alerts, videos and updates are posted in the member’s area and sent to you via email to ensure you don’t miss any thing. Each week you will also get a chat room wrap-up. This is a PDF file where I take all the important chat room questions and answers and put them in one file. So, you get a concise summary of the best info delivered directly to you – ensuring you never miss key trading tips and education discussed in the chat room.

This service provides 4-10 trades per month. Most of the time I can see a possible trade setup hours and some times a couple days in advance. Therefore, you will know when to be looking for an alert from the service. As long as you have access to your emails through a computer or smart phone you can trade all the signals. Just place your order online or call your broker. You can take advantage of all the trades from just the information in the emails. But if you want to learn a lot about trading, you should view the morning videos and join me in the chat room each day between 9-11am ET.

Is Trading Experience Required?
No trading experience is required to use this service. If you are completely new, then you will have a very steep learning curve and will need to do some research on-line in order to get caught up with basic trading terminology and to learn how to place orders with your broker.

The good news about not knowing much about trading is that you will not have any bad habits. So learning how to trade properly right from the get go will save you years of frustration and lost money. Educational videos will be provided on how to read charts, find trading signals, how to manage the trade and your money etc…. these videos will teach you everything you need to know. Then you just need to gain some experience trading and that’s what this service does for you. It provides the experience, trades and education all wrapped into one.

Choosing the Right Broker:
Selecting the right broker may seem like a difficult task but if you know what you are looking for, you can easily cut through the clutter of mini franchise brokers lacking quick customer service and poor execution prices. You will also be able to avoid brokers who will not allow you to grow as a trader as you move from ETF’s  Stocks  Options  Futures.

You must be sure the broker you select is a Direct Access Broker. Direct access means you can place your order on ECN’s (Electronic Communication Networks) and you will actually see your order live on the level 2 screen just like a market maker. In short, it makes you a market maker meaning you have full control of your trading and are competing head to head with the market, no middleman, no delayed orders and order execution at the best possible price. This also allows you to trade outside of regular market hours so you can take advantage of pre-market and after hours trading with eligible stocks, ETF’s and futures.

As a trader you will evolve over time so it is very important to keep your doors open for trading other investment instruments. If you are currently trading just stocks or ETF’s, in a few months or years you may want to start trading options, futures or currencies. So select a broker which has these available to ensure capability for your future growth. No one likes to change brokers as it’s a major pain in the butt and time consuming.

I have traded with several brokers in the past and found one broker that truly is great. I use www.InteractiveBrokers.com which not only has excellent customer service (which is a MUST for trading) but they are also a Direct Access Broker, have lighting fast executions, low trading commissions, and allow you to trade EVERYTHING from one account (stocks, ETF’s, options, futures, currencies and warrants). And to make things better, almost every trading platform can integrate Interactive Brokers into their system. This integration enables trading directly through a higher end trading platform like www.eSignal.com.

Interactive Brokers is available in many countries so virtually everyone can use them. There are some exceptions as I don’t think people in Spain can use them but all you have to do is give them a call to find out.

Also, I am an introducing broker for InteractiveBrokers as I help them get new clients. If you open an account with them you can enter my Referral Code: 57135 when signing up with them if you like and it would be greatly appreciated.

CFD Trading
For those of you who are not a US resident, you should be able to trade CFD’s (Contract Of Difference). This is like trading futures so you will be able to trade currencies, commodities, and major stock indexes 24/7. You can now trade some individual stocks with CFD’s using 50x leverage which is exciting. The nice thing with CFD’s is that you can trade 24/7 and you get 50 – 200 times leverage making a $500 – $2500 account VERY POWERFULL. I use http://www.avafx.com/lp/?tag=GoldNOil_En_lp as my CFD broker and they have been made me some great money trading with their platform and I haven’t had any issues getting paid out. I am also an Introducing Broker for them helping to get them clients as well. The link above is my Referral tracking link. Learn about CFD’s on their website.

Choosing a Trading Platform:
I have evaluated several trading platforms over the years as there are lots of great ones out there. There is one trading platform which I really like and believe you should use also. The eSignal platform can do everything and more when it comes to charting, trading, creating and implementing automated trading strategies, and back testing.

I subscribe to the data feeds for quotes and charting on eSignal so I can trade US & Canadian Stocks/ETFs, also the feeds for trading the ES mini (SP500 Futures Contract), GC (100oz Gold), YG (33.3oz Gold) and YI (1000oz Silver).

Myself, I use eSignal and I love it. Its simple to use, looks awesome, allows me to trade directly from the charts as it communicates with my Interactive Brokers trading account and provides all the other capabilities I need and then some.

One of the nice things about using eSignal is that if you choose to use them, I can send you my eSignal Page File so your platform will automatically setup with all the charts and settings I use. This is a great bonus because then we are trading and seeing things on the same page (pardon the pun).

If eSignal is of interest to you just give Jeff Werthman a call as he can help you choose the proper software setup, data fees and also give you the Second Month of eSignal FREE if you tell them I (Chris Vermeulen from TheGoldAndOilGuy.com) referred you.

eSignal Contact for Free Month & Setup
Jeff Werthman
jwerthman@mail.esignal.com
1-800-322-9170

Your Trading Computer and Internet Setup
Computers are very affordable today and seem to come with all the bells and whistles. But you must be careful what you buy. I highly recommend getting a top of the line computer.

The benefits of getting a powerful high end computer is that you can run multiple programs without worrying about your charts lagging or computer freezing. Also your computer will last several years before you need to sell it and get a new one to keep up with newer more powerful programs.

If you are in the market for a new desktop or laptop here are a few things it must have and be able to do.
1. It should have a quad-core processor as eSignal and other trading programs run much smoother with this.
2. You should have 4mb of ram minimum
3. Be sure your tower has a dual video display output or more.
4. Your laptop should have two video outputs for you to run two monitors if you travel.
5. Be sure to run Windows XP or Windows 7 because they are the most stable operating system and all trading platforms work properly on them.
6. I recommend LCD flat screen monitors as they require low energy, are easy on the eyes and you can take them with you to use with your laptop if you have a second home or want to trade while traveling.
7. Battery backup and surge protector – get a large one which can handle your computer, monitors, internet modem and wireless. You should have 10-30 minutes of battery backup time for when the power goes out so you can close out your trades and shut down your computer properly.
8. Internet connections, I use cable because it’s fast and when the power goes out cable internet still works. It’s amazing how my entire town can lose power yet I can continue trading or surfing the web because I am setup for power failures. They don’t happen often but a $150 battery back has paid for its self many times over… and who knows if the power surges would have fried my computers if I did not have the surge protectors….

If you are thinking of getting a new computer you should look at the ones provided at http://www.TradingComputers.com/. If you have seen any pictures of me on my websites then you have seen my computer setup with 6 monitors. My system was purchased from this company. I also have their high end laptop which is extremely powerful and can do everything my big tower computer can do. These computers are designed to trade and will blow the competition out of the water.

I have worked out a deal with them and if you mention my name (Chris Vermeulen) in the “special Instructions” area when ordering online or mention my name when placing an order over the phone they will give you Free Shipping so you will save $50-150.

By: Chris Vermeulen – www.FuturesTradingSinals.com

May 17th 2010
Back in the third week of April I predicted here on Kitco.com a topping in the broader market indices. The theory was the VIX levels were extremely and historically too low concomitant with extremely high historical readings in investor bullish sentiment gauges. After thirteen Fibonacci months of a bull cycle rally, it was likely an A B C correction to the downside would begin. In further follows ups on TheMarketTrendForecast.com service I run on April 20th, I again outlined concerns with falling volumes on small cap stocks and too many “stories” being run up too far ahead of the economics.

At this point in the Bull market, it is common to have the crowd of investors move from a bias towards viewing all news as positive, to a negative slant on all news. Nothing has changed dramatically on the problems the world had before with Debt and currencies, but the reaction to those events turns negative. This works off the overly optimistic Elliott Wave patterns of the crowd, turning into a typical Zig Zag correction that lasts several months. There will be trading opportunities between that Mid-April topping forecast and my forecast for a bottom around mid-September. However, as recommended in April, Index investors and mutual fund investors should have been moving to the sidelines. I am looking for the SP 500 Index to drop to the 920-970 areas by mid-September before the next leg of the Bull market takes off. Now, the one caveat to that forecast is actually a lot more bullish. If the SP 500 can hold the 1100-1110 areas and pivot up strongly, we could move on to new highs. I put the likelihood of that around 20%, so be on guard. A counter-trend rally up in the next few weeks is highly probable, but the evidence continues to suggest working our way down into the 900’s in the SP 500 before the Bull resumes in earnest. We are selectively buying Gold and Biotech stocks in the Active Trading Partners service as well.

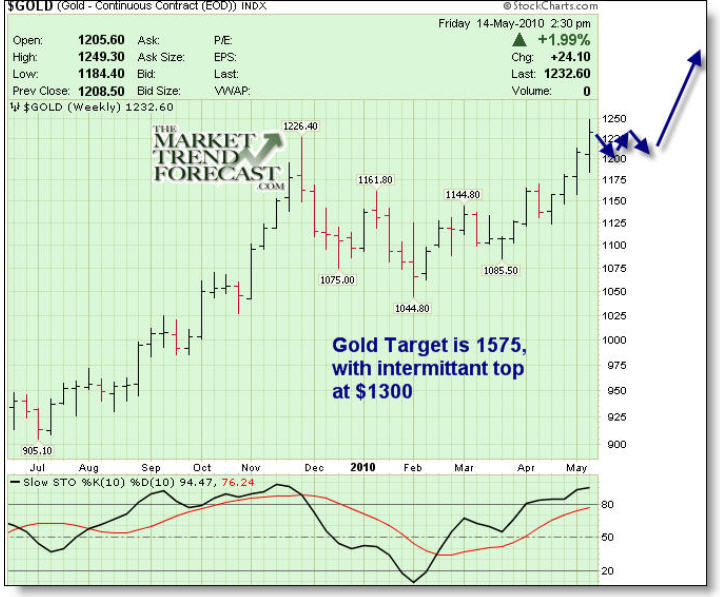
Gold has continued higher confirming my April 20th forecast on The Market Trend Forecast of a move from 1125 to 1235 in Gold. The Elliott Wave patterns remain extremely bullish for Gold to continue a 13 Fibonacci year cycle up into 2014. Gold has formed a very bullish pattern intermediately for a move to $1470-$1550 at the next major pivot top. In the interim, I expect continued consolidation in and around my $1,235 US levels before the next pivot high at $1300-$1,325 US. Fiat currencies are burning matches as foreign governments and other entities continue to attempt to put out a fire by printing more paper and covering the same fire with it. Until the analysts on CNBC stop questioning the validity of Gold and start questioning the validity of Fiat Paper, the bull will rage onwards with most of the pundits watching the caboose from the back of the tracks.

SP 500 Forecast from the Mid-May TMTF forecast service updates:
TheMarketTrendForecast

Gold Forecast is for $1570 over 6-9 months with pivot at $1300:

Stock Market Forecasting

Be sure to checkout my market forecating service at www.TheMarketTrendForecast.com

David Banister

May 16, 2010
Last week was amazing for both gold and index traders as gold surged higher and the SP500 tested a key resistance then fell 4% in our favor. The past couple weeks with the mini market crash and Euro issues making the market extra volatile both gold and the broad market (SP500) index has been wild.

The added volatility makes trading more difficult because price patterns become less predictable and price movements are much larger increasing risk for traders.

Below are the charts & videos of what to look for in the coming days…

GLD – Gold ETF Trading
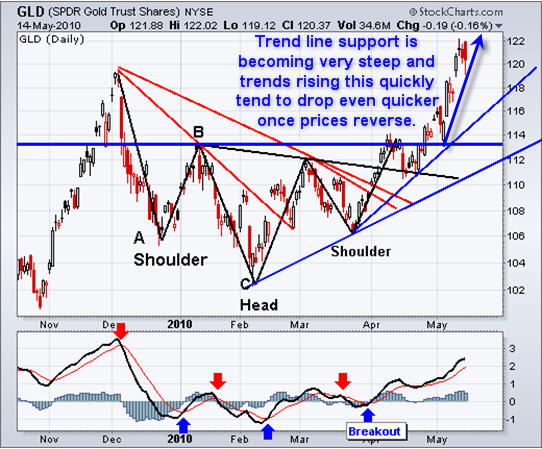
Gold continues to trend higher at an accelerated rate. Friday we saw gold pullback and test a key support level then bounced to close in the middle of the days trading range. As you can see the trend line support has become very steep and once the trend line support is broken I figure there will be a sharp drop to digest the recent rally.

Gold Trading Newsletter

SLV – Silver ETF Trading
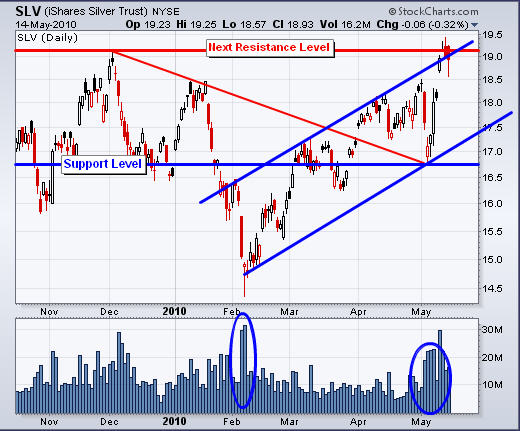
Silver popped and tested a key resistance level from a previous high as expected. It also tested the top of its trend channel providing even more resistance. This week will be interesting as we wait to see if precious metals have a small pullback or continue to rally.

Silver ETF Trading Newsletter

SPY – SP500 Index ETF Trading Chart
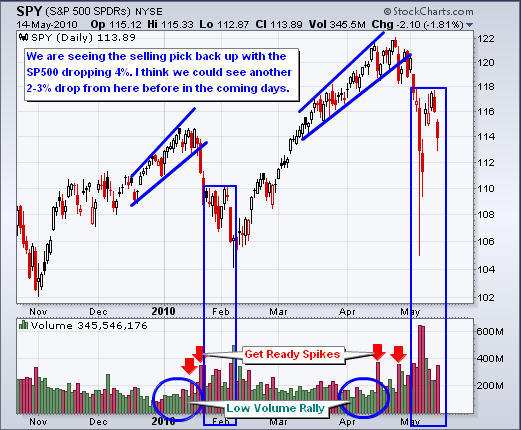
This chart clearly shows what I think is about to unfold by looking at the past market drop. Because of the mini market crash triggering everyone’s stops already I figure we have made the low and the dip we are seeing now will drift down a few more percentage points then bottom out.

SPY ETF Trading Newsletter

ES M0 – SP500 Mini Futures Trading Setup – Pre-Drop
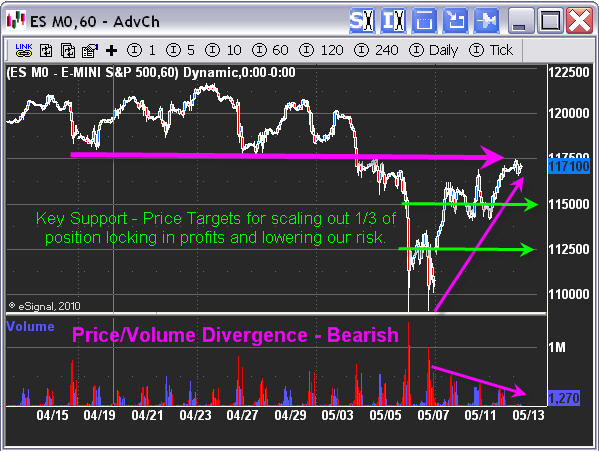
Below is a chart of the SP500 which we shorted or bought the SDS bear etf trading fund last week looking to profit from a falling stock market. As you can see from the chart we saw the es mini contract drift into a key pivot point on light volume. What this means is that a large group of sellers will be waiting at that price, and because volume is light we know there are not many buyers at this price level. Simple supply/demand comes into play with more sellers causing the price to stop rising and eventually force the price lower which is what we were anticipating.

The green arrows show key support levels on the 60 minute chart where 1/3 of a position should be taken of the table to lock in gains which also reduces overall risk on the trade. Once we cash in the first 1/3 of the position we move our protective stop the breakeven which is the entry point for the remaining portion of our position. This turns the trading into a winner no matter what happens allowing us to enjoy the ride…

ES Mini Trading Service

ES M0 – SP500 Mini Futures Trading Setup – Current Price
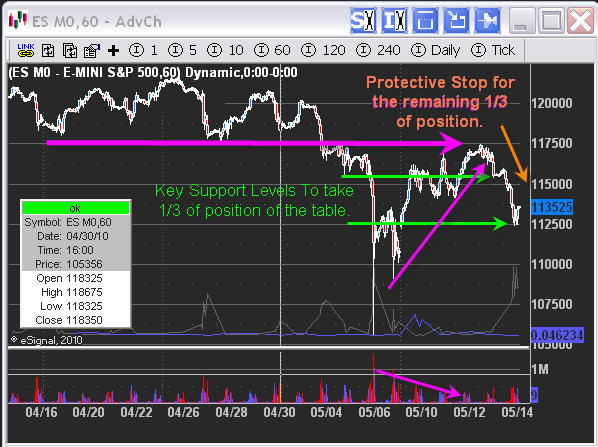
Here is the same chart 24 hours later showing both of our profit targets triggered pocketing 2/3rds of our position for a very nice gain. Depending on the type of trading vehicle you traded there was potential to make up to 150% return in less than 24 hours.

We currently hold 1/3 of the position left with a loose stop allowing the trade to mature incase the down trend continues for several days or weeks. If not and the price rallies then our stop will get triggered for small profit on the balance of the position. Either way we win.

ES Mini Index Trading Service

Pre & Post Market Correction Video: http://www.thegoldandoilguy.com/sp500-market-correction-trading-videos/

Stock Market ETF and Futures Trading Conclusion:
In short, the market is trading on increased volatility making it difficult to find low risk setups. At the moment we are long gold and short the SP500 with both position deep in the money. All we can do now is manage our positions to make sure we maximize our profits.

If you would like to Get My Trading Signals be sure to check out my services at: www.TheTechnicalTraders.com

Chris Vermeulen

It’s been an exciting couple weeks in the market with gold now making new all time highs as money floods into this shiny safe haven. It has everyone all worked up wanting to take part or they are riding the rally up already. But the big question is when should some money be taken off the table to lock in gains and lower your overall risk during these crazy times?

Below are a few charts showing you how I see things at this time.

GLD – Gold Exchange Traded Fund
The price of GLD and gold appear to be going parabolic (straight up). The tough part about this type of price action is that large moves can happen in a very short period of time. But on the flip side, when the price reverses we tend to see prices fall just as fast if not faster. Trading this type of price action carries a very high level of risk. Those chasing it up buying at these overbought market conditions is a double edge knife.

ETF Trading Newsletter

SLV – Silver Exchange Traded Fund
Silver is trading similar to gold but the key difference here is that silver has not broken to a new high as of yet. The high was set in 2008 just over $20 per ounce. But from looking at the chart I think metals are ready for a breather.

Silver ETF Trading Newsletter

HUI Index – Gold Stocks
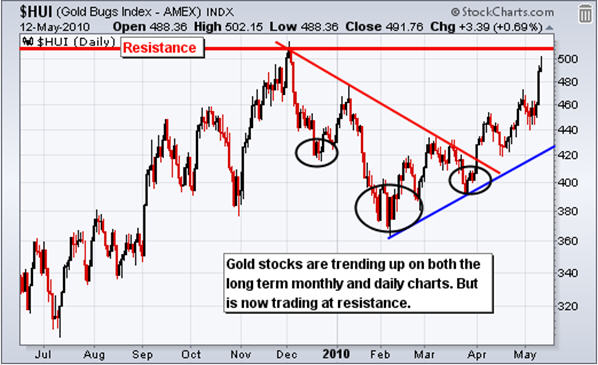
Gold stocks have yet to breakout along with silver as they both are nearing key resistance levels. With gold stocks and silver trading near resistance I figure we will see pause in the coming days as traders digest the recent strong moves up taking some money off the table incase prices get stuck under these resistance level.

Gold Stock Trading Newsletter

SPY – SP500 Broad Market Exchange Traded Fund
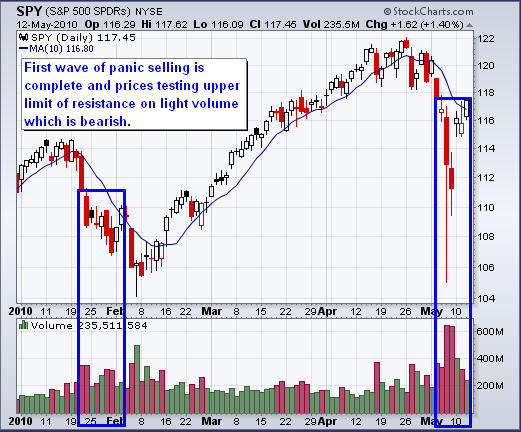
The broad market appears to be forming a possible short setup on the daily chart as the price continues to drift higher with declining volume. Also indexes are testing key resistance levels and the 10 period moving average. The next few days should be interesting…

SPY ETF Trading Newsletter

Mid-Week Precious Metals and Index Exchange Traded Fund Report:
In short, it looks like precious metals and the broad market could take a breather in the coming days. I’m not sure how large of a correction we will see but I do not think it will be all that big.

Gold and silver should have a quick dip with buyers stepping back in on weakness. The SP500/broad market is a little more tough to call as last weeks market crash messed things up washing out all the stops in one day instead of weeks… but we could easily see a 5% drop in the market still.

Anyways I hope this analysis helps everyone…

Check out my trading services at: www.TheTechnicalTraders.com

Chris Vermeulen

May 9, 2010
As we all know, last weeks stock market blip/mini crash was very emotional for those of you watching or trading it live. A lot of money changed hands last week and you either lost a bundle or made a bundle…

I did send out some charts and a video on Thursday night about the market crash/recovery if you have not seen it. It’s called “Stock Market Micro Intraday Crash Shows Us Where The Safe Havens Are”.

Below are my ETF charts for the commodities and index I actively follow and trade.

GLD – Gold Bullion ETF – Daily Chart
GLD is a great ETF to trade as it generates 10-20 quality low risk setups each year for subscribers. The chart clearly shows the large rally in late 2009 and the correction as it formed patterns moving from a down trend – base – and back to an uptrend.

ETF Trading Strategy

$USD – US Dollar Index – Monthly Chart
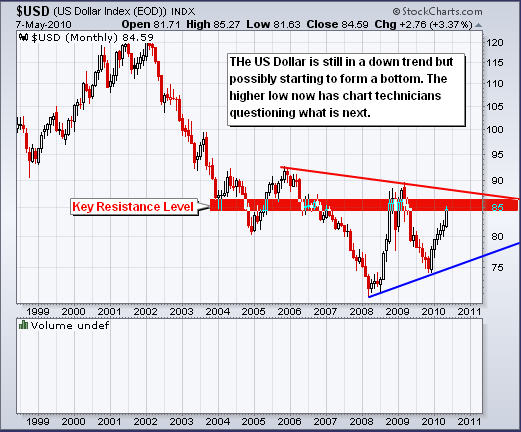
This weekly chart I think shows some serious potential for gold and silver prices. The US Dollar is now trading at a key resistance level which I think it will have a tough time moving higher. The dollar has been moving up for several months and looks ready for a pullback or at least a pause. If the dollar starts to roll over in the next few months then we should see gold and silver move substantially higher.

ETF Trading Strategy

SLV – Silver Bullion ETF – Daily Chart
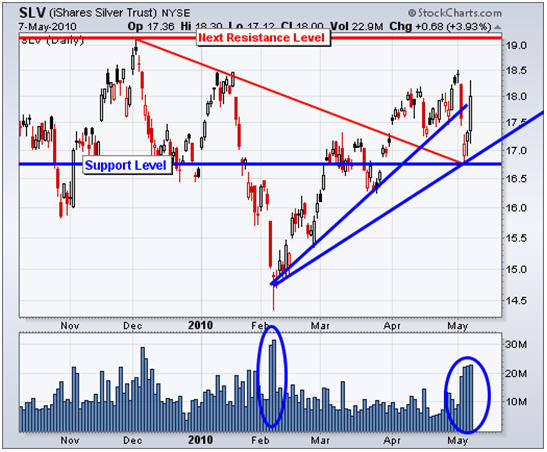
Silver like gold bounced off a key support level last week as investors started to buy silver as a safe haven. Gold moved up sharply on the day of the intraday market crash while silver traded sideways for a day before joining the party. The following day investors starting buying up silver because it was lagging its big sister “yellow Gold”.

ETF Trading Strategy

USO – Oil Fund – Daily Chart
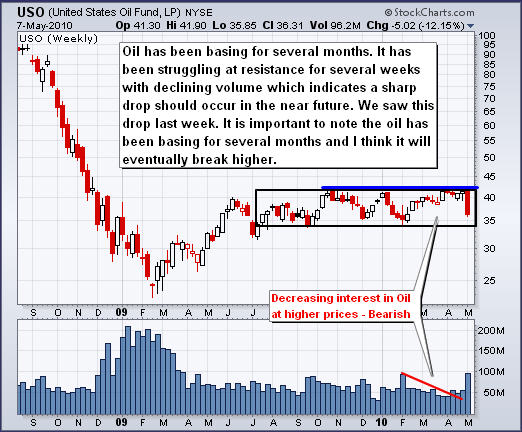
Several weeks back I posted this chart showing how volume was drying up as oil tested resistance on declining volume. This indicated to us that once/if the price started to roll over it would trigger a sharp sell off as short term traders who bought in anticipation of a breakout to the up side sold out of their positions once support was broken. This is what caused the heavy volume and sharp price drop.

ETF Trading Strategy

SPY – SP500 INDEX Trading ETF – Daily Chart
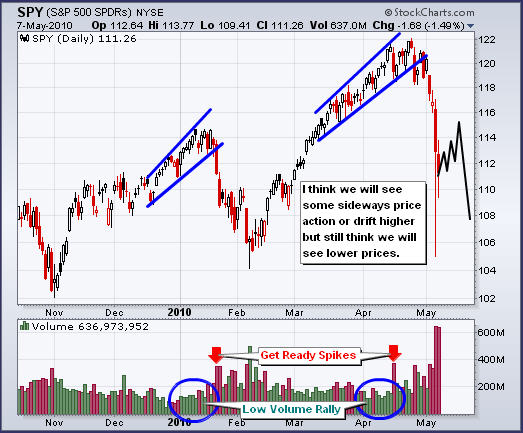
It’s tougher now to read the index charts as last weeks heavy volume market crash could be seen in two very different ways…

One – We are starting a correction and had a jump start with the human error of selling billions of dollars worth of investments instead of millions prematurely pushing pulling the market down to a level where I think it should/will test again before moving up.

OR

Two – This extremely heavy sell off is just the start of what is to come…

Since the government owns the largest banks and the banks are unloading/selling massive amounts of shares calling it an error how do we know it’s not a scam for them to completely short the market in anticipation for a collapse which would make them unheard of amounts of money as the market drops… It is tough to trust anyone sitting up there in those power positions after everything they have been caught for already…

I personally think we could see lower prices in the coming month then the market will bottom and we will see new highs for 2010.

ETF Trading Strategy

Weekend Commodity & Index ETF Trading Strategy Conclusion:
Stepping back and looking at the above charts it looks as thought we could see stocks and commodities digest the recent moves. In short, gold and silver have rallied strong and now trading near resistance. Oil dropped last week and is now trading near a key support level. I feel it the market will trade sideways and stabilize before for a while as the SP500 had that crazy drop last week and now the market is in shock. I figured it would see 3-4 weeks to reach those prices yet it happened in 1 day so now the market could do very little for 3-4 weeks…

The US dollar is something we will be watching more closely because it’s trading at key resistance level. In the past it has taken a month or two for a rally to roll over and head back down. This could play out very nicely if the dollar tops and the rest of the market trends sideways to digest the recent moves. Once the dollar starts to fall it will provide fuel for the next rally in both stocks and commodities.

If you would like to receive my ETF Trading Strategy and Trading Signals Please check out my website: www.TheTechnicalTraders.com

Chris Vermeulen