
The Weekly Technical Take
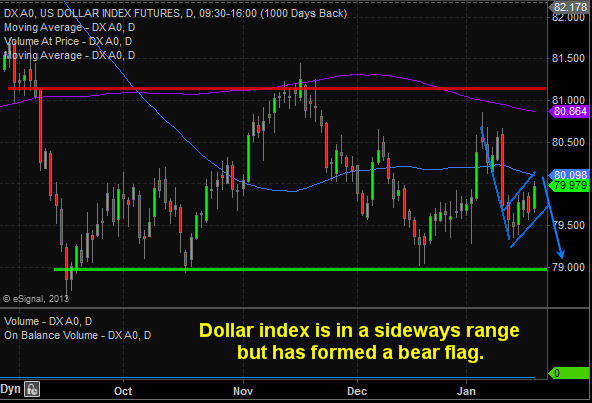
Dollar index 4 hour chart is forming a bear flag. Until the lower blue support line is broken the flag will continue higher.
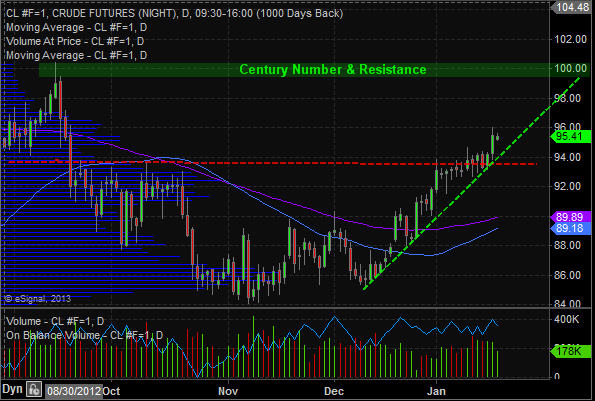
Crude oil has a big pop yesterday as it continues up its support trend line. It looks as though it may take a run at the $100 per barrel level over the next 1-2 weeks.
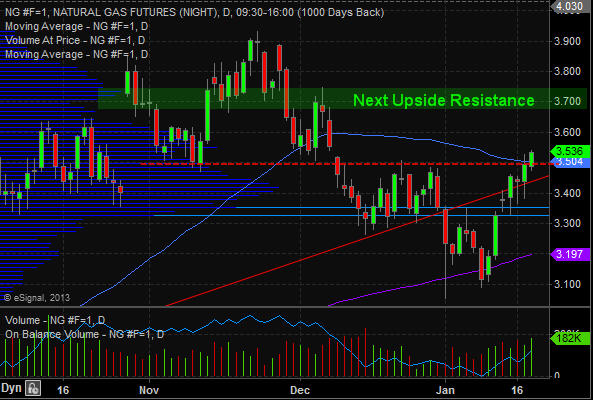
Natural gas had bullish inventory numbers yesterday sending the price sharply higher. It tagged our $4.50 resistance price but could not close above it. This morning it is trading above that level and may confirm a breakout.
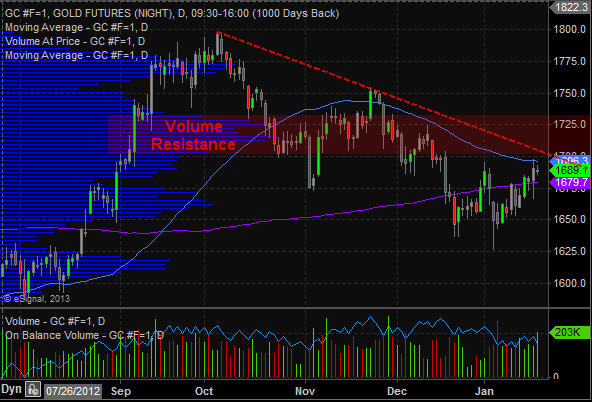
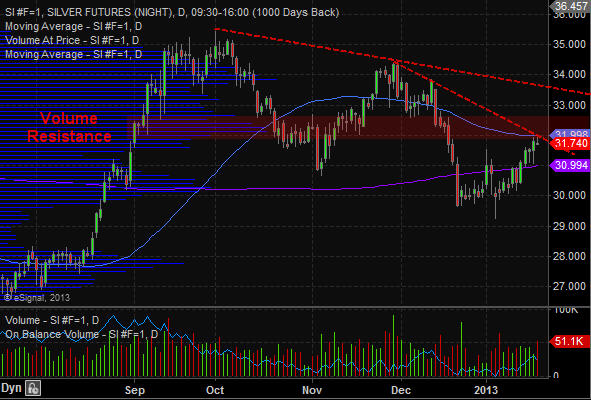
Gold continues in a clear down trend with high volume resistance, down trend line and a moving average holding it down. It seems everyone is turning bullish here on gold, but in my contrarian view that is signaling another short term top. Stick with the trend until proven wrong.
Silver is trading similar to gold. Still in a down trend but is much more volatile.
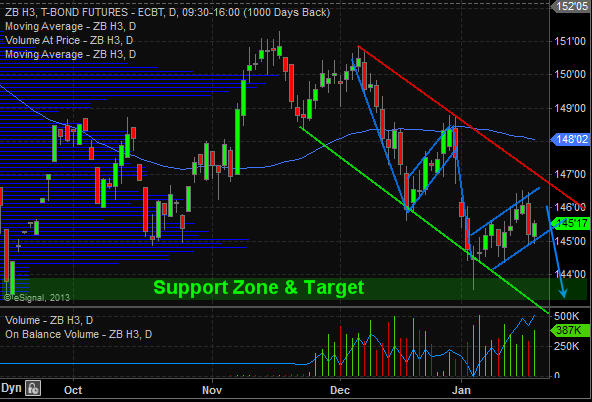
Bonds have been pullback since the December and have formed a falling channel. Price remains bearish which is actually bullish for the stock market.
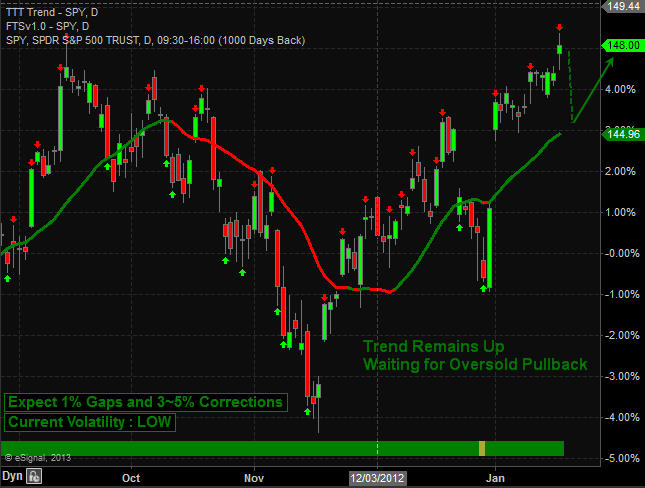
SP500 index continues its uptrend but is trading at a 2% premium above my key support/trend moving average. The SP500 has the potential to drop 2-4% at any time and if so we will be looking to get long with the overall trend.
Morning Market Conclusion:
Each month on average the broad market provides a pullback that signals a broad market entry point. During an entry point you can get long the index, sectors or stocks, and trade options which have formed bullish chart/volume patterns. Unfortunately the last batch of signals that took place was just before the fiscal cliff which we passed on taking because price could have gone either way based on the outcome and the move was going to be big. When Risk is higher I tend to steer clear of entry points.
So now we just have to wait for the next broad market pullback to start building long positions in various ETFs.
Chris Vermeulen – www.TheGoldAndOilGuy.com