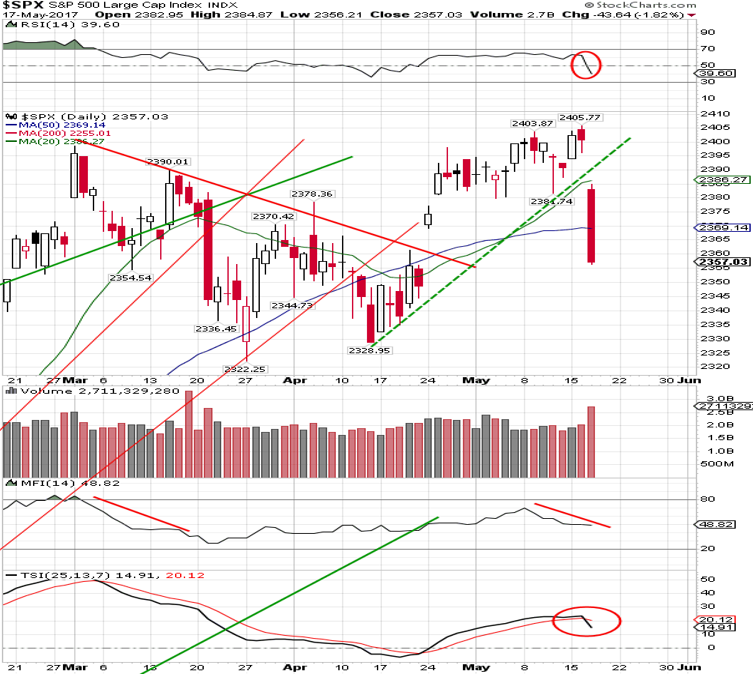
The broad US stock market last week took a tumble sending a massive wave of fear through investors’ minds. On Wednesday May 17th the S&P 500 index plummeted 1.7% causing the fear index to jump a whopping 48% in a single session.

What does this mean and what should we expect going forward? I don’t see the recent drop as being anything to worry about at this point. It’s important to remember that some of that larges drops in stocks happen during a bull market (rising trend). In fact, these stand out sharp drops on the charts are nothing more than the market trying to buck investors out of the bull market (scare them out) before it continues higher.


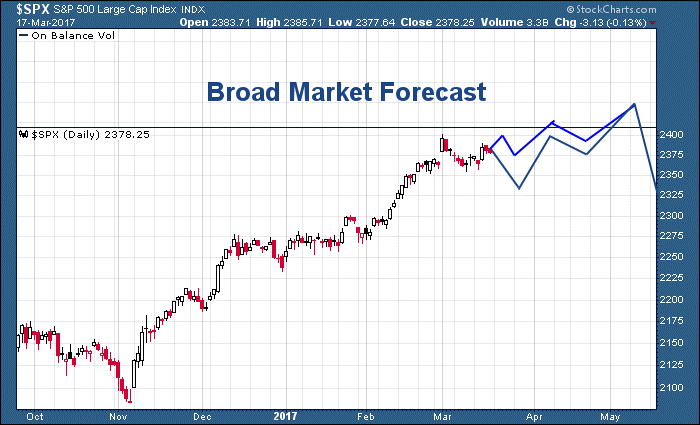
The Market Trend Forecast Prediction

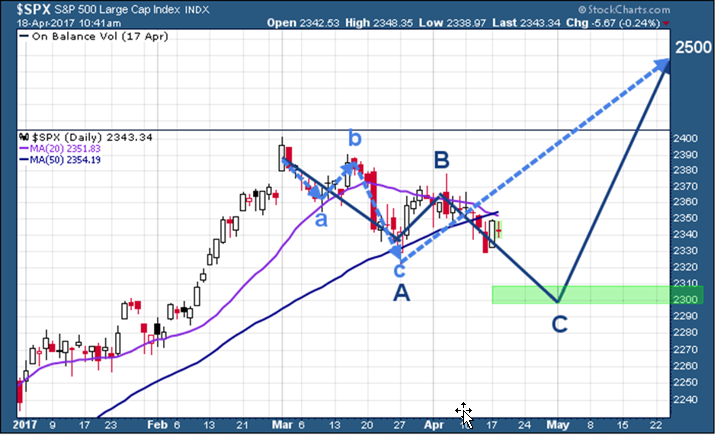
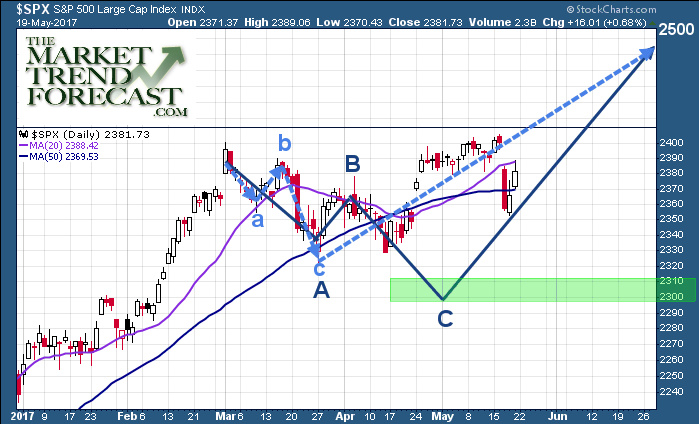
Look at the chart below courtesy of TMTF website. This chart was originally posted back in April with two potential price paths for the SP500 to reach the next price target of 2500. The overall forecast points to higher prices this summer with the potential of a major top forming late July or August.

I should caution that I believe there is potential for another washout low with the SPX dropping to the 2300 level still to reach that Elliott Wave level. Even if this level is hit, the overall market trend will remain bullish and would be fully rejuvenated for the next big leg higher.

TMTF--3


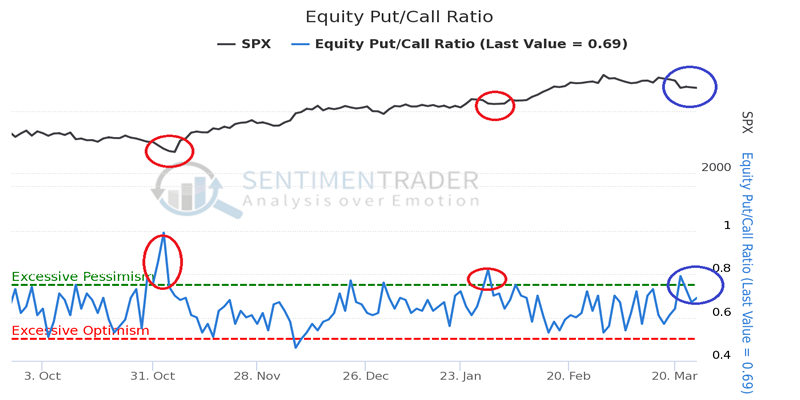
Fade the Fear – Swing Trading Fear

Let’s face it, we all know the feeling of when so one jumps out and scares us. The surge of blood pressure, adrenaline, and how our body jolts into action is a natural human response.

Fear among investors is almost identical when there is a sharp drop in price. Other than the fact that investors don’t typically scream, put up their fists and/or run away, instead they hit the SELL button to close out losing position in order to remove the fear/pain of further losses.

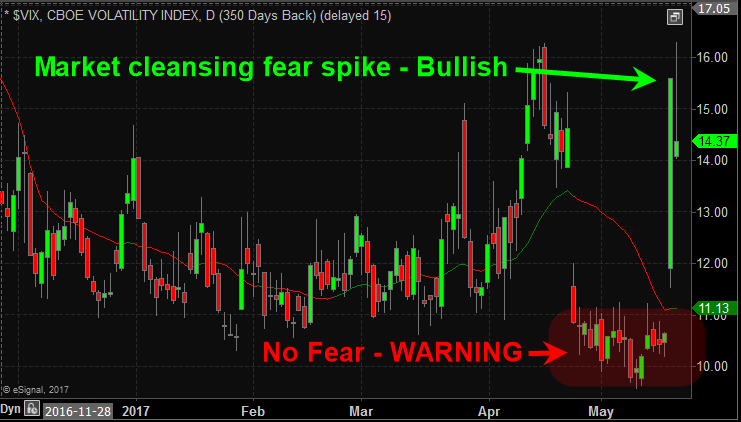
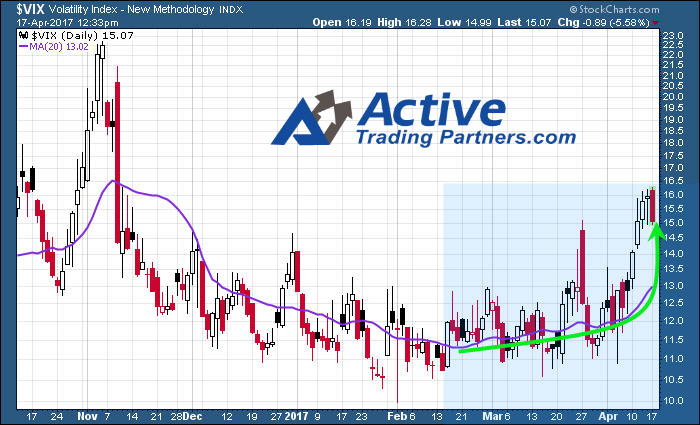
Typically, most traders panic out of positions at the same time (within a few trading days) and this sentiment shift can be seen as a price spike on the VIX chart.

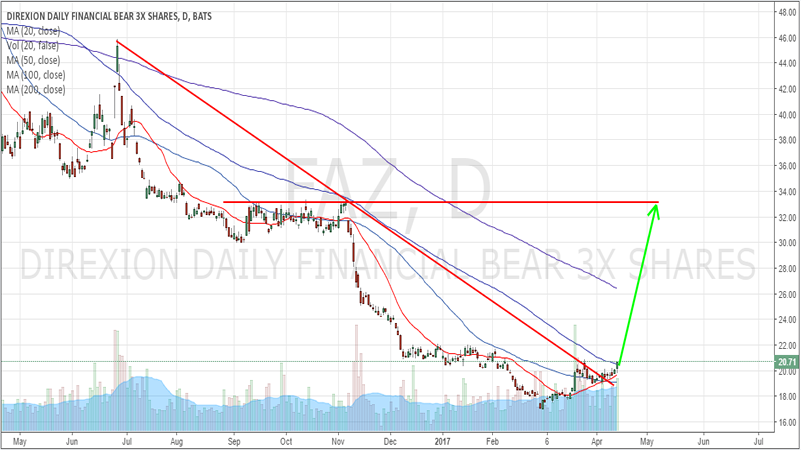
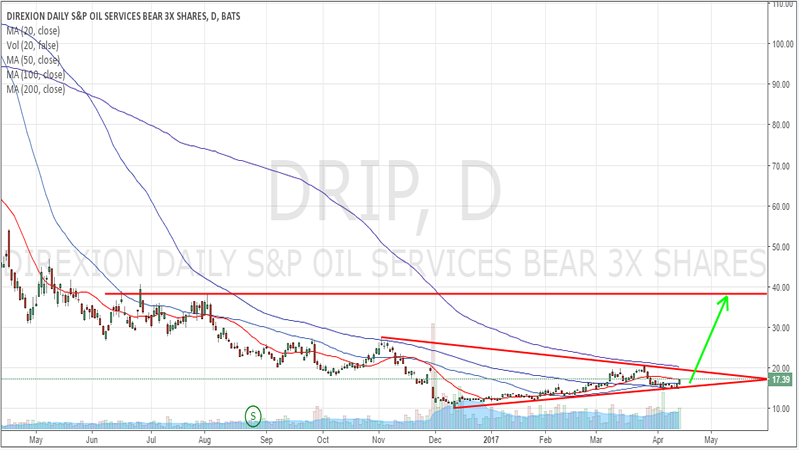
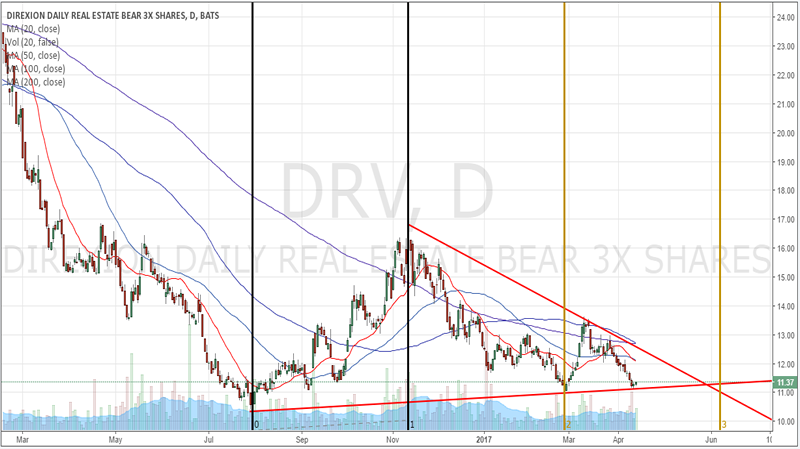
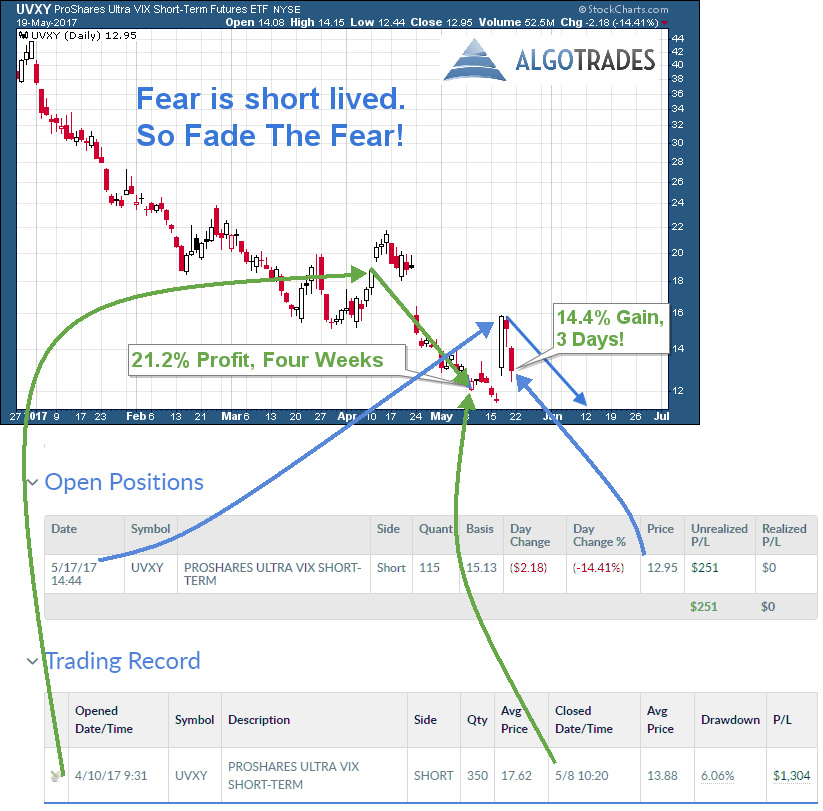
Below you will see a chart and recent trades executed based on a strategy I have been testing for some time and recently started trading live. It is based around the fact that fear/panic is very short lived and fades away quickly. It is also based on the fact that leveraged VIX ETFs also fall in value over time because of how they have been designed. This allows us to short the long leveraged VIX ETF adding further potential gains to a falling VIX price.

vix-atn


Momentum Trade Extreme Panic & Greed

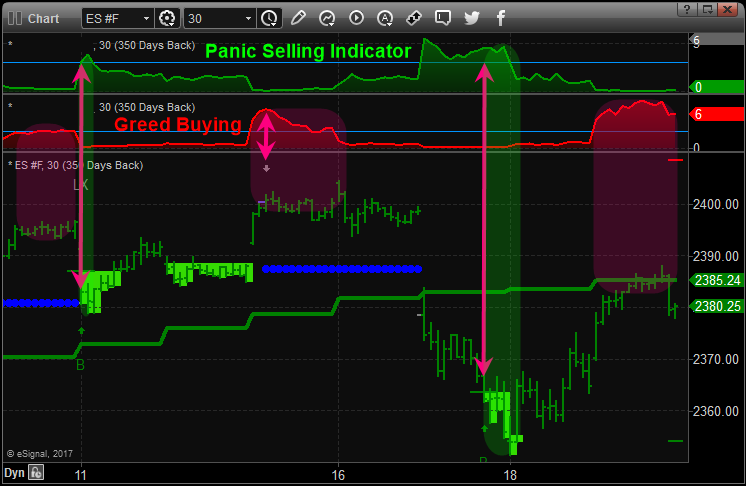
The two previous charts above were based on daily charts of the markets. This portion shows you the potential turning points and trade setups each week based on the 30-minute intraday chart. Some weeks can provide multiple trade setups if property identified.

The below chart is the SP500 continuous contract futures chart which I created and use for identifying turning points and trades in the broad market using SPY, SSO, SDS, or ES Mini Futures. This chart and its analysis also helps me identify when the VIX (Fear index) should be topping or bottoming as well.

Obviously, these moves are small and quick only lasting a day or two. But keep in mind if you have high probability trade setups and apply leverage like ES mini futures one can profit handsomely from small but frequent moves like this ranging between $250 – $1500 profit.

OB-OS


In Conclusion:

In short, the longer-term trend for US equities remains up (bullish). Based on the short-term 30-minute chart above stocks are a little overbought so a small pullback or pause is likely. While this week is a full trading week, it is going into a holiday weekend which typically favors higher stock prices by the closing bell on Friday.

In my next article, I plan to share with you what gold, silver, and miners are setting up for and it’s likely bigger and in the opposite direction than you think, stay tuned!

Finally, I want to mention that I will be getting back to my roots and passion in terms of article content. The past two years I changed gears to write more about the global economy and news. Recently I realized that I just don’t enjoy writing about these types of thing. Its all doom, gloom, corruption, and ridiculous actions but leaders around the world and not fun to write or read. So, I am thrilled to say that things will be back to how they were: Simple, technical analysis based forecasts and weekly trade setups.

Learn more about my daily price forecasts and turning points video: www.TheGoldAndOilGuy.com

Chris Vermeulen

The financial markets have already “priced in” huge tax cuts, reducing red tape regulations and a massive increase in infrastructure spending.

Perhaps, the markets are now believing that the agenda is not going to occur with Al Green asking for Trump impeachment?  This could result in a significant downturn for stocks if it were to unfold.


The SPX index declined more than 1.75% and wiped away about $375 billion in market value. The SPX went from a record close three days ago, to below its 50-day simple moving average on Wednesday May 17th, 2017.  Institutional traders view the 50-day simple moving average as very strong trend support. The SPX level at 2407 turned out to be the best the bulls were capable to achieve. Their second attempt to push the benchmark higher failed at 2406, where the bears stepped in.


Financial Markets are Spooked!

There is a slow leak in U.S. stocks. The SPX has more declining stocks than advancing ones during this tight trading range. This is unusual behavior and resulted in lower returns over the following month.  Tune in every morning for my video analysis and market forecasts on all ‘asset classes’ so you know where and why the market is about to move.

The SPX decline on Wednesday May 17th, 2017, was abnormally large, relative to the past 3 years.

SPXM18

These two market warning signs, the Titanic Syndrome” and the Hindenburg Omen” are giving a “preliminary sell signal” based on analyses of 52-week New Lows in relation to New Highs on the NYSE. On May 4th, 2017, the Hindenburg Omen was triggered on the NYSE and Nasdaq exchanges.  It has a consistent record at highlighting underlying weak market conditions that preceded market trouble. On May 16th, 2017, both exchanges triggered the Titanic Syndrome. This occurs when the NYSE 52-week lows out-number 52-week highs within 7 days of an all-time high in equities within days of the major indexes closing at a one-year highs. Historically, these signals have led to further weakness over the following two weeks. As stocks were plunging, investors are currently panicking out of stocks and into the “safety” of bonds.


Is This The Return of New Volatility?

Richard Haworth, CIO of Capital Advisors, a London-based hedge fund, which bets on rising price swings is quoted as saying, “The market will revert to higher volatility and this could be the start of it. The sharp move this week reflects how low volatility the market was — how complacent.”

VIXM18


Conclusion:

In short, investors have been overly bullish with virtually no fear that share prices could fall.  But this weeks drop seems to have renewed the fear and is cleansing the market by weak investor shares being sold to those who are bullish and willing to hold them for higher prices.

This is normal bullish price action and once this phase ends higher prices should return as we enter the summer months.

In the past week over at ATP service we have closed a few winning trades whie the market sold off. SLV 3.2% profit, FOLD 9.5%, MOBL 15%, and ERY 5.4%.

The bottom line is that it really does not matter which way the market goes, there will always be ways to profit.

Chris Vermeulen
Daily Market Price Forecasting Video
Active Stock & ETF Trading

Stock Market Forecast Big Picture: The broad stock market is working through a more complex corrective price pattern. My recent forecast, as displayed in the chart below, indicates that the next leg up is toward 2500.  The market may be about to start a larger A-B-C correction to test the 2300 level to fully cleanse itself, before starting the next leg up. But overall, the SPX is very bullish long-term.

Investors are among the most pessimistic they have been in 7 years!  Over the past four weeks, this sentiment is nearing the lowest of all readings of the past 30 years. If it declines a bit further, it will suggest future returns of the SPX will be impressively positive over the next couple months.

tmtf-spx

Courtesy of TMTF service


Federal Tax Revenue Falls to 80-Month Low!

The last time that Federal receipts fell this much was, in July of 2008, right before the “financial crisis”.  March of 2017 was the fourth month, in a row, in which federal receipts were down year over year, while growth rates overall have been falling quickly since mid-2015.  This a RED FLASHING warning sign that all is not well in the U.S. economy.


What is their solution?

Private Collection of Overdue Federal Taxes Begins this April.

The Internal Revenue Service, IRS, announced earlier this month have hired four debt collection agencies to collect on outstanding payments from taxpayers. The IRS now has employed private debt collection firms to contact taxpayers who still have not paid their previous years’ taxes.

chart2


Households and employees apparently are NOT doing nearly as well as they have been told they are! I wonder if Chairwoman Yellen and Company. ( https://mises.org/library/end-ultra-easy-money), are aware of all of this?  To my naked eye, this does not look like economic growth nor a healthy economic recovery!

chart3

What we have invented, in order, to keep big banks afloat, for a while longer is ultra-low interest rates, NIRP, ZIRP, etc. They create the illusion of not only growth, but also of wealth. They make people believe that a home they could never have dreamt of otherwise buying not long ago is possible to fit into their ‘budget’. This is how they are lured into signing up for ever larger mortgages, which, in turn, keeps our banks from falling over.

Record low interest rates have become the only way that private banks can create new money and stay alive (because at higher rates barely anyone would be able to afford a mortgage). It is of course not just the banks that are kept alive, but the entire economy, as well.

I really do not think that we are actually returning to normal interest rates under these circumstances. I believe that based on this overview, proper interest rates in the FEDs future are going much lower than it has been historically.  The FED is now going to now realize that it cannot buy itself out of a “business cycle” and that an “old-fashioned” deflationary depression is upon us, now!

chart4


The International Monetary Fund, (IMF), released a report that is projecting a prolonged period of low interest rates and low growth that has gripped the global economy since the 2008 financial crisis. This would force major structural changes of pension funds, asset-management firms and insurance companies. Their products and business models, under lower growth and low interest rates, will have to be radically revamped!  Pension funds, insurance companies and the future of investing all will likely have to change significantly: (https://www.bloomberg.com/view/articles/2017-03-24/pension-crisis-too-big-for-markets-to-ignore). Defined-benefit pension plans would have to start reducing benefits. Insurance companies will have to reinvest in maturing assets at lower yields while continuing to make high payouts on their policies.  Today, they are acting more like hedge funds than their traditional roles. They will most likely require more capital to stay solvent.

The IMF Global Financial Stability Report stated, “The experience of Japan suggests that an imminent and permanent exit from a low-interest-rate environment need not be guaranteed. That would pose “a considerable challenge to financial institutions.” The Trump Rally Will continue🙁 http://www.barrons.com/articles/are-you-ready-for-trump-rally-2-0-1492634005)


Live The American Dream!

Are you living hand-to-mouth or paycheck-to-paycheck? This all is too common a reality for U.S. workers.  Three-quarters of the population are scrambling to cover their basic living costs.  This next problem that Wall Street is about to experience can actually help you to make money, if you understand it and do exactly what we are doing.

Tune in every morning for my video analysis and market forecasts at TheGoldAndOilGuy.com on all ‘asset classes’ and new ETF trade opportunities.

Chris Vermeulen
www.TheGoldAndOilGuy.com


Delinquency rates in Single Family Residential Mortgages and other Consumer Loans began to climb through the later half of 2016 and early 2017.  The timing of this delinquency rate increase coincided almost identically with the Fed increases in their Funds Rate.  Additionally, commercial loan origination stalled for the first time since 2008-2011 (prior to that was a stall in 2000).


As you’ve been likely been following our daily video market analysis, you’ll know that we believe the market is still in a bullish trend and that we expect this upward price action to continue for a while.


These early warning signs that the Fed rate raises may be pushing other factors of the US economy should be viewed as just that – early warning signs.  It also means that Financial and Banking stocks may find some downward price pressure over the next few months. And protection assets (Gold/Silver and related ETFs) may see continued upward price movement as cash migrates from traditional financial assets into more protectionist asset classes.


Single Family Mortgage Delinquency Rate

The two charts below show the rate of mortgages defaulting. Additionally, real estate asset classes may start to see increased volatility as this segment of the economy struggles and has to deal with delinquencies.  The US Fed is attempting to raise rates enough to allow for more normalized economic functions without disrupting the stability of the global markets.  It is our opinion that these efforts by the US Fed will provide substantial rotation in certain sectors of the US markets that skilled traders will be able to profit handsomely from these moves.

SingleFamilyResidentialDefaultRate


All Other Consumer Mortgage Delinquency Rate

OtherLoans


In particular, 3x ETFs may provide unique opportunities for profits.  Let’s review a few potentials…


Throughout all of these charts, I expect you’ll notice a similar setup with regards to Financials, Oil Services and Real Estate.  The Fed easing over the past 6+ years has driven asset prices to near all-time highs (or above all-time highs in some cases) and the recent oil price recovery has driven the oil service industry to near term recent highs.


The examples we are illustrating today are all contingent on the US Fed continuing to raise rates, as planned this year, which may put further pressure on these segments of the markets as well as potentially increase delinquency rates for residential, commercial and other consumer loans.  In other words, we are expecting some moderate price rotation in the markets over the next few months and we are poised to take advantage of these moves if and when a setup occurs.


3x ETF: FAZ – Financial Sector Bear Fund

FAZ_Daily_Final

3x ETF: DRIP – Oil Services Bear Fund

DRIP_Daily_Final 


3x ETF: DRV – Real Estate Bear Fund

DRV_Daily_Final


We deploy our specialized Momentum Reversal Method (MRM) trading strategy to identify exactly when to enter and exit our trades and to find appropriate trading opportunities.  The MRM method is unique and proven.  Our clients are able to take advantage of our specialized MRM trading strategy and receive timely and accurate trading signals from our web site, ActiveTradingPartners.com.  Many of our recent trades have resulted in tremendous gains for our clients.


We want to alert you to the large potential price rotation we are expecting in the immediate future and to alert you to the unique opportunities this type of price rotation will present.  Remember, well over 2 months ago we warned of a VIX SPIKE that was likely between March 15th and April 24th of this year.


Take a quick look at the VIX Daily chart to see our prediction

vix

We urge you to consider this information in your trading decisions as well as consider using our stock and 3x ETF trade alert service to further your trading success.  Again, the trading opportunities we are presenting today are not trading signals.  We are waiting for our MRM strategy to issue the trade trigger, then all our clients will be alerted to the signals.


Chris Vermeulen
www.TheGoldAndOilGuy.com – Daily Market Forecast Video & ETFs
www.ActiveTradingPartners.com – Stock & 3x ETFs

The United States is the world’s largest and most diversified economy! It is currently suffering through a protracted period of slow growth which has held down job creation and labor market participation.  The Pew Research Center reported, in late 2015, that a mere 19% of Americans trust the government either always or most of the time.

The FED must print more money in order to keep the party going forward.

The bottom line is that this current bull market has been driven mostly by corporations which are buying back their shares, over the years. Individual investors have increasingly been moving out of equity mutual funds and into equity ETF’s.

ec3


The Congressional Budget Office (CBO) reported that in fiscal year 2016, the federal budget deficit increased in relation to the GDP, for the first time since 2009. The CBO projects that over the next decade, budget deficits will follow an upward trajectory. The spending costs for retirement and health care programs targeted towards senior citizens, and rising interest payments on the government’s debt will be the root drivers. There will be only a modest growth in revenue collections. This will drive up public debt to its’ highest level of gross domestic product (GDP) since shortly after World War II ended.

The Congressional Budget Office stated that the nation’s public debt will reach 145 percent of gross domestic product by 2047


ec5


Conclusion:

The BULLISH Trend in the stock markets is not reversing in the near future.

The stock market is on an upward trajectory.  Are you wondering what you should do next?

Do you want to gain the edge that you need in order to beat the markets an profit during both rising and falling prices?

Take advantage of my insight and expertise as I can help you to grow your trading account. Tune in every morning for my video analysis and market forecasts at TheGoldAndOilGuy.com on all ‘asset classes’ and new ETF trade opportunities.

I always take half off of the table, on all positions, to lock in quick solid gains and then ride out the other half for much higher returns!  I manage my risk while keeping profits!

Chris Vermeulen
www.TheGoldAndOilGuy.com

The “real”  Atlanta Fed’s reading of Q1 GDP   went off a cliff to less than 1%:

No one has the slightest idea of what is happening as insane levels of debt distort the model’s which economists use to forecast the future economic trends. From here on out, there will be unpleasant surprises all the way around. According to shadow stats, the GDP is in contraction at the rate of -2%.

april1


The New Normal & Disconnect:

The FED and other agencies have taken on new responsibilities for managing systemic risk since the financial crisis of 2007.

What grade have they earned?  The impact of implemented low-interest rates for savers has made them poorer. All pension plans, college endowments, and state retirement plans have been diminished and devastated by low-interest rates. Savers have suffered and will continue to do so because of ‘financial repression’.

Furthermore, because low-interest rates make savers poorer, the contracting economy has limped along with anemic growth rates. Low-interest rates have had a negative impact for almost everyone.


Preparing For The Big Crunch!

The FED will respond with even more aggressive money printing — which will then cause the entire monetary system to implode some day.  Money is not wealth, but rather it is merely a claim on wealth.  Debt is a claim on future money.  The only way to have faith in our current monetary policies is if one believes that we can grow our economy and GDP out of this massive debt that we have created.  The U.S. is already insolvent, meaning liabilities exceed assets.  The U.S. has been spending, far beyond its’ means, for multiple decades while amassing tremendous amounts of public debt, private debt and entitlement liabilities.


The Austrian economist Ludwig von Mises said, “There is no means of avoiding the final collapse of a boom brought about by credit expansion. The alternative is only whether the crisis should come sooner as the result of voluntary abandonment of further credit expansion, or later as a final and total catastrophe of the currency system involved.”


U.S. economic growth began slowing down due to its’ acceleration of ‘too much debt’. Instead of allowing natural market forces to clear out the excessive debts, the Federal Reserve chose to go into overdrive to ‘remedy’ the problem. Its’ remedy? Drive interest rates to 0% to reduce the service burden of those debts and print trillions of fresh dollars which, in turn, would fund new borrowing.

Of course, no true ‘solution’ for resolving debt involves piling up even more of it.  The only path that history has shown that works involves fiscal austerity and reducing debt. The only real solution is “a voluntary abandonment of the credit expansion”.  

The only possible solution for recovery, today, is if the economy suddenly returns to an extremely rapid economic growth over an extended period of time.  If during such a period of rapid growth does occur, we must use that windfall to pay down the outstanding debts!  The intent of the FED treading into the never-before-tried ZIRP and NIRP waters was to ignite more borrowing, not more spending!

Pension plans have been ultimately decimated by these monetary policies!

Pension funds across the U.S. are desperate to overcome low interest rates and return to the time when future retirees were entitled to and could receive their full benefits. Pension funds which so many depend upon for their retirement security will lose trillions of dollars which will result in the depletion of receiving their benefits!


The chart below reflects the last two times that industrial and commercial loan contracts crashed which were in 1999 and 2007!{25 year chart} of all American Bank Commercial and Industrial Loans.The last 2 times loans contracted and broke down was 1999 & 2007

April2

Making Real Profits!

Want to gain the edge you need to beat the markets? Or Better yet, profit during the next market correction through the use of Inverse Exchange Traded Funds?

Take advantage of my insight and expertise as I can help you grow your trading account. Tune in every morning for my video analysis and market forecasts at TheGoldAndOilGuy.com on all ‘asset classes’ and new ETF trade opportunities.

I am currently in a gold related trade. The last gold trade that I provided, returned a trade with NUGT resulting in an 112% Profit From Dec – Feb.

We use a combination of traditional technical analytical tools, Elliot Wave Counts and investor sentiment! This makes for Killer Trades with oversized Profits!

We always take half off of the table on all positions to lock in quick solid gains and then we ride the other half for much higher returns!  We reduce our risk while keeping our gains!

It looks as though we are a couple of days away from the next major trade setup which could last several months with the potential for a 51-55% return. Be sure to keep informed by reading my newsletters and get my stock trades and leveraged ETF trades at www.ActiveTradingPartners.com

The Japanese and Swiss Central Banks have turned themselves into one of its market’s biggest “investors”. The Swiss National Bank is a huge holder of U.S. blue chip stocks like Apple and Microsoft. The FED has been “elevating” the U.S. stock market, indirectly, by buying bonds!

 
If the stock market crashes, the FED will bail out investors like Japan and Switzerland in the next market downturn? – http://libertystreeteconomics.newyorkfed.org/2012/07/the-puzzling-pre-fomc-announcement-drift.html.

BOJ_ETF SNB_USEquityHolding

The FED could lift large cap stocks possibly pushing prices to levels that history would consider totally insane!
Currently the SPX is experiencing a period of consolidation. Do NOT short this market! The momentum oscillators are now RESETTING for the next move up!

 
These oscillators are extremely helpful in trending markets. According to Traders Almanac, the month of April is the best month for the Dow Jones with an average gain of 1.9% since 1950, p. 38.


USBroadMarketForecast

Courtesy of TMTF service

Market bubbles are rarer than you think and very hard to recognize until it is too late. Many economists have long debated whether bubbles can be identified and then stopped, before they burst and cause widespread damage like the crisis of 2007-2008.

 
Investors are always questioning if it possible to avoid being pulled into a bubble at the top. All investors can avoid declines like the 80% drop experienced by the NASDAQ 100 index of technology stocks between March 2000 and August 2002 just by viewing my daily morning video reports, for by following the direction of the momentum stock trades over at ATP.


The latest Sentiment Surveys disclosed:

Small investors tend to trade on emotions rather than logic or expertise which is why they are considered the dumb money. Finally succumbing to the lure of apparently easy money and pouring their savings into the stock market. This dumb money flowed into exchange traded funds (ETFs) which offers exposure to all sectors and broad market indexes. BlackRock Inc. reports Investors poured $62.9 billion into exchange-traded funds in February of 2017: (https://www.wsj.com/articles/etfs-race-to-fastest-yearly-start-ever-based-on-inflows-blackrock-data-show-1488499476).

 
The NAAIM survey, (http://www.naaim.org/programs/naaim-exposure-index/), of active investment managers, is showing the least exposure to stocks in months. Active Managers, which is considered the smart money have been stepping cutting back their exposure from “Risk On”

 
The four other times they pulled back after spending months heavily exposed to stocks, the SPX took off to the upside. They did maintain high exposure to stocks since November of 2016, which was the right move. Now, they have started to reduce their positions and are below 80% net exposure for the first time in months. Investment manager exposure is dipping after months of being extremely exposed.

 
The stock market tends to swing from one extreme to the opposite extreme as human emotions swing from greed to fear and back again! The CNN Money Fear & Greed Index indicates FEAR at 30 on Friday March 24th, 2017, signaling its lowest level of investor confidence since November of 2016 before the election:(http://money.cnn.com/data/fear-and-greed/). Our metrics are reflecting that optimism is declining after recording extreme optimism, but has reached neutral territory.

 
The total put/call ratio is the volume of puts divided by the volume of calls traded on individual equities on the Chicago Board Options Exchange. The chart below indicates that the “sweet spots” to BUY is when this indicator reaches EXCESSIVE PESSIMISM which are marketed by the red circles.

EquityPutCallRatio

Individual investors feel comfortable with the rate hike by the FEDS as positive. The speed and the extent of the post-election rally and the prevailing level of valuations remain a point of concern The potential impact that President Trump could have on the domestic and global economy continues to cause uncertainty among some investors, while encouraging the majority.


How to Play Wall Street for Profits

We use a combination of traditional technical analysis tools, Elliot Wave Counts and investor sentiment! This makes for Killer Trades with oversized Profits!

 
There are ways to take advantage of these fast-moving markets to earn a steady income or grow your trading account. That is through our Momentum Reversal Method (MRM). The key tenants of my trading are waiting for the right trigger/event and getting in early. We find this is one of the most difficult aspects for traders to understand and master, and why we do best and share with followers of our trade alerts.

Recent Trading Results Include:
UGAZ 74%
ERX 7.7%
NUGT 112%
URA 2.7%

Our most current active trades are in FOLD and CARB which both are ready to soar with the next market upswing!

Get Trade Alerts in Real-Time at: www.ActiveTradingPartners.com

John Winston & Chris Vermeulen