Our recent analysis bases on a previous report of the potential for a further run in the US markets based on a number of technical and fundamental factors leads to the question of “what could happen with Gold and Silver”. A broad US market rally may put some pressure on the metals markets initially, but, in our opinion, the increase in volatility and uncertainty will likely prompt more potential for upward price action in precious metals.
As with most things in the midst of uncertainty and transition, the US Presidential election has caused many traders to rethink positions and potential. As foreign elections continue to play out, wild currency moves are starting to become more of a standard for volatility. Combine this with a new US President and a repositioning of US global and local objectives and we believe we are setting up for one of the most expansive moves in recent years for the US general markets and the metals markets. This week, alone, we have seen a flurry of action in DC and the US markets broke upward on news of the Dakota Pipeline and other Executive actions.
As we wrote week or so ago, we believe the US markets will push higher in 2017 a business investment, US strategy and foreign capital runs back into the US equity market chasing opportunity and gains. Additionally, we believe the strength of the US market, paired with continued strength of the US Dollar, will drive a further increase in global volatility and wild swings in foreign markets. This volatility, uncertainty and equity repositioning will likely drive Gold and Silver to continued highs throughout 2017 – possibly much longer if the new trend generates renewed follow-through.
Our belief that the US markets will continue to melt-up while certain foreign markets deteriorate relates to our belief that currency variances will become more volatile and excessive over the next few months. This, in combination with a renewed interest in developing US economic solutions, will likely drive the US markets higher while the metals markets will continue to become a safe-haven for US and foreign investors to protect against deflation and foreign market corrections.
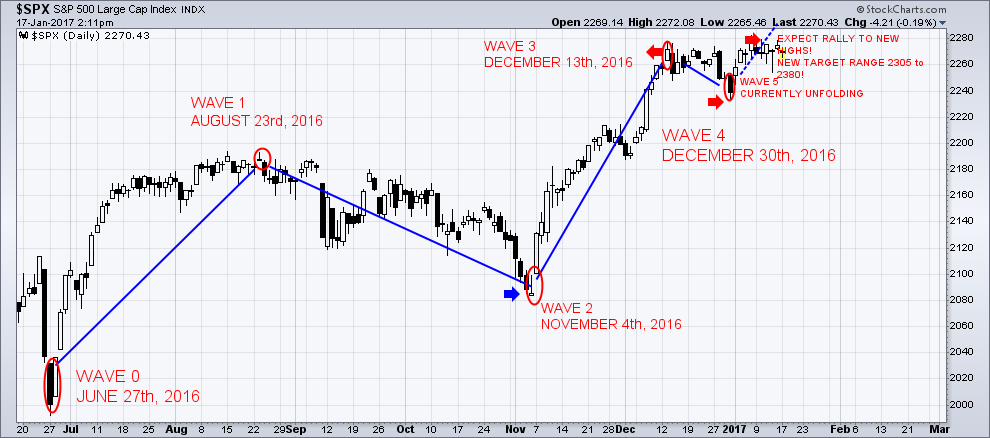
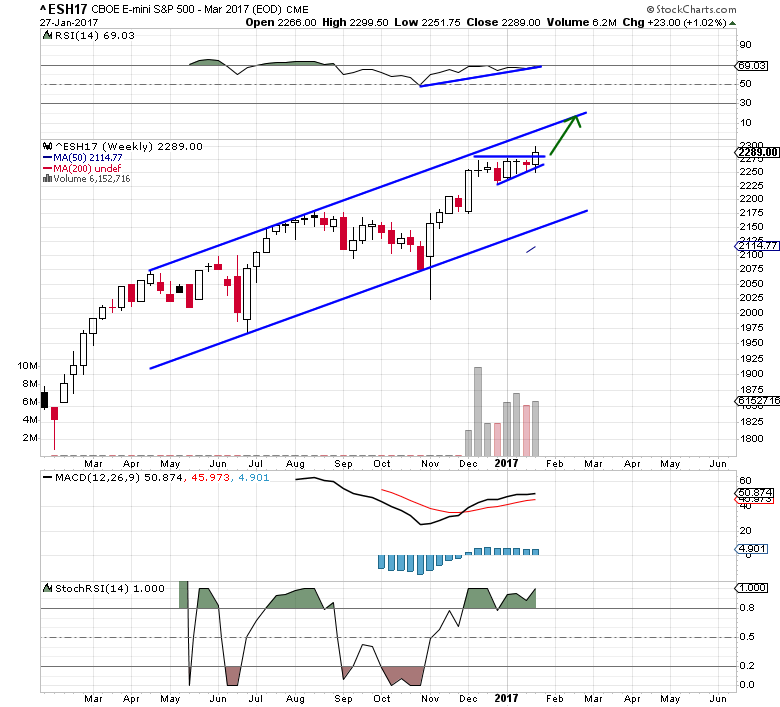
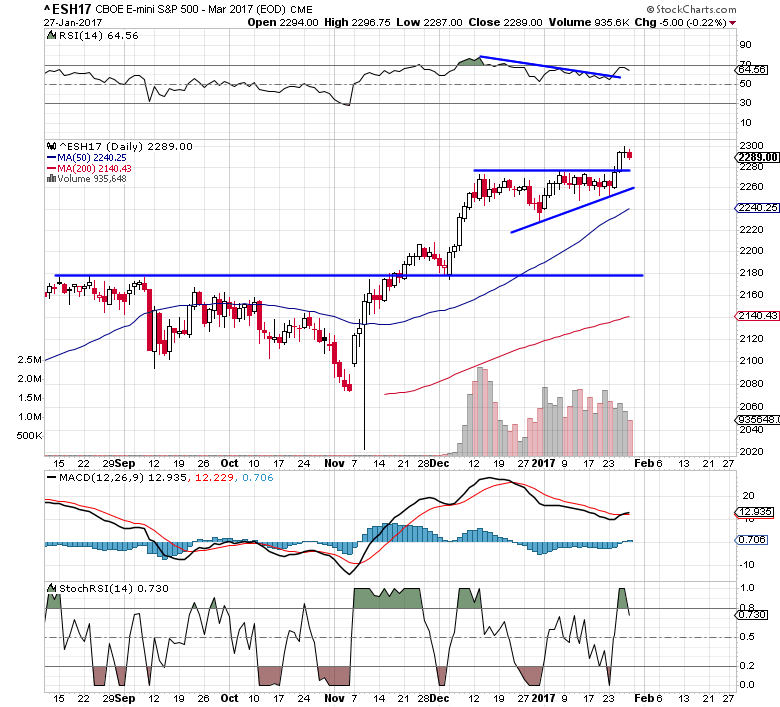
S&P Futures are setting up a clear bullish pennant/flag formation that will likely prompt an explosive price move within 2~3 weeks. This bullish flag formation is likely to drive the ES price higher by roughly 100+ pts. Currently, strong resistance is just above 2275, so we’ll have to wait for this level to be breached before we see any potential for a bigger price move.
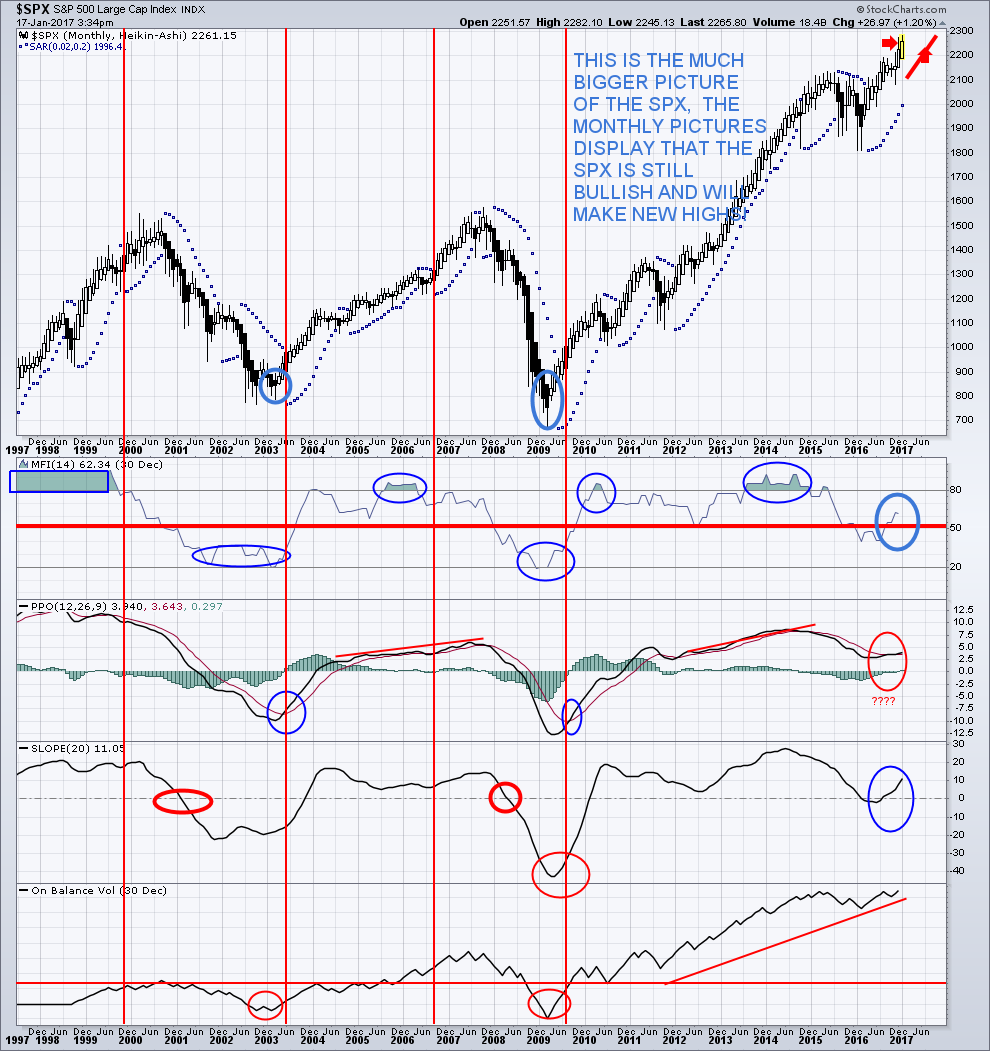
SP500 Weekly Chart
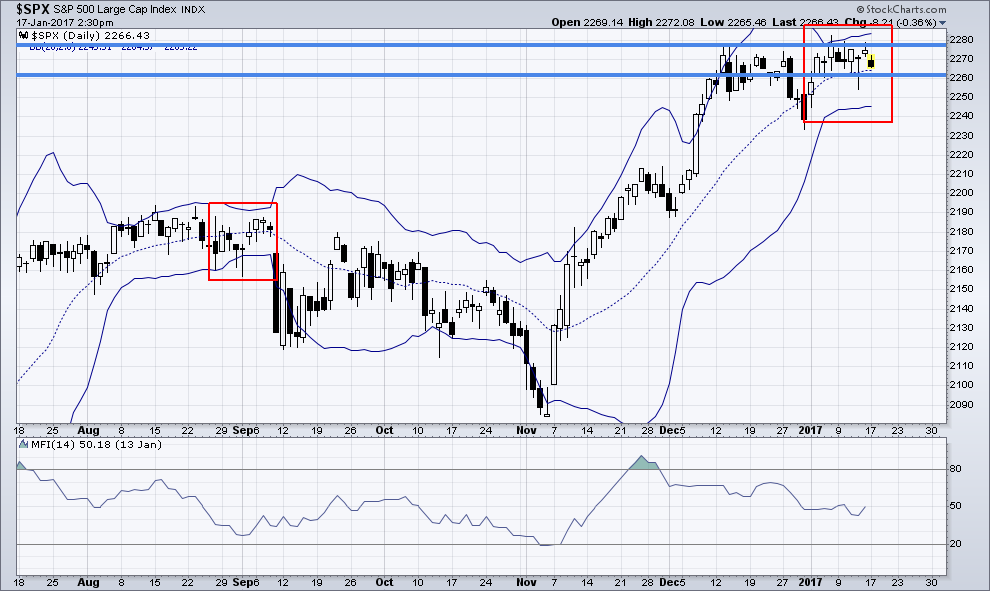
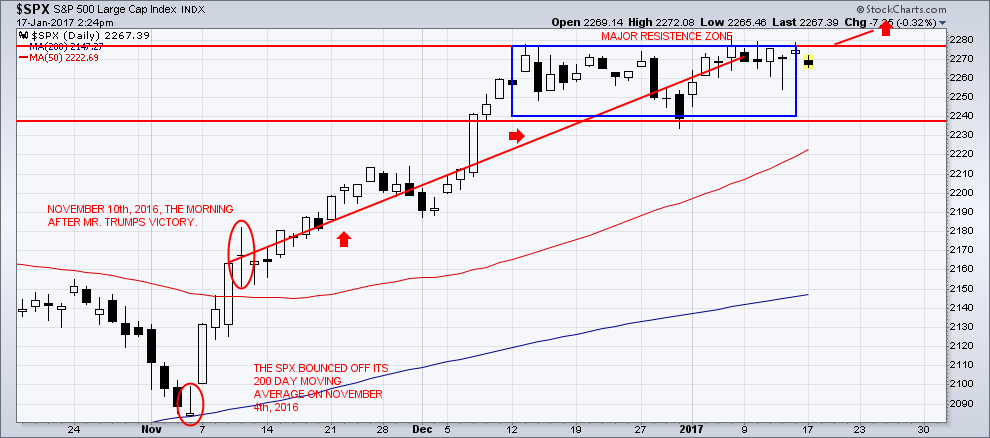
SP500 Daily Chart
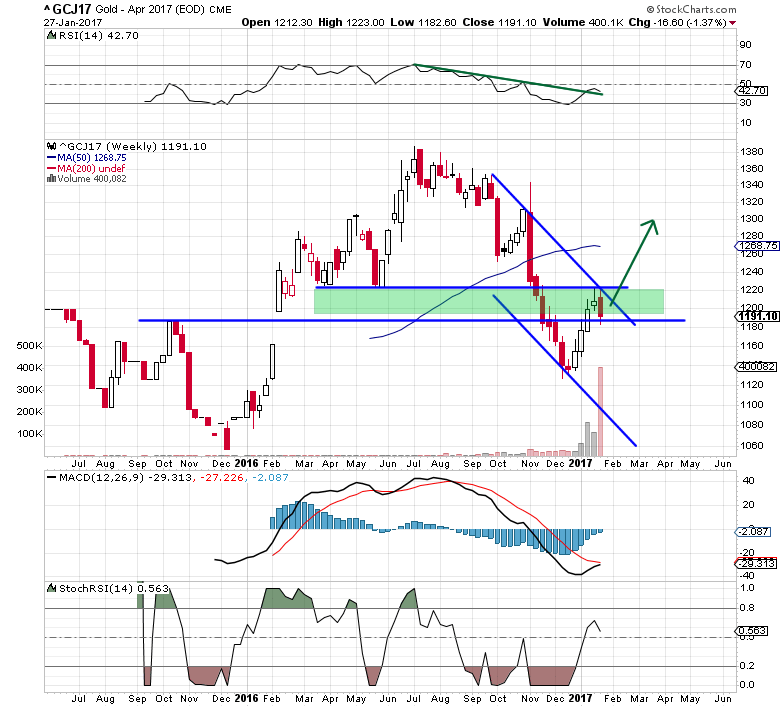
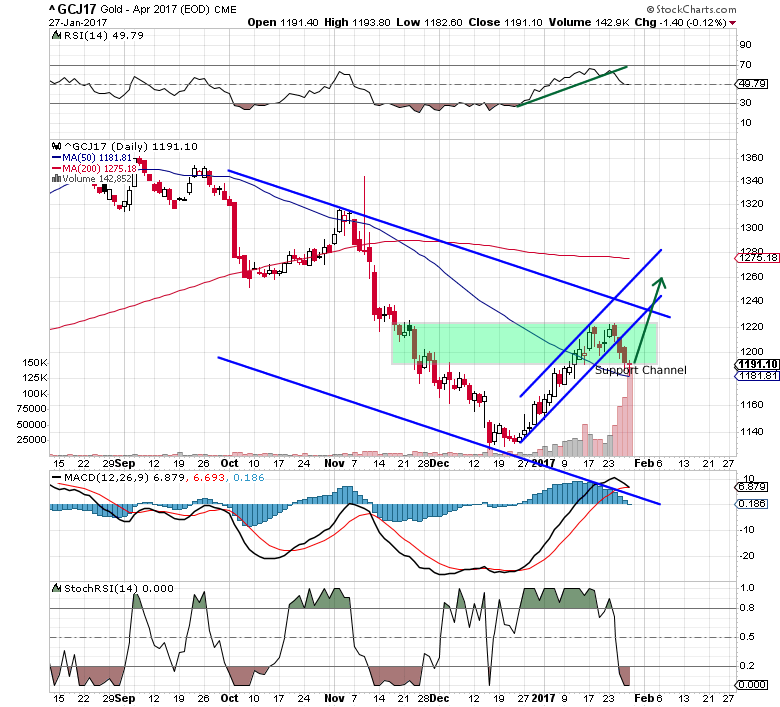
GOLD is channeling in a very clear and narrow upward price channel and trading in the middle of a support zone. The recent reversal, near the end of 2016, was interesting because GOLD trailed lower after the US election, but then reversed course just before the new year. The interesting fact about this move is that this new upward swing in GOLD correlates with the beginning of the Bullish Flag in the S&P Futures as well as a decrease in volatility. We believe as this Bullish Flag will prompt a jump in volatility and price action that will result in is a strong push higher in GOLD.
GOLD Weekly Chart
Gold Daily Chart
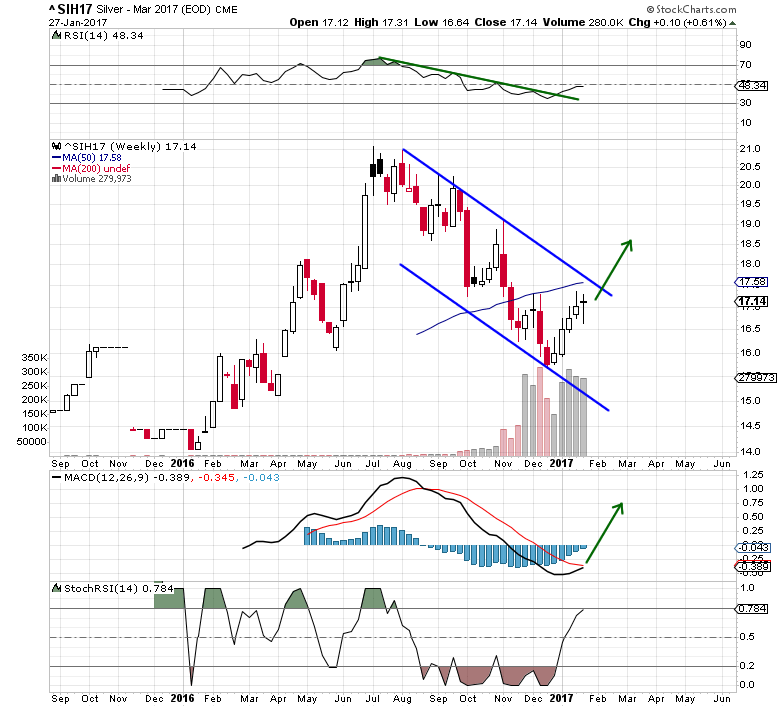
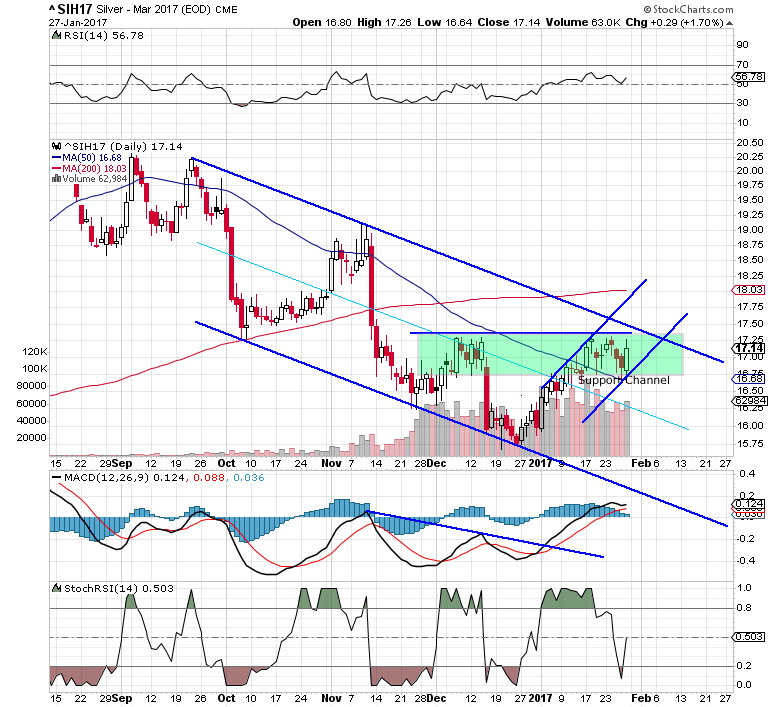
SILVER is setting up in a similar manner as GOLD. Although the SILVER chart provides a clearer picture of the downward price channel that is about to be breached – and likely drive both SILVER and GOLD into a new bullish rally. The support Zone in SILVER, between $16.60 ~ $17.40 is still very much in play. SILVER will likely stay within this zone while the Bullish Flag plays out. Yet, when the breakout begins, a move above $18.00 will be very quick and upside targets are $18.50~18.75 and $19.50~$20.00 (possibly much higher in the long run).
SILVER Weekly Chart
Silver Daily Chart
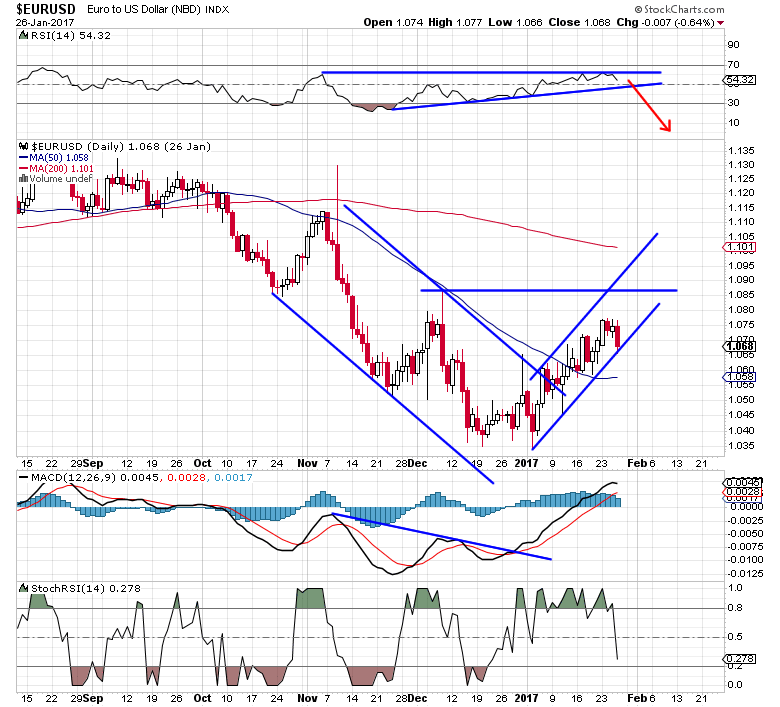
EUR/USD correlation to the US moves should be viewed as measure of strengthening US economy/USD as related to foreign market volatility and potential. As the USD strengthens, this puts pressure on foreign governments and global transactions based in USD. This also puts pressure on the METALS markets because billions of people around the globe consume precious metals as a “safe-haven” related to currency volatility. We expect the EUR/USD levels to fall near “parity” (1.00) again and possibly dip below parity based on future foreign election results. This volatility and uncertainty will translate to increased opportunity for GOLD and SILVER to run much higher over the next few months.
EURUSD Daily Chart
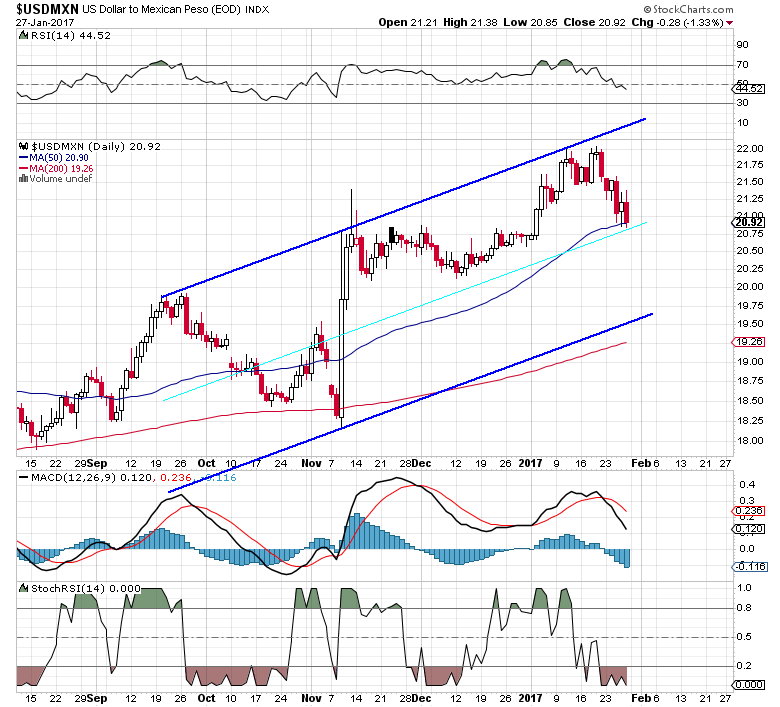
USDMXN Daily Chart
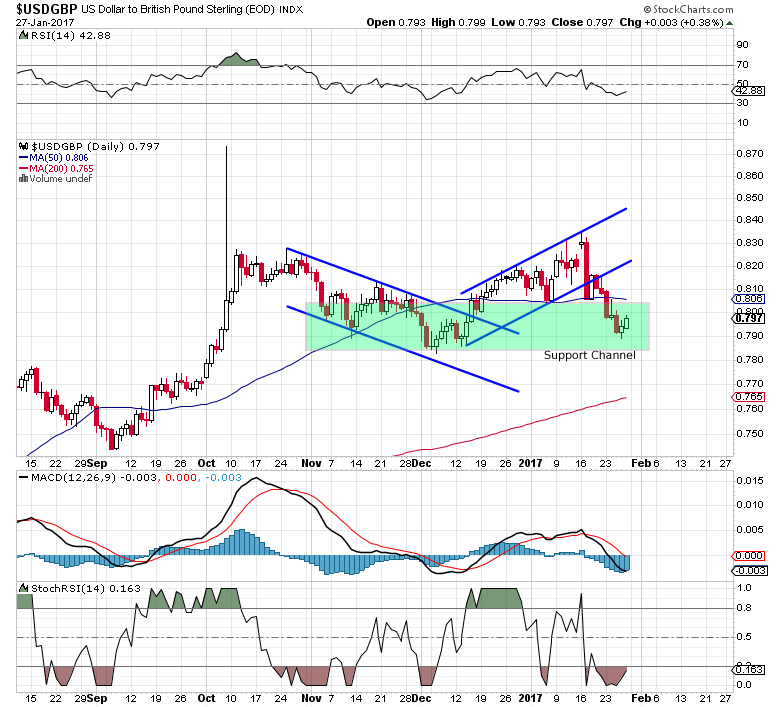
USDGBP Daily Chart
Right now is a fantastic opportunity to take advantage of these lower prices. We may see rotation near to the lower support zone levels as price rotates over the next few weeks. The key to any trade in the metals market is to understand the potential moves and watch for confluence and volatility in other markets. We believe the next few weeks/months will be very telling. If we are correct, we’ll see new highs in the US markets fairly quickly and we’ll see a new potential bullish breakout in GOLD and SILVER.
You can follow our weekly analysis and trade ideas at www.TheMarketTrendForecast.com
Chris Vermeulen & John Winston