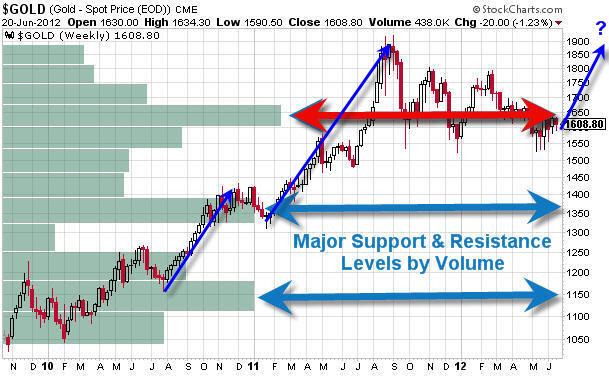
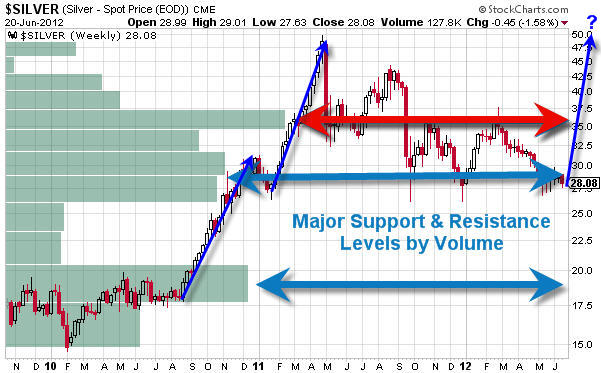
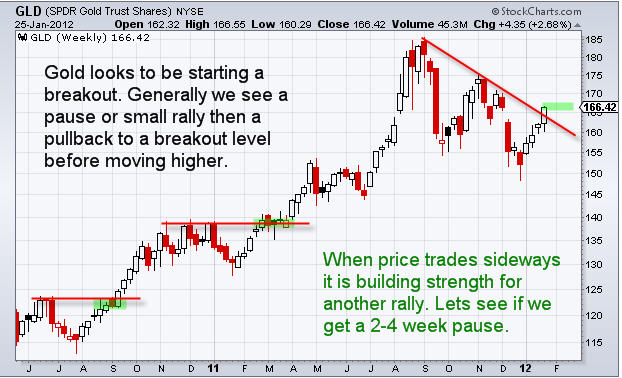
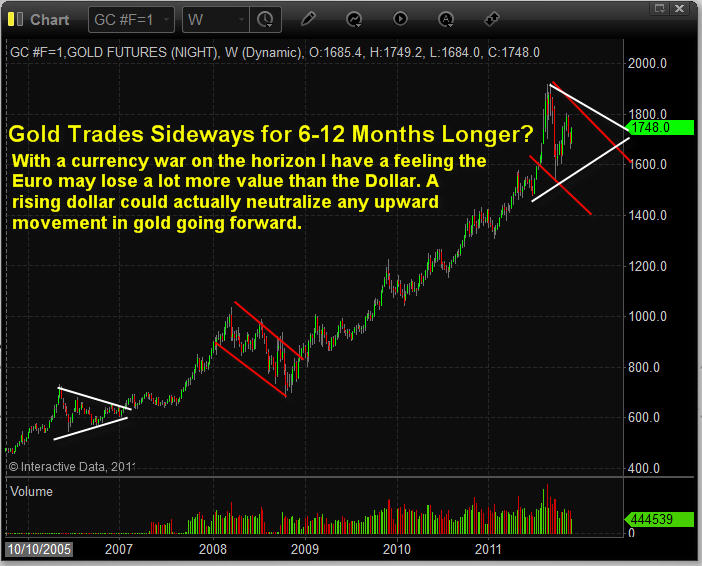
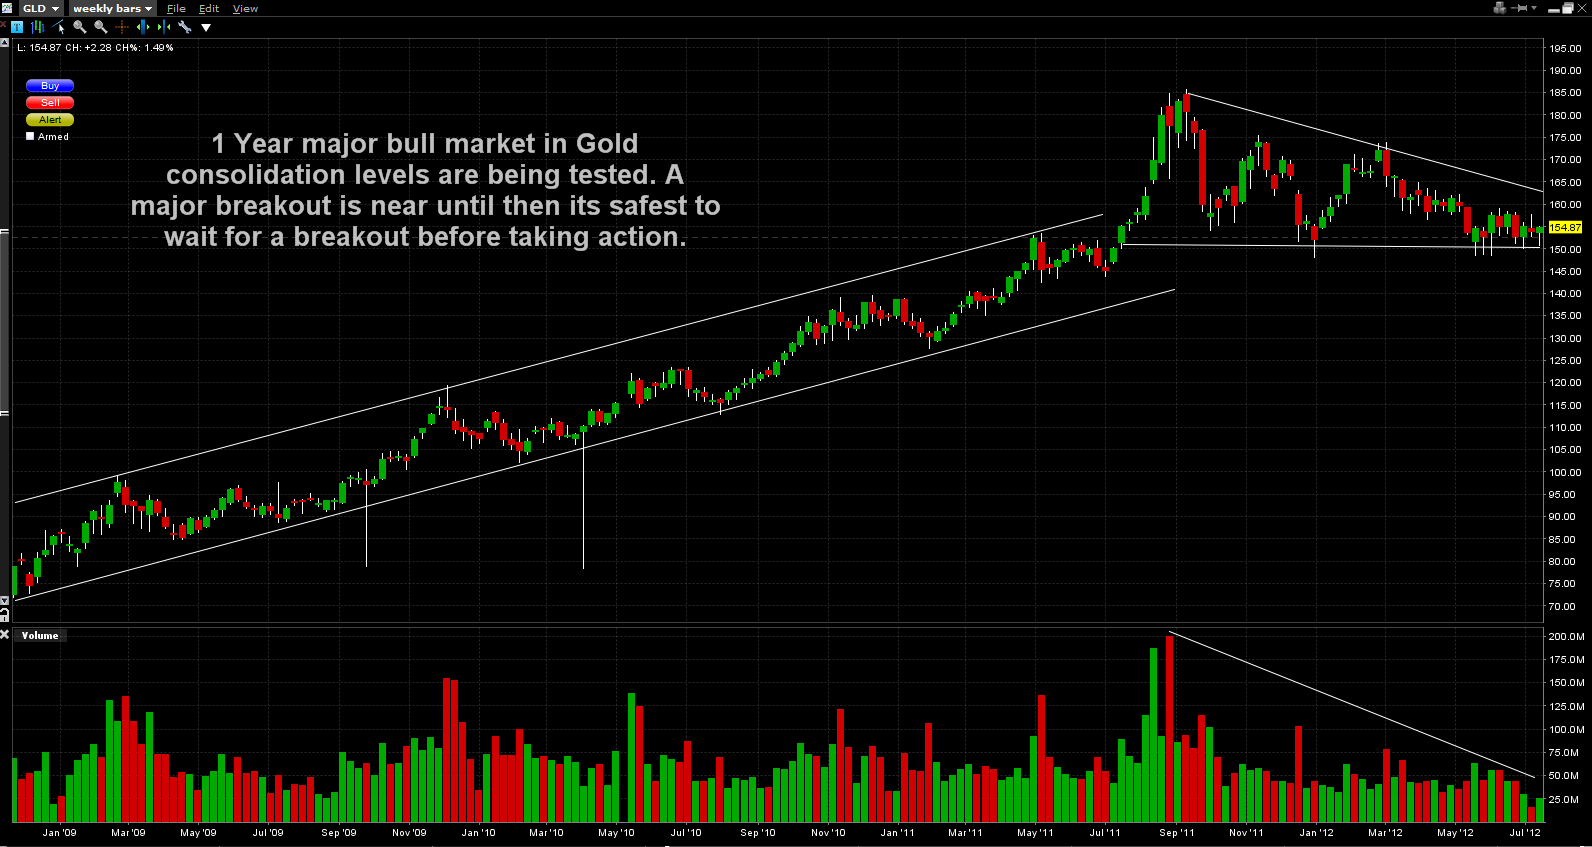
After making new highs about a year ago we have seen Silver and Gold consolidate for roughly the last twelve months.  Technically, it would typically be a bullish scenario with gold from the stand point that the last 12 months’ price action was a sideways consolidation in a bullish pennant formation.  However over the last year we have witnessed a series of lower highs and increasingly tested supports levels around $150 on GLD which raises caution.

  Click Gold Chart for Full Size

With the fed pulling any extensions on further quantitative easing in the form of QE3 or other programs, the bullish case has lately been criticised.  However I am still a firm believer that gold in most respects is a currency, and the only one that can maintain its value.  There are very serious issues looming in Europe and across the world that are far from resolution.  With few tools left in the toolbox to stimulate world economies, further easing can never be ruled out.

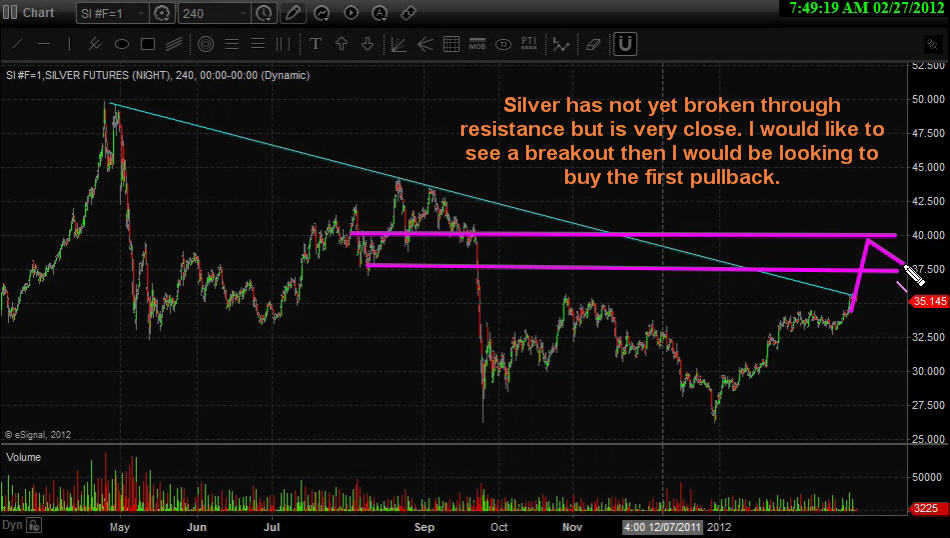
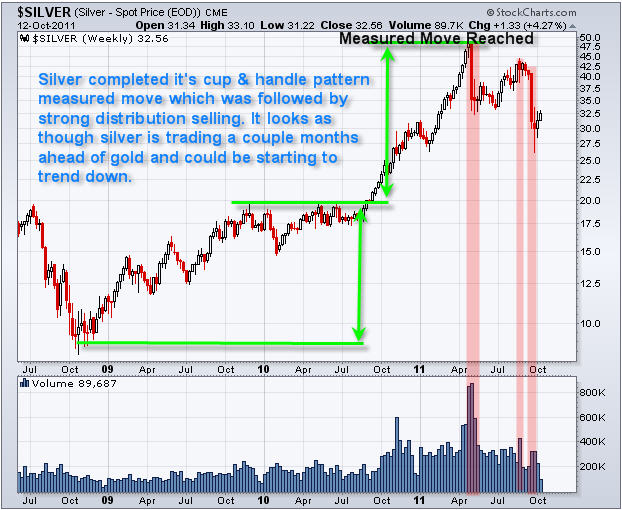
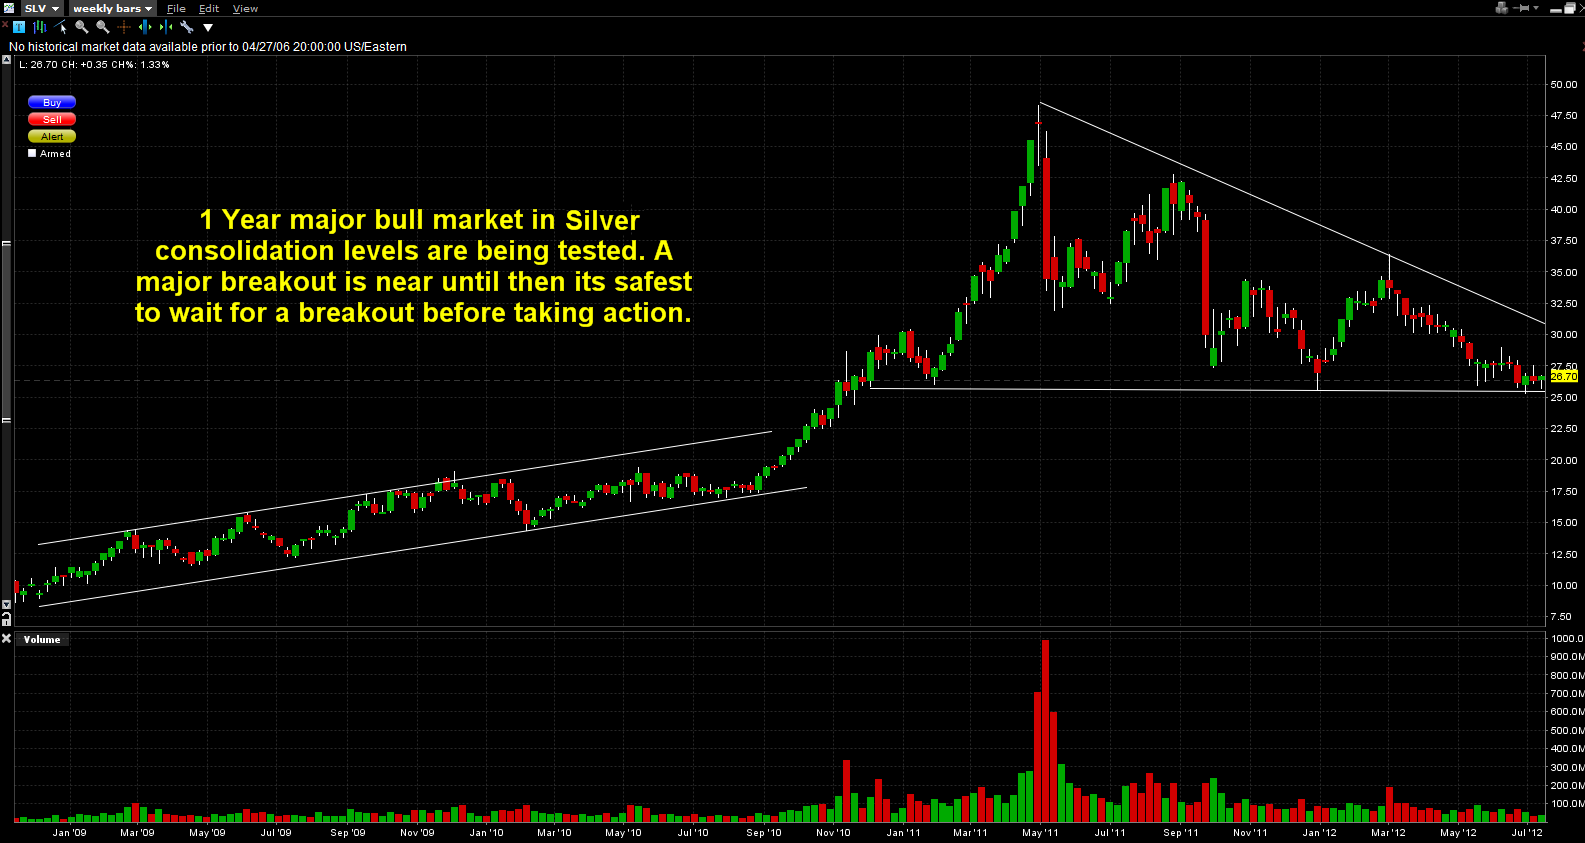
Silver, after breaking through strong resistance around $19- $20 in September 2011 went almost parabolic in spring 2011 prior to giving up most of its gains in the last year.  There seems to be significant support around $26 on SLV, however this level has been tested quite frequently over recent months and this again raises caution.  While silver owes some of its moves to its industrial application, the high correlation between the two metals is not to be ignored.

 Click Silver Chart for Full Size

I think the long-term trade will be long in both metals, but I’m waiting to see a significant breakout out of these consolidations on heavy volume to confirm a direction.  I would like to see both precious metals break out of their respective consolidations and ultimately have further confirmation in the USD.  Any major headlines over the next couple months involving Europe or quantitative easing may provide us with the trigger for the next big move.

Get My FREE gold cycles and trading analysis here: www.GoldAndOilGuy.com

Chris Vermeulen

Gold and silver have taken more of a back seat over the past 12 months because of their lack of performance after topping out in 2011. Since then prices have been trading sideways/lower with declining volume. The price action is actually very bullish from a technical standpoint. My chart analysis and forward looking forecasts show $3,000ish for gold and $90ish for silver in the next 18-24 months.

Now don’t get too excited yet as there is another point of view to ponder…

My non-technical outlook is more of a contrarian thought and worth thinking about as it may unfold and catch many gold bugs and investors off guard costing them a good chunk of their life savings. While I could write a detailed report with my thinking, analysis and possible outcomes I decided to keep it simple and to the point for you.

Bullish Case: Euro-land starts to crumble, stocks fall sharply sending money into gold and silver which are trading at these major support levels which in the past triggered multi month rallies.

Bearish Case: Greece, Spain and Italy worth through their issues over the next few months while metals bounce around or drift higher because of uncertainty. But once things have been sorted out and financial stability (of some sort) has been created and the END OF THE FINANCIAL COLLAPSE has been avoided money will no longer want to be in precious metals but rather move into risk-on.

Take a look at the gold and silver charts below for an idea of what may happen and where support levels are if we do see money start to rotate out of metals in the next 3-6 months.

Gold Forecast

Silver Forecast

Over the next few months things will slowly start to unfold and shed some light on what the next big move is likely going to happen to gold and silver.

The price movements we have seen for both gold and silver indicate were are just warming up for something really big to happen. It could be a massive parabolic rally to ridiculous new highs in 2012/2013 or it could be a huge  unwinding of the safe havens as countries sort out their issues and the big money starts moving out of metals and into currencies and stocks.

Only time will tell and that is why I analyze the market multiple times per week to stay on top of both long term and short term trends. So if you want to keep up with current trends and trades for gold, silver, oil, bonds and the stocks market checkout TGAOG at: http://www.thegoldandoilguy.com/free-preview.php

Chris Vermeulen

The past couple months investors have been focusing on the equities market. And rightly so with stocks running higher and higher. Unfortunately most money managers and hedge funds are under performing or negative for the first quarter simply because of the way prices have advanced. New money has not been able to get involved unless some serious trading rules have been bent/broken (buying into an overbought market and chasing prices higher). This type of market is when aggressive/novice traders make a killing cause they cannot do anything wrong, but 9 times out of 10 that money is given back once the market starts trading sideways or reverses.

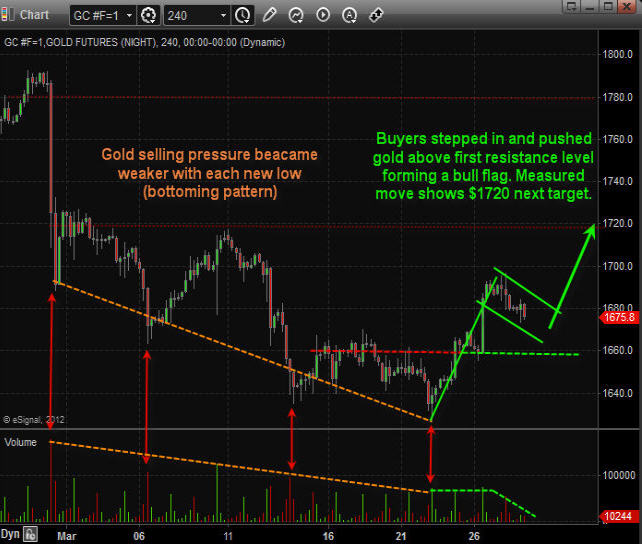
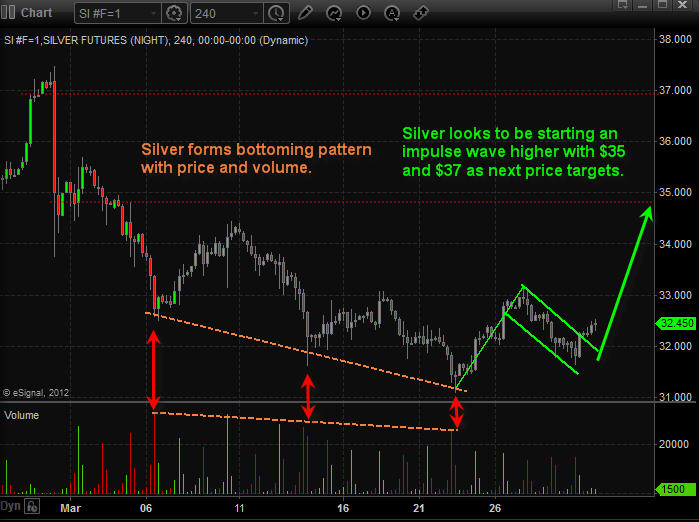
While everyone is currently focusing on stocks, its important to research areas of the market which are out of favor. The sector I like at the moment is precious metals. Gold and silver have been under pressure for several months falling out of the spot light which they once held for so long. After reviewing the charts it looks as though gold, silver and gold miner stocks are set to move higher for a few weeks or longer.

Below are the charts of gold and silver charts. Each candle stick is 4 hours allowing us to look back 1-2 months while still being able to see all the intraday price action (pivot highs, pivot lows, volume spikes and price patterns).

The 4 hour chart is one time frame most traders overlook but from my experience I find it to be the best one for spotting day trades, momentum trades and swing trades which pack a powerful and quick punch.

As you can see below with the annotated charts gold, silver and gold miner stocks are setting up for higher prices over the next 2-3 weeks. That being said we may see a couple days of weakness first before they start moving up again.

4 Hour Momentum Chart of Gold:


4 Hour Momentum Chart of Silver:


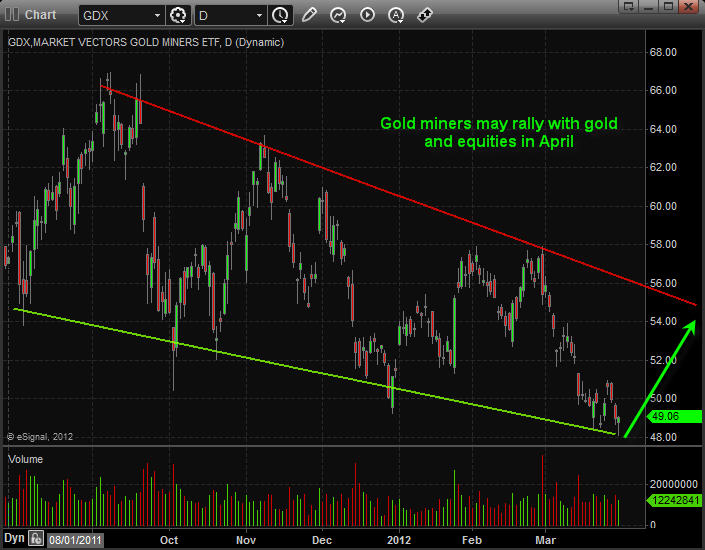
Daily Chart of Gold Miner Stocks:

Gold miner stocks have been under performing precious metals for over a year already. Looking at the daily chart we are starting to see signs that gold miner stocks could move up sharply at the trade down at support, oversold and with price/volume action signaling a possible bottom.


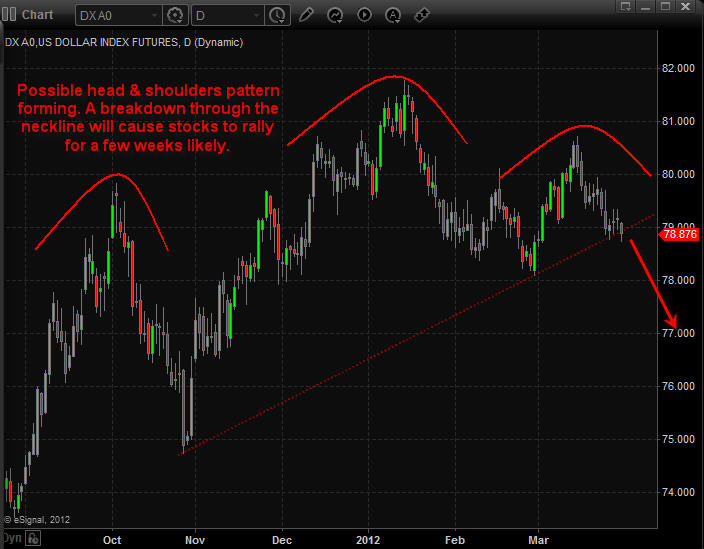
Daily Chart of US Dollar Index:

The US Dollar index has formed a possible large Head & Shoulders pattern meaning the dollar could fall sharply any day. The size of this chart pattern indicates that if the dollar breaks down below its support neckline the we should expect the dollar to fall for 2-3 weeks before finding support.
Keep in mind that a falling dollar typically means higher stock and commodity prices. If this senario plays out then we should see the market top late April which falls inline with the saying “Sell In May and Go Away”.


Precious Metals Conclusion:

Looking forward 2-3 weeks precious metals seem to be setting up for higher prices as we go into earning season and May. Overall the market is close to a top so it could be a bumpy ride as the market works on forming a top in April.

Chris Vermeulen
www.GoldAndOilGuy.com

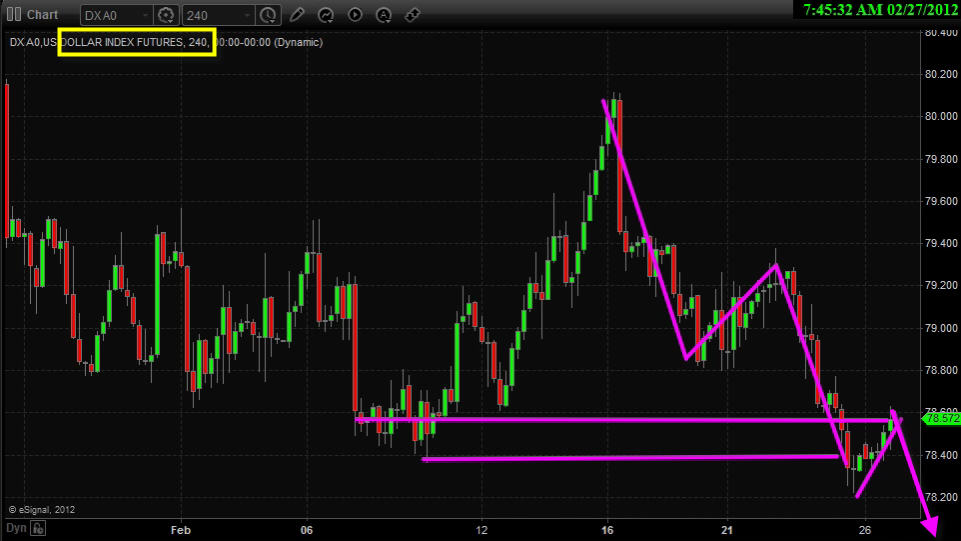
This morning we are seeing the US Dollar index move higher retesting a short term breakdown resistance level. What this means is that the dollar fell below support and is not slowing drifting back up to test the breakdown level. As we all know once a support level is broken it then becomes resistance. So if that holds true with the current move in the dollar we should see stocks and commodities find a short term bottom and continue higher today or tomorrow from the looks of things.

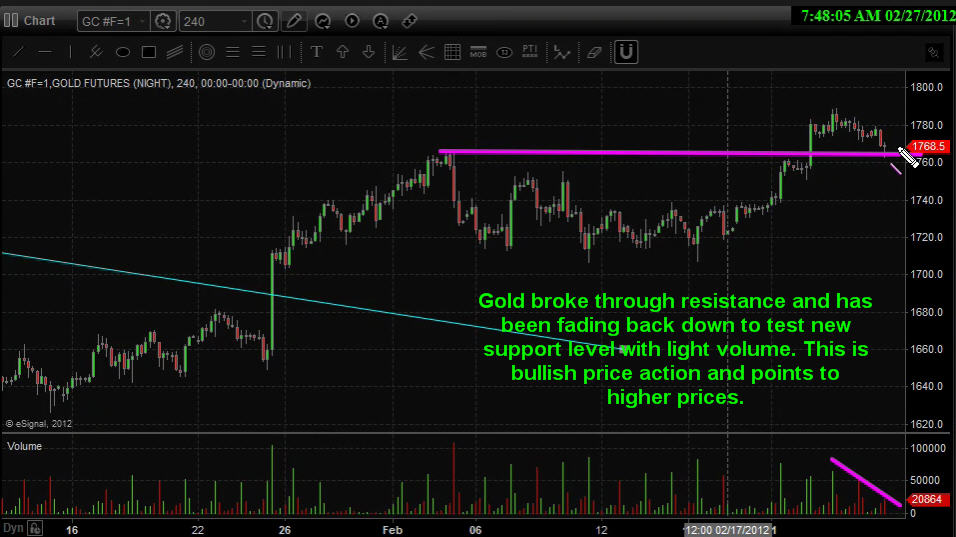
Gold has been pulling back the past couple trading session on light volume which healthy price action. It has done the opposite of what the dollar did above. Gold broke through a key resistance level and is slowly drifting back down to test the breakout level to see if it is support. If so then gold should continue higher in the coming days.


Both silver and gold miner stocks are lagging he price of gold. They have yet to break through their key resistance levels. That being said it could happen an day now as they have both been flirting with that level for a couple trading sessions now.


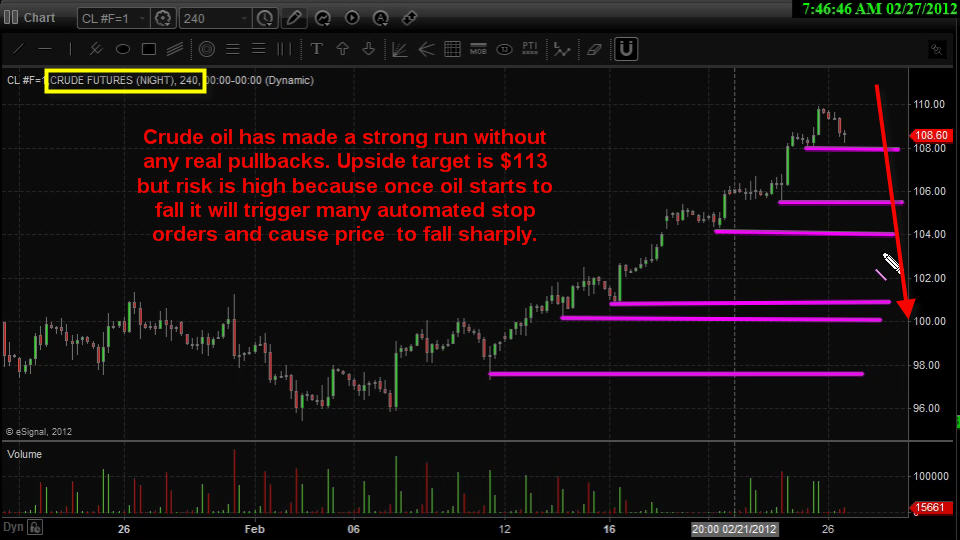
Crude oil continues to hold up strong and is headed straight for its key resistance levels without any real pullback. Chasing price action like this is not something do often because risk: reward is not in your favor. I am staying on the sidelines for oil until I see a setup that has more potential and less risk.

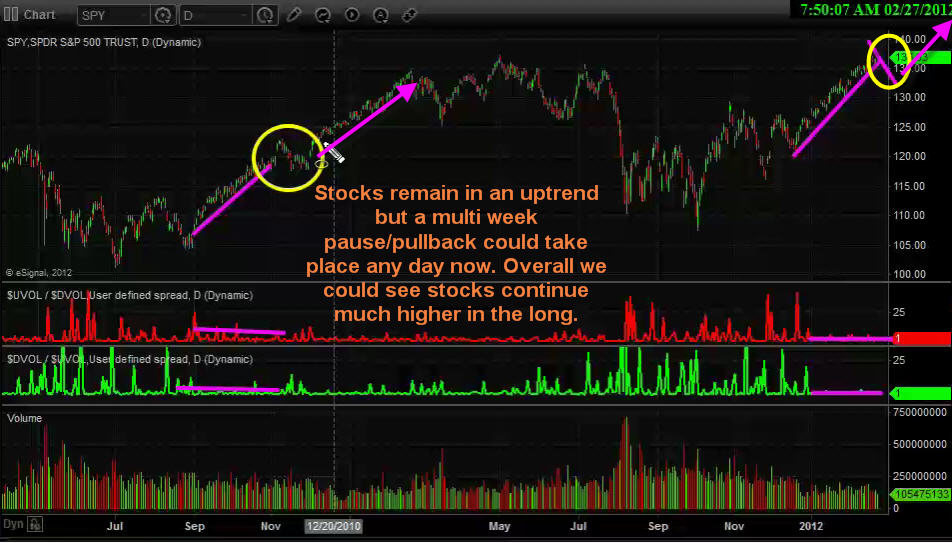
The equities market remains in a strong uptrend at this time. I do feel a 1-3 weeks pause/pullback could take place at any time but in the grand scheme of things we could be only half way through this runaway stock market rally as noted in the video.

The equities market is going to gap down this morning which is typical in a bull market. Remember. in an uptrend the stock market tends to gap lower at the open and close higher into the close. And it’s the opposite in a down trend with stocks gapping higher and sell off through the trading session.

Watch my detailed video analysis for this week: http://www.thetechnicaltraders.com/ETF-trading-videos/

Chris Vermeulen
www.TheGoldAndOilGuy.com

The stock markets had a very solid session. Most charts shot higher after Apple beat estimates Tuesday night surging over 10%. This set the tone for stocks Wednesday. Also the FOMC said they would keep interest rates low until mid 2014 and projected a 2% inflation rate which took the market by surprise. Looking at the 10 minute intraday charts of gold, silver, oil, and the SP500 you would think it was the 4rth of July with everything shooting higher.

My gut feeling before the FOMC meeting was that there would be no QE3 announced. This I figured would trigger the dollar to rise which in turn would put pressure on stocks and commodities. But the low interest rates until mid 2014 was the wild card trumping that scenario.

Trading around FOMC meetings always brings a heightened level of uncertainty to traders and investors. The news is unpredictable making that much more of beast to try and out smart. I personally do not trade on any news because of the added risk involved.

Let’s take a quick look at gold and silver…

The Weekly Gold Chart:

Gold has started to break out of its down trend and if it can hold up into Friday’s close then it will be a very positive sign for the shiny metal. It is still mid week and a lot can happen, so let’s see how it holds up and go from there.


The Weekly Silver Chart:

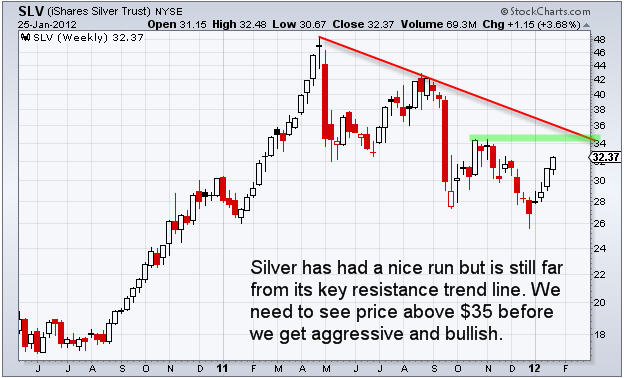
Silver has some work to do before it’s back in an uptrend on the weekly chart. I would not be surprised to see it catch up with gold and run toward the $35 resistance level in the next couple days.


Mid-Week Trend Conclusion:

In short, gold is on the move and in the next few weeks I figure we will be getting involved. Silver I think will unfold a little different from a chart pattern point of view, but I do feel there will be a buying opportunity soon also.

Looking more broad based we are seeing the stock market continue to make new highs with solid volume behind it while Crude oil continues to tread water.

Get my free weekly reports and videos here: www.GoldAndOilGuy.com

Chris Vermeulen
The past few months have been tough for those holding precious metals stocks, PM futures contracts or physical bullion. With silver is trading down 41%, precious metals stocks down 30% and gold 15%. It has people scratching their head.

The question everyone keeps asking is when can I buy gold and silver?

Unfortunately that is not a simple answer. With what is unfolding across the pond and the bullish outlook for the US Dollar index the next move is a coin toss. That being said, I do feel a large move brewing in the market place so I am preparing for fireworks in the first quarter of 2012.

If you step back and look at the weekly trend charts of the dollar index and the SP500 index you will see the strength in the dollar along with a possible top in equities forming. What these charts are telling is that in the next 3 months we should know if stocks and commodities are going to start another multi-month rally or roll over and start a bear market sell off.

With the holiday season nearing, hedge fund managers sitting on the sidelines just waiting for their year end performance bonuses, I cannot see any large sell off start until January. Sell offs in the market require strong volume and the second half of December is not a time of heavy trading volume.

This leaves us with a light volume holiday season, major issues overseas and no big money players willing to cause waves.

So let’s take a quick look at the charts as to where the line in the sand it for the dollar index, gold and silver.

Dollar Index Daily Chart

This week we have seen a strong shift of money out of risk on assets (Bonds) and into risk off (Stocks). This shift is happening before the dollar has broken down indicating the dollar may be topping and could be an early warning of higher stocks prices going into year end. Also note that light volume market conditions also favour higher prices.


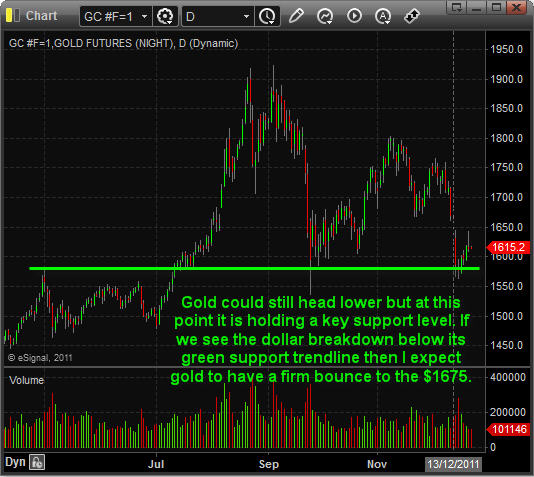
Gold Price Daily Chart

Gold could still head lower but at this point it is holding a key support level. If we see the dollar breakdown below its green support trendline then I expect gold to have a firm bounce to the $1675 – $1700.


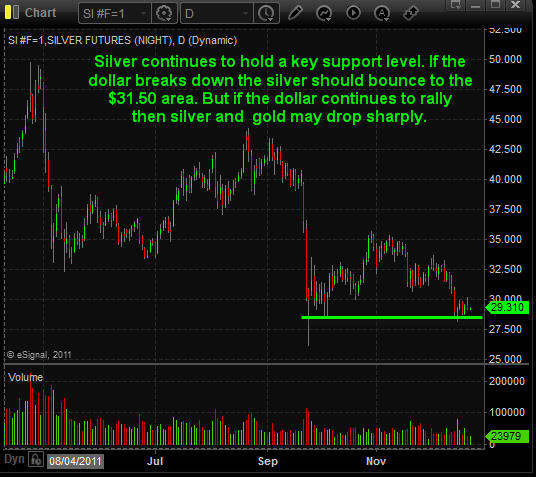
Silver Price Daily Chart

Silver continues to hold a key support level. If the dollar breaks down the silver should bounce to the $31.50 – $32 area. But if the dollar continues to rally then silver and gold may drop sharply.


Mid-Week Trend Conclusion:

In short, I think the best thing to do is enjoy the holiday season with family and friends. Trading right now is not that great and with the market giving mixed signals. I am keeping my eyes on the market in case it flashes a low risk setup and I will keep you informed if we get one.

I am still bearish on gold and silver longer term but the next week or so its likely we see higher prices.

Be aware that Monday is a holiday and once January arrives the market could go crazy again. If you want all my swing trades that I personally do be sure to join my alert service www.TheGoldAndOilGuy.com

Happy Holidays to you and your loved ones!

Cheers,
Chris Vermeulen

I think you will admit that we are in the middle of one major crazy financial mess.  The part that makes things really crazy is that it’s not just in the United States anymore but rather serious global problem which if not handled properly could change the way we live our lives going forward or possibly even spark some type of war, hopefully things don’t get that crazy… But I do know one thing. Fear is the most powerful force on the planet and people do some crazy things when they are backed into a corner.

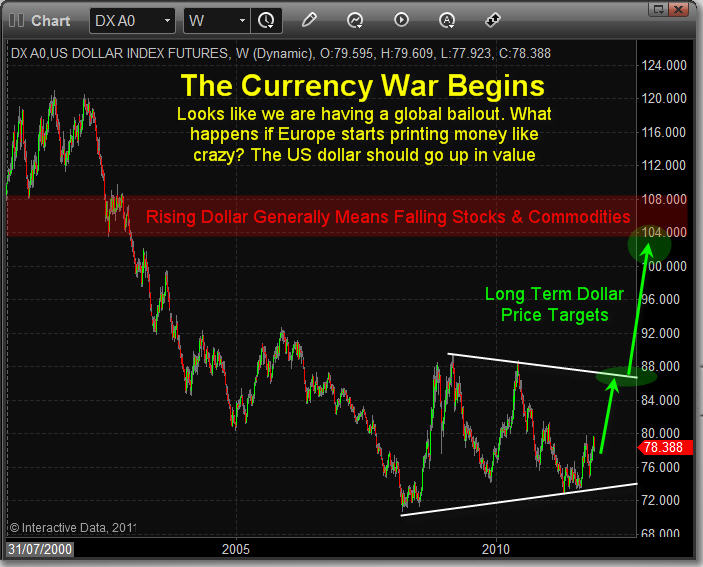
Anyways, on a more positive tone… today China decided to help provide more liquidity for the financial system along with the central banks. This news triggered a monster rally in overnight trading making the market gap up sharply at the opening bell. This news did hit the US dollar index hard sending it sharply lower but the question remains “Will today’s news be a one week hiccup in the market?” If Euroland starts printing money it will likely send the dollar higher and stocks lower for 6- 12 months.

Just today I was joking with Kerry Lutz of the Financial Survivor Network about how each country should just give each other country a second chance. Wipe the dept clean and start over knowing this time around exactly how each country truly operates at a financial level allowing everyone to avoid a repeat of this BS. Some countries will get off way better than others because they would get so much dept wiped clean but isn’t it better than years of problems and possibly wars over food, gold, guns, oil and Canadian water? – EH

All joking aside, let’s take a look at the weekly long term charts…

Dollar Index Showing Possible Massive Rally If Euro Starts Printing Money:

I’m sure my off the cuff options/thoughts will cause a stir but I am fine with that. Everyone I talk to is thinking the dollar is about to fall off a cliff while I think it’s very possible that it does just the opposite. Either way I will be looking to benefit from which ever move unfolds.

Weekly Gold Chart:


Weekly Silver Chart:


Weekly SP500 Chart:


Long Term Thoughts:

I would first like to say that tonight’s report is out of my norm. Generally I do not focus on the big picture negative stuff and I like to avoid it for a few reasons… One, it’s just downright depressing to talk and think about. And Second I don’t want to be labelled as one of those “The Sky Is Falling” kinds of guys.

So, that being said I think these charts above show a situation what is very possible to happen in the coming 6-12 months. Keep in mind that my focus is on short term time frames as it allows me to avoid and actually profit from major market moves while providing enough information for my followers to learn technical analysis and trade management. And the obvious idea of not looking too far into the future with a negative outlook…

With headline risk changing the market direction on a weekly basis, this negative outlook could easily change in a couple months. I will recap on the big picture as things unfold in January/February.

Get these Free Weekly Reports EVERY WEEK

In May of 2010, immediately following the flash crash many investors started to become bearish (nervous) regarding their position in gold and equities. Once the general public became aware that the stock market could fall 10% in a matter of minutes, investors became very cautious. Suddenly protecting their capital and current positions was at the forefront of their investment process.

A couple days later the market recovered most of its value, but it became clear that investors were going to sell their long positions if the market showed signs of weakness. It was this fear which pulled the market back down to the May lows and beyond over the next couple months which caused investors to panic and sell the majority of their positions. It is this strong wave of panic selling that triggers gold and stock prices to form intermediate bottoms. Emotional retail traders always seem to buy near the top and sell at the bottom which leads to further pain.

Now, fast forward to today…

This past August we saw another selloff similar to the “Flash Crash” in May of 2010. (I warned followers that gold was on the edge of topping and that stocks would take some time for form a base and bottom – Click Here To Read) Over the past couple months gold, silver, and stocks have been trying to bottom but have yet to do so.

Just a couple weeks ago we saw gold, silver, and equities make new multi-month lows. This has created a very negative outlook among investors which I highlighted in red on the chart below. Since the panic selling low was formed just recently we have seen money pile back into gold and stocks (more so stocks).

This strong bounce or rally which ever you would like to call it may be the beginning stages of a major bull leg higher which could last several months. Before that could happen, I am anticipating a market pullback which is highlighted with red arrows on the chart below.

Chart of SP500, Gold and Dollar Index Looking Back 18 Months


Reasons for gold and stocks to pullback:

  • Stocks are overbought and generally retracements of 50% or 61% are common following large rallies.
  • The dollar index looks ready to bounce which typically means lower gold and stock prices.
  • Gold continues to hold a bearish chart pattern pointing to lower prices still.

Weekly Trend Trading Ideas

A few weeks ago I warned my followers that stocks and gold are forming a bottom and that we should be on the lookout for further confirmation signs. I also mentioned that I was not trying to pick a bottom, rather that I was looking to go long once the odds were more in my favor.

This is a potentially very large opportunity unfolding and there will be several different ways to play this. However, right now I continue to wait for more confirming indicators and for more time to pass before getting subscribers and my own money involved.

From August until now (October 17) the SP500 is down -6.3% and gold is down -8.1%. Subscribers of my newsletter have pocketed over 35% in total gains using my simple low risk ETF trading alerts.

I can email you my bi-weekly reports and videos by joining my free newsletter here: www.GoldAndOilGuy.com

Chris Vermeulen
Over the past year we have been learning more about the financial situations across the pond in Europe. With international issues on the rise, investors are panicking trying to find a safest haven for their capital. This money has been bouncing from one investment to another trying to avoid the next major crash in stocks, bonds, currencies and commodities. It seems every 6 months there is a new headline news issue at hand forcing the smart money to withdraw from one investment class too another hoping to avoid the next meltdown.

To make a long story short, I feel the market (stocks, bonds, currencies and commodities) are about to see another major shift that will either make you a boat load of money or you lose a lot of money if you are not positioned properly.

So the big question is “Which direction will these investments move?”

Let’s take a look at the charts…

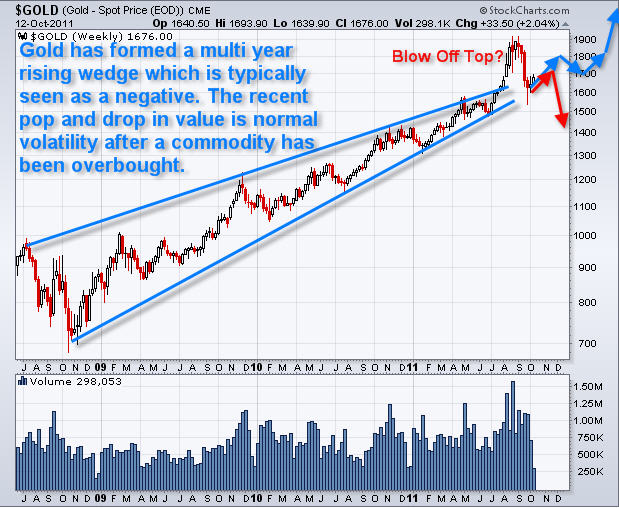
Gold Weekly Chart – Long Term Outlook

Gold has just finished seeing a strong wave of selling this summer so it’s early to give any real forecast for what is next. That being said this long term chart may be telling us that gold’s rally could be nearing an end or a 12+ month pause could take place. If you have followed the market long enough then you realize that when everyone is in the same trade/position the market has a way of re-distributing the wealth to those who are savvy investors. Over the next 4-6 weeks there should be more price action which will allow me to get a better read for what is going to happen next.

Gold ETF Trading Newsletter


Silver Weekly Chart – Long Term Outlook

Silver has been showing strong signs of distribution selling. Meaning the big money is moving out of this industrial and highly speculative metal. The interesting part here is that silver topped out much sooner than gold. Many times in the past silver has topped and or bottomed before the rest of the market reverses direction. So it is important to keep an eye on silver as we go forward in time because it tends to lead the market 1-2 months in advance some times.

Silver ETF Trading Newsletter


SP500 Weekly Chart – Long Term Outlook

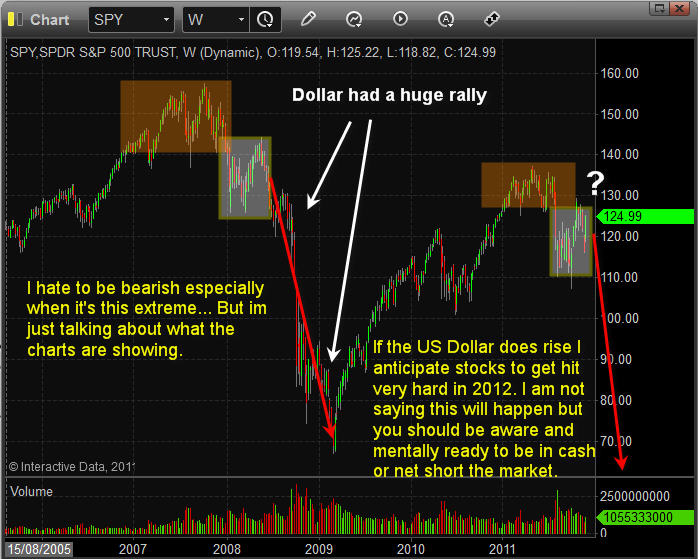
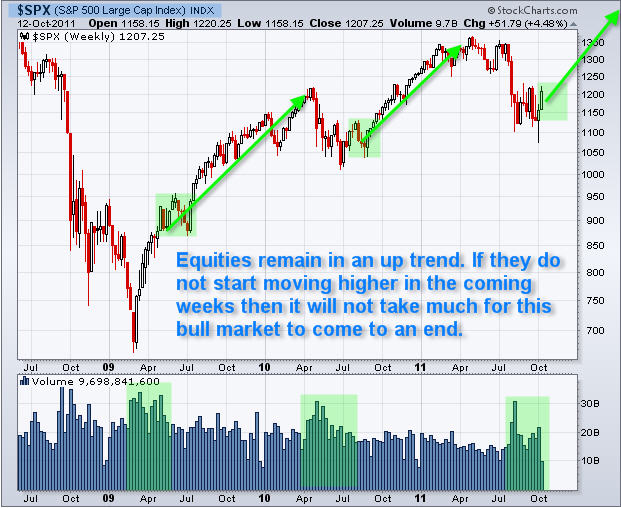
Stocks in general are still looking ripe for another major bull market rally. But if we do not get some follow through in the coming 1-2 months then this almost 3 year bull market could be coming an end.

SPY ETF Trading Newsletter


Mid-Week Trend Trading Conclusion:

In short, the market as a whole is trying to recover from a strong bout of selling over the past few months. In my opinion the market is ripe for another leg higher. The reason I see higher stock prices is because decisions are being made across the pond to deal with their issues. Looking back it is similar to what the United States did in late 2008 – early 2009 just before the market bottomed.

Everyone right now seems to be saying Europe is screwed and that they are going about things in the wrong way, but if you think back that is exactly what took place in America not that long ago. And back then it was all over the news that the resolutions to fix the US would not work…. In the end, life continued, businesses continued to operate. Soon after decisions were made the stock market and commodities rallied and are still holding strong today.

Over the next week or two I am anticipating the market will provide some solid trade setups which I plan on taking advantage of using leveraged ETFS. During the volatile sideways market in August through till now I have navigated my subscribers using both bull and bear funds pocketing over 35% return in two months. If you would like to receive my pre-market morning videos, intraday updates and trade alerts visit my newsletter at: http://www.thegoldandoilguy.com/trade-money-emotions.php

Chris Vermeulen

It seems everyone is looking for a place to put their hard earned money as uncertainty around the globe continues to rise. Oil, Gold, and Silver which have been the hot investments for the past few years took it on the chin over the past month with oil falling 13%, gold dropping 15%, and silver with a whopping 30% decline. We did actually see sharply lower prices, but last week these oversold commodities had a bounce and recouped some of their losses.

It has been a month since I covered the dollar index in detail and back on August 31st I pointed to a potentially large shift in the US dollar. The charts were pointing to a sizable rally which would likely send stocks and all commodities crashing lower. Since then we have seen just that and the so called safe havens (Gold, Silver, Oil) have dropped taking most investment and retirement accounts down with them. I did talk about these so called safe havens a couple weeks back stating my point of view on them.

My Cole’s Note Summary: “I do not consider any investment vehicle a safe haven if it can drop 15% in value within 1-2 days. And I would never put a large position of my account especially a retirement account into these investments if I were over 50 yrs of age.”

So where are the big, smart, and conservative traders putting their money to work?

Let’s dig down and take a quick look at the charts…

The 20 Year Bond – Daily Chart:

US Dollar – Daily Chart:


Utility Sector (Dividend Paying Stocks) – Daily Chart:


Weekend Trading Conclusion:

In short, I feel both stocks and commodities are oversold but need more time to bottom and we may see a few more days of lower prices in the near future. I see the dollar starting to get toppy on the daily chart and once that rolls over then stocks should bottom along with gold, silver, and oil.

Once equity prices start to bounce I anticipate money to flow out of the safe haven (Bonds) and into stocks where there are much larger potential gains to be had. All this could play out in a couple days so I am keeping a very close eye on everything.

Last week we bought the inverse SP500 etf (SDS) anticipating another surge higher in the dollar which would send stocks down in value. So far we are sitting with a gain of 8.2% and the potential for another 4 – 10% if things play out as I expect. If you would like to receive my daily pre-market trading videos so you know exactly what to expect each session along with my ETF trades be sure to join my free newsletter and get my free book here: http://www.thegoldandoilguy.com/trade-money-emotions.php

Chris Vermeulen
Get these articles, reports and videos directly and instantly on your website using the Best Financial RSS Feed