Special Swing Trading Report on Gold, Silver & Oil – CLICK HERE

PRECIOUS METALS

February gold closed higher on Friday as it consolidated some of this week’s decline. The mid-range close sets the stage for a steady opening on Monday. Stochastics and the RSI remain bearish signaling that sideways to lower prices are possible near-term. If February extends this week’s decline, trendline support drawn off the November-December lows crossing near 804.60 is the next downside target. Closes above the 10-day moving average crossing at 865.50 would signal that a low has been posted. First resistance is last Monday’s high crossing at 892.00. Second resistance is October’s high crossing at 938.80. First
support is Wednesday’s low crossing at 836.00. Second support is trading line support crossing near 804.60.

March silver closed higher on Friday due to short covering as it consolidates above the 10-day moving average. The mid-range close sets the stage for a steady opening on Monday. Stochastics and the RSI are neutral to bearish signaling that a short-term top might be in or is near. Closes below the 20-day moving average crossing at 10.908 are needed to confirm that a short-term top has been posted. If March extends the rally off October’s low, the reaction high crossing at 12.230 is the next upside target. First resistance is Monday’s high crossing at 11.770. Second resistance is the reaction high crossing at 12.230. First support is the 20-day moving average crossing at 10.908. Second support is Monday’s low crossing at 10.570. 

ENERGY MARKET
February crude oil closed lower on Friday as it extended Thursday’s breakout below the 10-day moving average crossing at 42.98. Today’s low-range close sets the stage for a steady opening on Monday. The door is open for additional weakness and a possible test of last week’s low. Closes below last Wednesday’s low crossing at 36.94 would temper the near-term friendly outlook in the market. Stochastics and the RSI have turned bearish signaling that sideways to lower prices are possible near-term. If February renews the rally off December’s low, the reaction high crossing at 52.95 is the next upside target. First resistance is the 20-day moving average crossing at 43.34. Second resistance is Tuesday’s high crossing at 50.47. First support is today’s low crossing at 39.38. Second support is last Wednesday’s low crossing at 36.94.

PRECIOUS METALS 

February gold closed higher on Tuesday due to short covering as it consolidated some of Monday’s decline. The high-range close sets the stage for a steady to higher opening on Wednesday. Despite today’s rebound, stochastics and the RSI have turned bearish signaling that a short-term top might be in or is near. Closes below the 20-day moving average crossing at 844.10 are needed to confirm that a top has been posted. If February extends this fall’s rally, October’s high crossing at 938.80 is the next upside target. First sesistance is last Monday’s high crossing at 892.00. Second resistance is October’s high crossing at 938.80. First support is the 20-day moving average crossing at 844.10. Second support is today’s low crossing at 838.80.

March silver posted an inside day with a higher close on Tuesday as it consolidates some of Monday’s decline. The high-range close sets the stage for a steady to higher opening on Wednesday. Stochastics and the RSI are bullish signaling that sideways to higher prices are possible near-term. If March extends the rally off October’s low, the reaction high crossing at 12.230 is the next upside target. Closes below the 20-day moving average crossing at 10.735 are needed to confirm that a short-term top has been posted. First resistance is Monday’s high crossing at 11.770. Second resistance is the reaction high crossing at 12.230.
First support is the 10-day moving average crossing at 10.930. Second support is the 20-day moving average crossing at
10.735. 

ENERGY MARKETS 

February crude oil closed slightly lower on Tuesday due to light profit taking as it consolidated some of the rally off December’s low. Today’s mid-range close sets the stage for a steady opening on Wednesday. Stochastics and the RSI remain bullish signaling that sideways to higher prices are possible near-term. If February extends this month’s rally, the reaction high crossing at 52.95 is the next upside target. Closes above the reaction high crossing at 52.95 are needed to confirm that a short-term low has been posted. Closes below last Wednesday’s low crossing at 36.94 would temper the near-term friendly outlook in
the market. First resistance is today’s high crossing at 50.47. Second resistance is the reaction high crossing at 52.95. First support is the 20-day moving average crossing at 43.96. Second support is the 10-day moving average crossing at 41.94.

Click Here to Read My Special Report: http://www.thegoldandoilguy.com/goldandoilnewsletterjan2.php 

Chris Vermeulen

Stock charts analysis is something that most advanced traders and investors know something about but ordinary brokers and financial advisors don’t even look at.

Most individuals use local broker, financial advisor, friend or family member to help with stock investments but generally these people do not use stock chart analysis to see if the stock is in a trend which can provide acceptable returns if they enter the position at the right time.

Over the years I have helped several traders and investors time their entry and exit points for stocks within their portfolio. Not only do I help individuals time their positions but I provide them with a feel for what the market is doing and that allows you to relax and enjoy playing the market. This is a new service which I now call Investment Consulting.

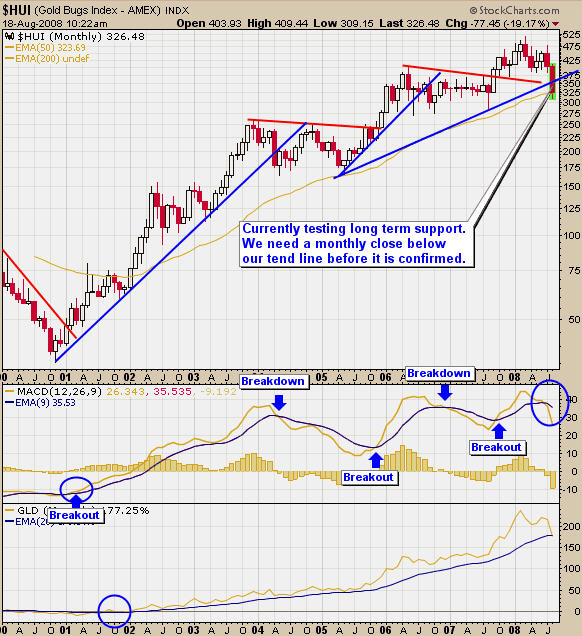
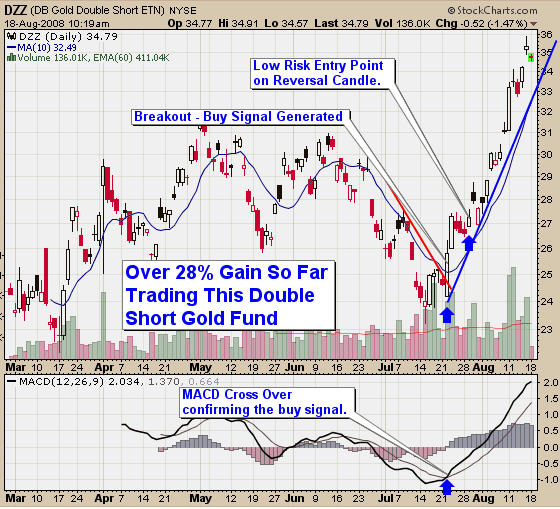
This is a sample of what a basic chart looks like and the opportunities that become visual once stock chart analysis is applied.

Long Term Trend – Stock Chart Analysis

Stock Chart Analysis

Stock Chart Analysis

Short Term Trend – Stock Chart Analysis

Stock Chart Analysis - Investment Consulting Chart

Stock Chart Analysis - Investment Consulting Chart

I will personally review YOUR current portfolio stocks providing Technical Analysis on each stock so YOU know where your investments are headed and tips to maximize your returns.

Benefits of Stock Chart Analysis:
– Find out where your portfolio is headed
– Find out which investments are holding you back
– Know when to take profits or sell
– Reduce YOUR investment stress levels

You get my Full Report sent to YOU by email, including:

* Multiple Time frame charts for each stock
* Detailed Charts with support and resistance zones
* Long and short term Trend directions
* Protective Stops for locking in profit
* Buy,Sell and profit taking zones

Now YOU can get detailed, personalized assistance from one of North America’s leading stock chart analysis investment consultants. This is the PLAN you NEED to SUCCEED!

NOW is YOUR Opportunity to start trading like an advanced trader. Let me help you get started at http://www.thegoldandoilguy.com/investment-consulting-stock-chart-analysis.php

To Your Financial Success,

Chris Vermeulen
The Gold and Oil Guy
chris@thegoldandoilguy.com