It’s that time again when volume dries up and prices rise into the new year. A lot of individuals are scrambling to prepare for the holidays, even though we had a year to prepare. The big money has already done most of their year end shuffling and will be taking it easy until January.

The market is overbought and sentiment readings are at extreme levels which in the past have been the start of large sell offs and even bear markets. While I am keeping a close eye for a top, there is not much we can do but stay long stocks and commodities until the market tips its hand and distribution selling is in control. The U.S. federal government is the only wild card going into year end that should be on traders’ radars. They have been doing a great job boosting prices in the equities and commodities market, but can they continue to hold things up when the big money and the proverbial herd start unloading positions in 2011?

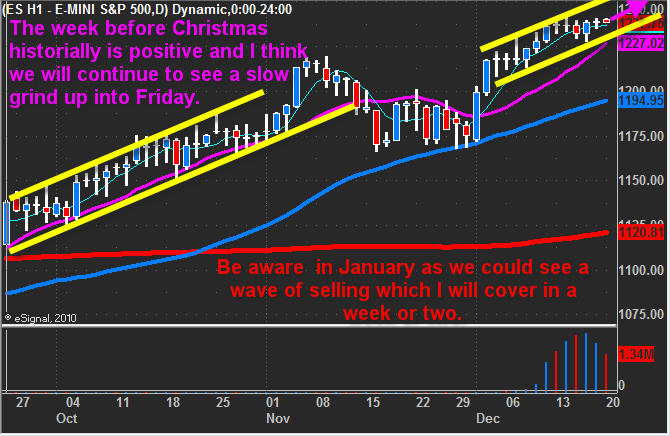
SP500 Holiday Grind – Daily Chart
This chart shows the slow and steady grind higher that we have seen in the S&P 500. I expect this to continue into 2011 The market in my opinion is on the verge of some serious selling so long positions should be small going forward.

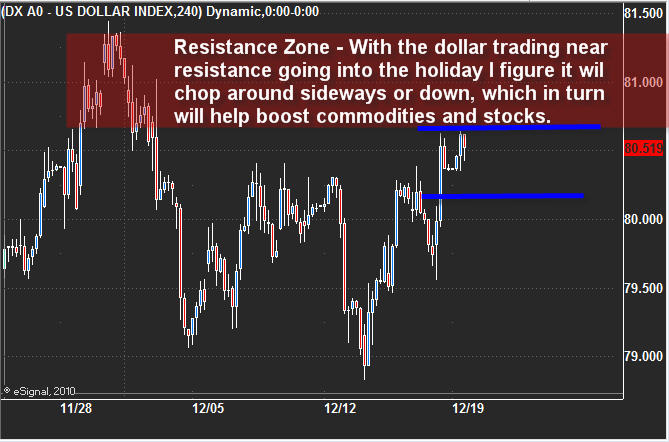
US Dollar On Pause For A Couple of Weeks
This 4 hour candle stick chart of the dollar shows price testing resistance (a previous high). I am expecting to see the U.S. Dollar trade sideways or possibly move closer to the previous high as we enter the new year. A sideways dollar will allow the equity and commodity markets to rise.

Weekend Conclusion:
In short, I think we could see an intraday pullback early this week and then a grind higher. The pullback would shake out some weak positions before the holiday march higher takes place. I typically don’t trade much going into the holiday season and new year. I may put on a small long position if I like what I see forming on the charts, but that would likely be about it. Light volume can be very dangerous to trade because sharp price spikes up or down can occur in a blink of an eye catching traders off guard.

If you would like to learn more about trading while getting trade alerts for ETFs join my newsletter at: http://www.TheGoldAndOilGuy.com

Chris Vermeulen

The past week has been interesting to say the least. Gold is trying to find support while the SP500 grinds its way higher. Let’s jump into the charts and analysis to get better feel for what I feel is happening here.

Gold 4 Hour Chart
As you can see from the chart below gold has formed a possible double top. The fact that it made a higher high is actually a bearish sign for the intermediate term 1-3 weeks. When we see a higher high getting sold into with big volume it typically means the big money is unloading large positions into the surge of breakout traders and short covering that occurs when a new high is reached. Following the big money is very important to keep an eye on as it can warn us of possible trend changes before it occurs.

The current selling volume is not exactly a healthy sign if you are looking for higher prices in the near term. If this pattern breaks down I would expect $1340 to be reached very quickly.

Keep in mind gold it in a strong up trend still. Shorting is not the best play in my opinion. I prefer to see pullback which washes the market of weak positions then jump on the long side for another bounce/rally.

SP500 Market Internal Strength – 10min, 3 days chart
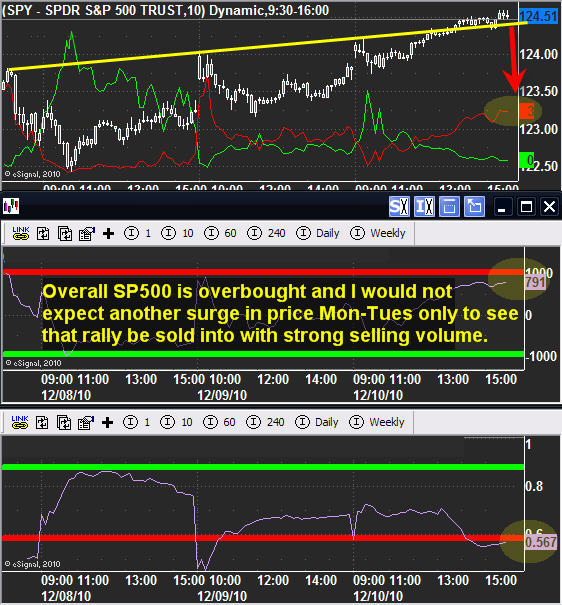
I watch these charts to get a feel for the overall market strength on a short term basis. The top chart shows the SPY etf breaking above a resistance trend line on Friday afternoon. This occurred on light volume meaning it is mostly likely a false breakout and Monday we could see a gap lower at the open or a pop & drop. The two other indicators are reaching an extreme level which normally tells us a pullback is due in the next 24-48 hours of trading. The question is, will us just be a bull market pause or will we get a decent pullback.

The red indicator in the top chart and the red indicator levels on the charts below that help us time the market as to when profits should be taken or to tighten our stops if we have any long positions.

The broad market is still in a very strong uptrend so moving stops up and buying on oversold dips is the way to play it.

Weekend Market Analysis Conclusion:
In short, both gold and the stock market are in a bull market (uptrend). Trying to pick a top to short the market is not a good idea. Instead I am looking for an extreme oversold condition to help reduce downside risk before taking a long position.

The overall strength of the market (SP500 and Gold) I think are starting to weaken but in no way am I going to short them. We continue to buy dips until proven wrong because indicators can stay in the extreme overbought levels for a long period of time. Generally the biggest moves happen in the last 10-20% of the trend.

If you would like to get these weekly reports and my trading tips book free be sure to visit my website: www.thegoldandoilguy.com/trade-money-emotions.php

Chris Vermeulen

Over the past 2 weeks we have seen the market sentiment change three times from extreme bullish to bearish and back to bullish as of today. Normally we don’t see the herd (average Joe) switch trading directions this quickly. Over the past 10 years I found that the average time for the herd to reach an extreme bullish or bearish bias takes between 4-6 weeks in length. It is this herd mentality which makes for some excellent trend trading opportunities. But with the quantitative easing, thinner traded market, and lack of trading participants (smaller herd) I find everyone is ready to change directions at the drop of a hat.

The old school traders/investors who don’t use real-time data or charts, and who dabbled in stock picks, and options trades here and there have mostly exited the trading arena from frustration or losing to much money. This group accounted for a decent chuck of liquidity in the market and was also the slowest of the herd to change directions.

The new school, today’s smaller herd is much more aggressive and quicker to act on market gyrations. I think this is because the only people left in the market are those who make a living pulling money from the market and those who feel they are really close to mastering the stock market. It is these individuals who are using trading platforms with real-time data, charts and scanners to help get a pulse on the market so they can change directions when the big boys do. I feel this is the reason why the market is able to turn on a dime one week to another over the past 8 months… The easy prey (novice and delayed data traders) are few and far between and the fight to take money for other educated traders seems to be getting a little more interesting to say the least.

Anyways, enough about the herd already…

It’s been an interesting week thus far with stocks and commodities. The week started with a large gap up only for strong selling volume to step in and reverse direction the following day. It is this negative price action that starts to put fear into the market triggering a downward thrust in the market. During an up trend which we are in now, I look for these bearish chart patterns to form as they tend to trigger more selling the following days which cleanses the market of weak positions. Once a certain level of traders have been shaken out of their positions and are entering positions in order to take advantage of a falling market, that’s when we get the next rally, catching the majority of traders off guard as they panic to buy back their short positions. It’s this short covering which sparks a strong multi day rally and kicks off the new leg up in the market.

Currently we getting some mixed signals. The market sentiment is the most bullish it has been since 2007, just a little higher than the Jan & March highs this year. This makes me step back and think twice about taking any sizable long positions. Any day now the market could roll over. Another bearish signal is the fact that we just had a very strong reversal day for stocks and metals to the down side. That typically leads to more selling.

But if we look at the positive side of things, the trend is still up, this is typically a strong time for stocks as we go into Christmas/Holiday season, also the market breadth is really strong with the number of stocks hitting new highs has really taking off.

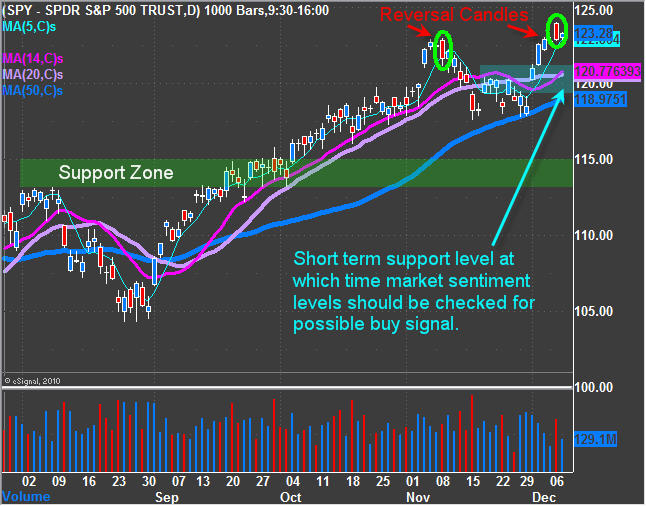
SP500 – Daily Chart

Below you can see the reversal candles along with short term and intermediate support levels. Although the market sentiment is screaming a correction is near, we must realize that sentiment can remain at this level for an extended period of time while the market continues to trend. This is one of the reasons why we say “The Trend Is Our Friend”.

I am hoping for a pullback and would like to see market sentiment shift enough on an intraday basis to give us a low risk entry point.

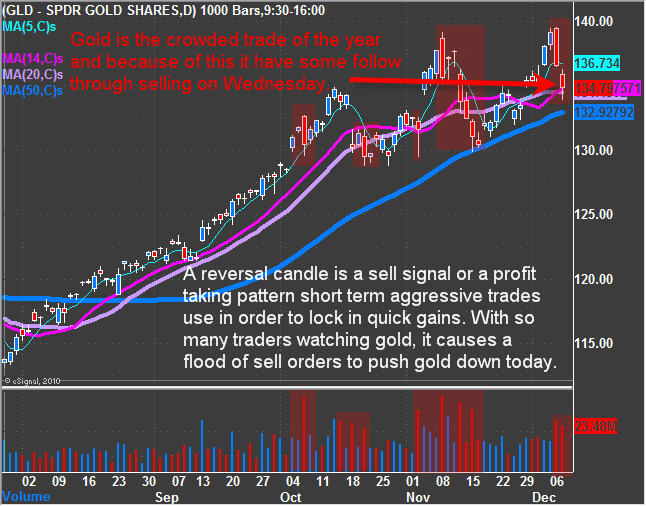
Gold – Daily Chart

A reversal candle is seen as a sell signal or a profit taking pattern. Short term aggressive trades use these to lock in quick price movements. With so many traders watching gold, it caused a flood of sell orders to push gold down today.

Mid-Week Conclusion:

In short, each time we see some decent selling in the market its get bought back up. Today was another perfect example as we had an early morning sell off, then a light volume rally for the second half of the session and a end of day short squeeze during the last 30 minutes. Gold has pulled back to the first short term support level. Because of the large following in gold I would like to see if there will be another day of follow through selling before possibly looking to take a trade.

If you would like to get my daily pre-market trading videos, intraday updates, chart analysis and trades just subscribe to my trading service here: www.TheGoldAndOilGuy.com

Chris Vermeulen
Last week we had typical pre-holiday light volume trading going into US Thanksgiving. The previous week I warned every one to trade with extreme caution because of the light volume and the fact that the market is on the verge of a sizable drop for both stocks and commodities. Any price action could not be taken seriously because of the light volume. We will not know until later this coming week what the big money wants to do… Buy or Sell, also what the manipulators will do… Seems like there are a lot of wild cards out there with Europe issues and both unemployment and payroll numbers out on Friday morning.

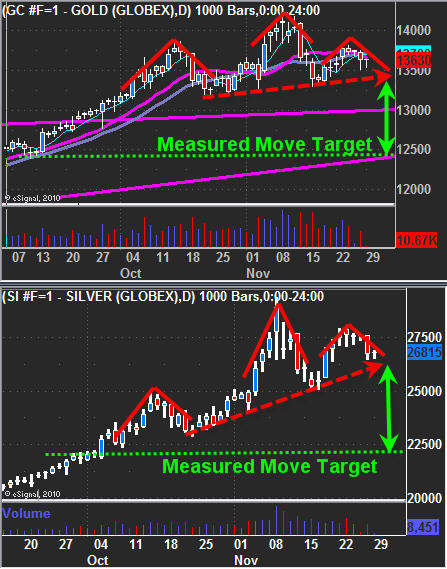
Below are a few charts showing my intermediate term outlook for gold and silver.

Gold & Silver Futures – Daily Chart
You can see both metal are showing a possible reversal head and shoulders pattern. While they have yet to confirm and close below the neck line we must be aware of this pattern and the risk/potential it provides us with. Both metals are still in an uptrend but showing signs of weakness.

US Dollar Index – Weekly Chart
This chart is not really that helpful for trading stocks, commodities or options right now but I wanted to post it because it allows me to show you how I analyze the market and my trades.

As you can see, the past 3 weeks have been in a strong uptrend reaching the first resistance level. The point of this chart is to show you that if you step out to the next longer time frame you can get a solid feeling of where an investment will find major support and resistance levels. Any investment not matter if it’s a stock, commodity or currency, if the price is trading in the middle of a large range like this chart you should not be taking large positions because it almost becomes a 50/50 bet on the market which is not a good winning strategy unless you are very experienced at managing your trades and money.

If you are going to trade then you want to focus on the underlying trend and you do that by looking at the next larger time frame. For example: if you focus on trading the daily chart, then you must step back each week and review the weekly chart to be sure you are trading with the underlying trend which is up for the dollar right now.

Weekend Trading Ideas:
Tuesday morning we saw the SP500 gap lower and continue to sell off. Traders started panicking out of their long positions and we could see it using the intraday market internals charts, which I cover each morning in the pre-market trading videos. Me being a contrarian (buying into market fear, selling into market strength) I used that high level of fear in the market along with the expected light volume holiday week ahead as an excuse to book profits near the lows on SP500 using the SDS bear fund allowing us to profit from the falling market. I feel we are going to have some crazy moves on the markets going into year end and it should be a lot of fun if done correctly.

Trading in general is a very difficult task especially if you are doing it for a living and planning on using your monthly income to pay bills, salaries etc… We all know the stress which comes with trading and if do not have a solid trading strategy, rules and cannot properly manage yourself (emotions) then you are most likely running into problems like over-trading, getting shaken out of trades easily, and taking bigger risks than your account can handle. Each of these cause more traders to blow up their accounts and big up on trading.

I am giving away my book on how you can control your trades, money and emotions. This short and to the point guide is full of my trading techniques, tips and thoughts which will help you get a handle of your emotions turning the market noise into music.

Download Book: http://www.thegoldandoilguy.com/trade-money-emotions.php

Chris Vermeulen

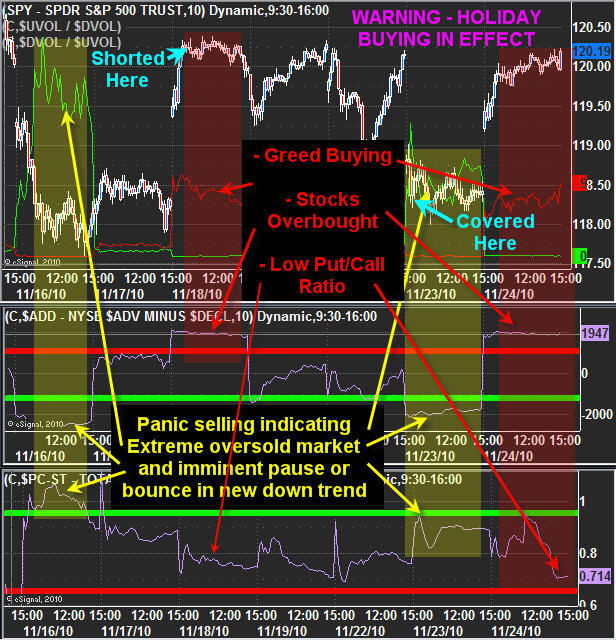
The past week and a half has been as choppy as it gets for the stocks market. Thankfully the herd mentality (fear & greed) stays the same. Understanding what others think and feel when involved in the market is one of the keys to making money consistently from the market. The crazy looking chart below I will admit is a little tough on the eyes, and I should have used red and green for holiday colors but green just was not going to work today so bear with me ?.

Market Internal Indicators – 10 minute, 7 day chart
This is a simple chart to read if you understand how to trade these market internal indicators (NYSE volume ratio, NYSE Advance/Decline line, and Total Put/Call ratio).

It shows and explains how I get a read on the overbought/sold conditions in the market. There are several other criteria needed to pull this trade off but it is these charts which tell me to start getting ready to take partial profits, buy or take short positions.

The top section shows the NYSE volume ratio line. When the green line spikes is means there are more sellers than buyers by a large amount and I call this fear. On the other hand when he red line spikes it shows everyone is chasing the price higher because they can’t stand the thought of missing another rally. I call this greed or panic buying. You buy into fear, sell/short into greed.

Important point to note though… We are getting another sell/short signal here (Wednesday) but knowing Friday will be light volume and knowing that light volume means higher prices, I think we should get a better opportunity to short this new down trend next week at possibly a higher level. The market may have a short squeeze in the next 2-3 days. Just so you know, a short squeeze is when the market breaks to the upside on light volume forcing the short positions to cover. This creates a pop in price, only for it to drop quickly after. But, if we get a pop with solid volume behind it, then we could just see the up trend start again and we would then look to play the long side. Only time will tell…

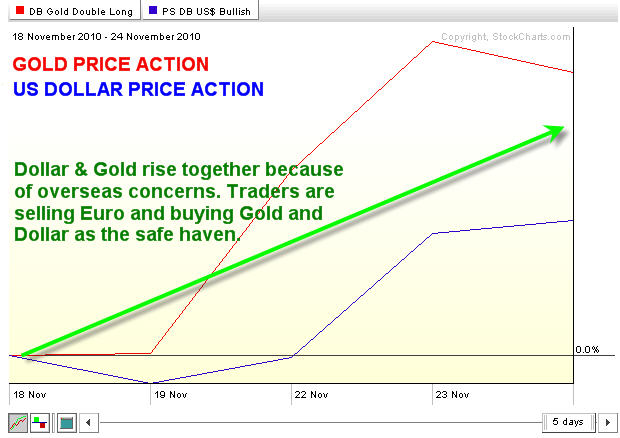
Rising Dollar & Gold – I Don’t Get It?
That is the question everyone seems to be asking this week. I think what we are seeing is straight forward. Traders/investors are selling Euros because of the issues overseas and are buying the dollar along with gold and silver.

Generally when the dollar raises gold drops, but they are both moving up in sync, and really I don’t see the problem with this as it has happened many times in the past. Currently I am neutral on gold and silver because of this situation though. I feel something is about to happen in a week or so that will change things in a big way.

Mid-Week Gold, Dollar & Stock Trading Conclusion:
In short, the equities market is now in a down trend and overbought here. It’s prime for a short position but with the holiday, light volume Friday, and most likely a follow through buying session on Monday I think its best to sit in cash without the stress of wondering what will happen on Monday. Just enjoy the holiday.

Recently members had a great short play locking in 2.2% gain on one of our positions this week as we shorted the market using the SDS inverse SP500 ETF. We also continue to hold two other positions with a 22 and 24% gain thus far and I think going into year end things are really going to heat up.

Get My Free Trading Guide Book and My Free Trading Ideas Here: http://www.thegoldandoilguy.com/trade-money-emotions.php

Chris Vermeulen

The past few months it seems the gold and silver play has been getting a little crowded with everyone wanting to own gold. While I am a firm believer that these precious metals are a great hedge/investment long term, I can’t help but notice the price action and volume for both metals which looks to me like they are getting exhausted.

Silver – Daily Chart
The silver chart below shows an extremely high volume reversal candle in early November which typically leads to lower prices and some times a major change in the trend. That being said silver remains in an uptrend with the possibility of a bullish pennant forming. On the other hand there is a possible head and shoulders pattern forming. I will be looking for light volume sideways chop keeping a close eye for a possible neckline breakdown or a momentum thrust to the upside for a possible trade.

Gold – Daily Chart
Gold is forming a bullish and bearish pattern also giving us a mixed signal. I am currently neutral on gold and not really looking to take part until we get some type of clear price action.

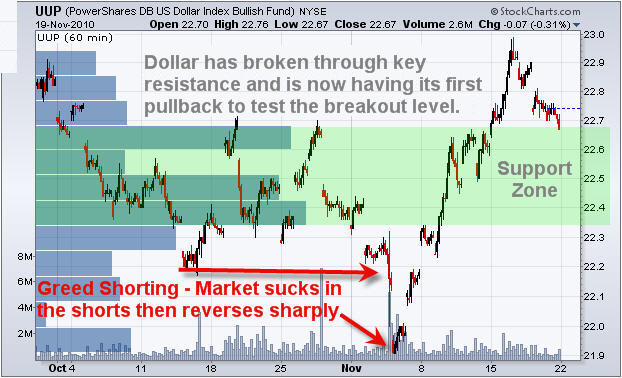
US Dollar – 60 Minute Chart
The dollar has shown some strength recently. The US dollar play has been to take the short side, and a couple weeks ago we saw the dollar breakdown from yet another consolidation. It seems like everyone shorted the dollar yet again. That could have been a key pivot low for the dollar. On the weekly chart that bounce was off a major support trend line helping add some fuel to the rally I would think.

The chart below shows the recent rally and breakout to the upside. Currently the dollar is pulling back to test the breakout level (support). It will be interesting to see how this week unfolds. If the dollar bounces then we just may see metals break below their necklines to make another heavy volume drop.

Weekly Precious Metals Update:
In short, I have mixed feelings for gold and silver. Yes I think they are good long term plays, but after the run they have had it is also very possible a much deeper correction is about to take place and we may not see new highs for another year. That is a long time to have money sitting in an investment when it can be put to work in other investments. I know the herd (general public) is all head over heals in love with gold and silver which is one of the reasons why I think we are nearing a top if we didn’t already see it a couple weeks ago.

Don’t get me wrong I’m not saying to sell of go short metals… not yet anyways. They are both still in an up trend but some interesting things are unfolding which could cause big action in the coming weeks.

Join my trading newsletter and get my ETF trading signals, daily analysis and educational material: www.TheGoldAndOilGuy.com

Chris Vermeulen
There have been some major trend changes recently and it looks as though more investments are about to follow. The real question though is… Are You Ready To Take Advantage Of It?

It has been an exciting ride to say the least with the equities and metals bull market and the plummeting dollar. But it looks as though their time is up, or at least for a few weeks. Traders and investors will slowly pull money off the table to lock in gains or cut losses and re-evaluate the overall market condition before stepping back up to the plate and taking another swing.

Below are a few charts showing some possible money making trade ideas in the weeks ahead.

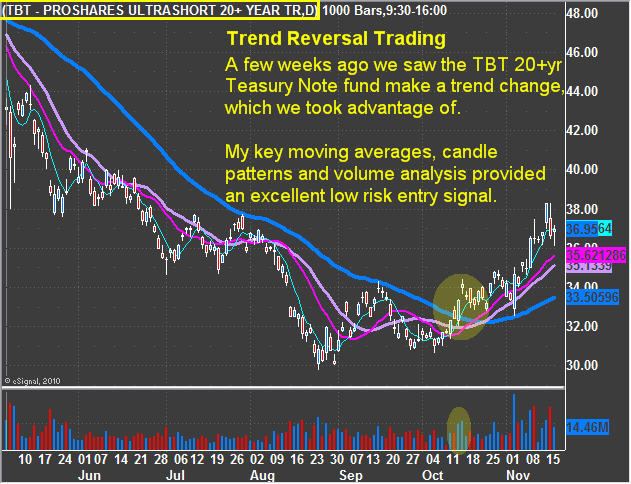
TBT 20+ Treasury Note Inverse Fund

This fund moves inverse to the price of the 20yr T.N’s also known as bonds. Looking at the chart you can see the recent reversal which took place. We had a great entry point shortly after this reversal took place using my low risk setup strategy.

Falling bond prices are considered to have a negative impact on equities because it implies that interest rates may start rising which means more investors will pull money out of stocks and put that money into a safe interest earning investment. You will typically see bonds change direction before equities. That being said the chart below is an inverse fund, so when this bond fund goes up, it means actually indicates bond yields are falling. I will admit these inverse funds really throw my brain for a loop at time… I prefer the good old days, buying long and selling short… so simple and clean…

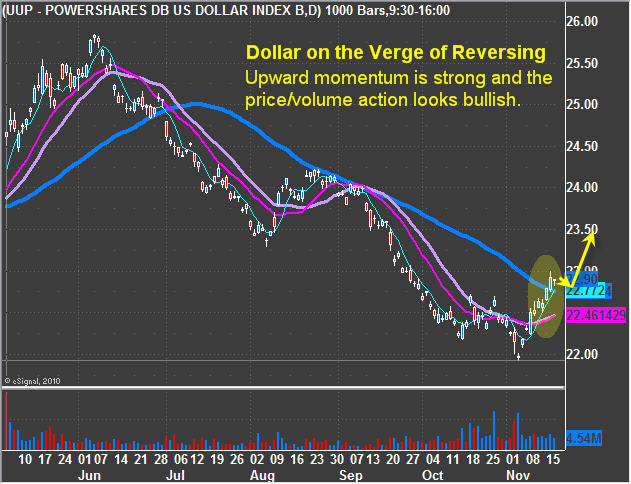
UUP – US Dollar Index Fund

This fund moves with the dollar and allows equities traders to take advantage of currency trading. This chart below shows a possible trend reversal for the dollar. If the dollar continues to rally then it’s also a good sign that interest rates could be rising in the near future and it also means more downward pressure on equities.

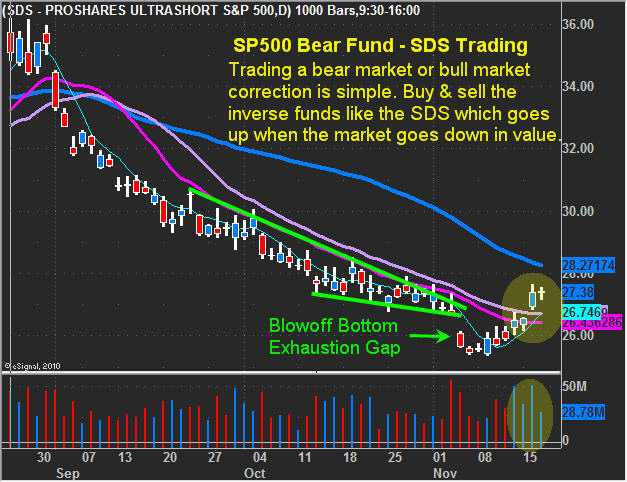
SDS – Inverse SP500 Index Fund

These bear funds make it possible for traders and investors to profit from a falling market using a regular buy and sell strategy. They can also be traded in retirement accounts making them a golden investment for those willing to play a falling market.

This chart moves the same as the SP500 index only flipped. As the SP500 falls this fund rallies.

The trading strategy we just used to play the recent rally is the same strategy we will use during a bear market, but instead of trading the SPY, we are trading this fund.

It is important to note that while bull market rallies tend to drag out; bear markets typically have faster movements. Fear is much more powerful than greed which is why the stock market drops quicker than it goes up.

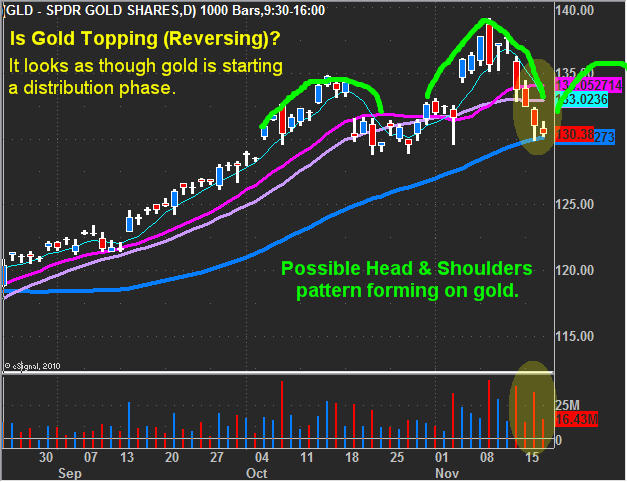
GLD – Gold Exchange Traded Fund

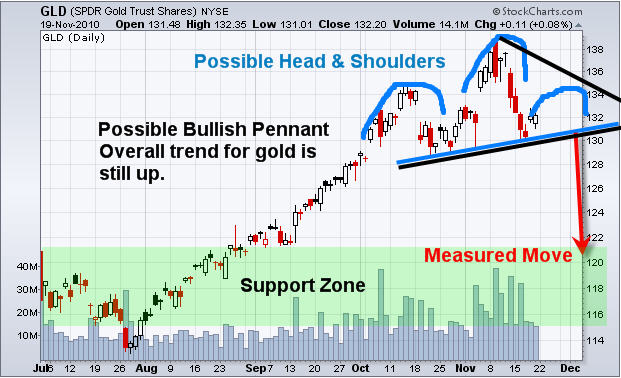
Gold also looks to be topping and could actually be starting to form a Head & Shoulders reversal pattern.

Mid-Week Trend Trading Conclusion:

In short, understanding inter-market analysis is crucial for traders/investors to know. Not understanding how they affect one other can be very costly in the long run. Remember that volatility and volume rise together at the end of a trend. You can view the recent volatility index (VIX) to see its price action also. Volatility changes also make for great low risk options trades if options are your thing. Focus on trading with the trend, bounces in a down trend are typically muted or trade sideways making is very difficult to make money buying in a falling stock market.

Get My Daily Pre-Market Trading Analysis Videos, Intraday Updates & Trade Alerts Here: www.GoldAndOilGuy.com

Chris Vermeulen
Over the past few months it seems as though everything has been tied to the dollar. Simple inter-market analysis makes it obvious that almost everything in the financial market eventually has an affect on stocks and commodities in some way. But recently trading has really been all about the dollar. If you watch the SP500 and gold prices you will notice at times virtually every tick the dollar makes directly affects the price and direction of gold and the SP500 index.

Let’s take a look at some charts to see the underlying trends and what they are telling us…

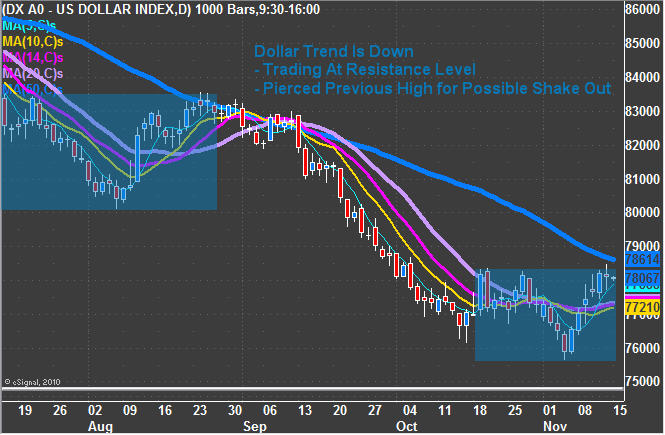
Dollar Index – Daily Chart

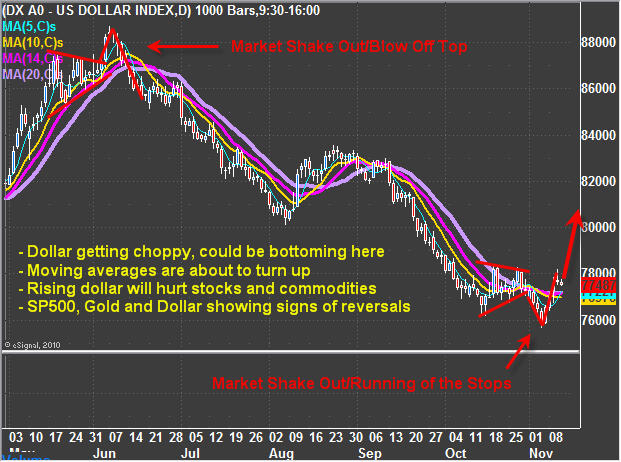
As you can see the trend is clearly down. Currently the dollar is trying to find a bottom as it bounces and pierces the previous high. The question everyone wants to know is if the dollar is about to rally and reverse trends or was Friday’s pierce of the October high just a shake out before the next leg down?

Back in late August the dollar pierced the July high on an intraday basis (shake out) just before prices dropped sharply. I think this could very easily happen again but when you see what gold volume is doing, it’s a different story.

Those who follow me closely know I focus on trading with the underlying trend, but manage my risk by trading smaller position sizes when the market has more uncertainty than normal with is what we are currently experiencing.

GLD – Gold Fund – Daily Chart

Gold and the dollar are almost inverse charts when comparing the two. Gold happens to be testing a key support level and its going to be interesting to see how the price holds up going forward. The one thing that has me concerned is the amount of selling taking place. The chart shows heavy volume selling and could be warning us of a possible trend change in the dollar, gold, oil and equities in the coming weeks.

Again the trend for gold is still up, so I would not be trying to short it at this time, rather look to buy into dips until the market trend proves us wrong. That being said, with the selling volume giving off a negative vibe and the fact that gold has rallied for such a long time, any new positions should be very small…

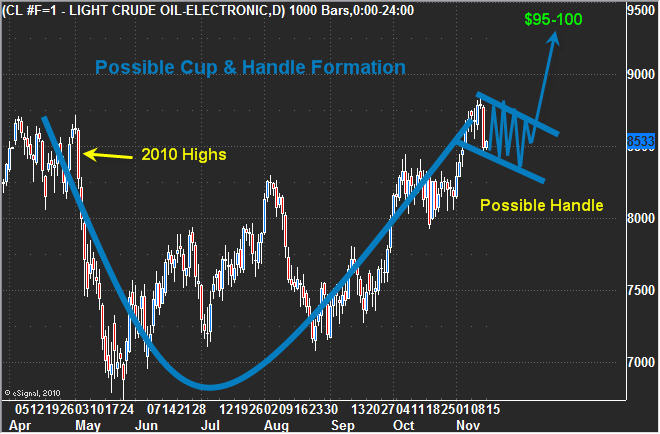
Crude Oil – Daily Chart

Oil looks to be forming a possible cup and handle pattern. If the Dollar continues to consolidate for another 1-3 weeks and breaks down, then we should see the price of oil trade in the range shown on the chart and eventually breakout to the upside. I have a $95-100 price target on oil if the dollar continues to trend down. Until we see some type of handle form here I am not trading oil.

SPY – SP500 Fund – Daily Chart

The equities market looks to have had one of those days which spooked the herd. Friday the price dropped triggering protective stops with rising volume. I was watching the intraday chart as the SP500 broke below the weeks low, and this triggered protective stops which can be seen on the 1 minute charts. In an uptrend I prefer watching stops get triggered because it means traders are getting taking out of long positions and most likely looking to play the short side. When the masses become bearish on the market, that’s when I start looking to play the upside in a bull market (buy the dip).

The chart below clearly shows the days when the shake outs/running of the stops took place. Most traders were exiting their positions and/or going short because the chart looked bearish. One thing I find that helps my trading is that if the chart looks rally scary (bearish) then I start looking at a shorter term time frame for a possible entry point to go long using price and volume analysis.

Weekend Market Trend Trading Conclusion:

In short, I feel the market is at a critical point which will trigger a very strong movement in the coming days or weeks. Because the dollar, gold, oil and the equities market have had such big moves I think trading VERY DEFENSIVE is the only way to play right now. That means trading small position sizes. Right now I am trading 1/8 – 1/4 the amount of capital I generally use on a trade. Meaning if I typically put $40,000 to work, right now I am only taking positions valued at $10,000.

Remember not to anticipate trend reversals by taking a position early. Continue to trade with the underlying trend with small positions or skip a couple setups if you feel strongly of a possible reversal. Once the trend reverses and the volume confirms, only then should you be playing the new trend. Picking tops can be expensive and stressful.

Get My Daily Pre-Market Trading Analysis Videos, Intraday Updates & Trade Alerts Here: www.GoldAndOilGuy.com

Chris Vermeulen
It has been a roller coaster week thus far as stocks and precious metals plunged on heavy selling volume on the back of a rising dollar, only to make a strong rebound Wednesday. While there has been significant intraday price movement, it was no surprise to us as we have been anticipating this pullback since discussing it in my Sunday Gold Newsletter.

Let’s take a quick look at the charts…

US Dollar Daily Trading Chart

The past couple weeks the dollar has traded in a choppy fashion, and last week I mentioned to subscribers to keep any new positions small. The dollar looked ready to make a bounce and if it reverses we will see stocks and commodities correct rather sharply.

Last week we trimmed some profits on our gold and SP500 trading positions in anticipation of a rising dollar/lower equity and metals prices. The dollar is currently in a down trend so we are still trading with the trend, but the next couple sessions could potentially change that.

As you can see on the chart a similar pattern to what we saw during the May/June top earlier this year has now formed in reverse this month. It’s a simple pattern I call a drop-n-wash. It is like dropping a knife – you panic, then take action (move foot, then wash the kife). That is typically how the market reacts to this type of price pattern after an extended trend has taking place for a long period of time.

The dollar made an obvious breakdown which the entire world witnessed, causing traders who recently went long to panic and sell their positions. Those who like to short the dollar would have taken a short position, only to see the market reverse and head straight back up again. This pattern has yet to confirm, but through the use of the shorter time frame charts (5 Min, 10 Min, 30 Min), I have a feeling the dollar may continue to rise. However, until the dollar shows considerable strength I am still playing the long equities / long gold side of the equation.

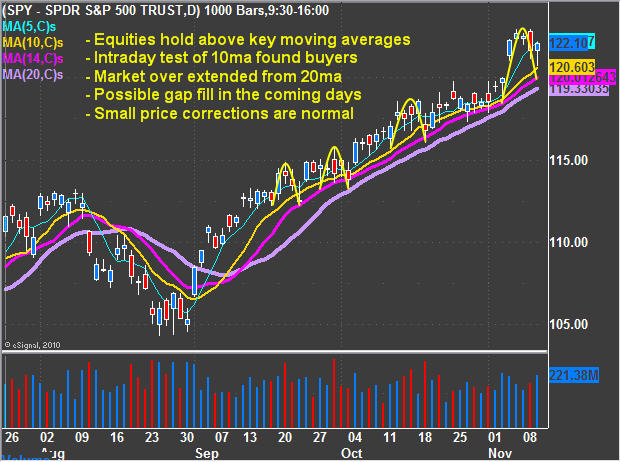
SPY – SP500 ETF Trading Fund

The SP500 made a nice move up last week and we trimmed our position back to lock in more gains as I anticipated this pullback and possible gap fill. As you can see on the chart the moving averages are all heading up and that’s the direction we are still focusing on playing (buying dips).

The morning dip on Wednesday the market sentiment started to shift to become extremely bearish on the short term time frame (10 minute charts). If the market drops down to fill the rest of that gap, I have a feeling the majority of traders will panic out of their position giving us an extreme sentiment buy signal. Also a gap fill will bring the price down to the key moving averages which will act as a support level. I will notify members to add more to my SP500 long position if that happens.

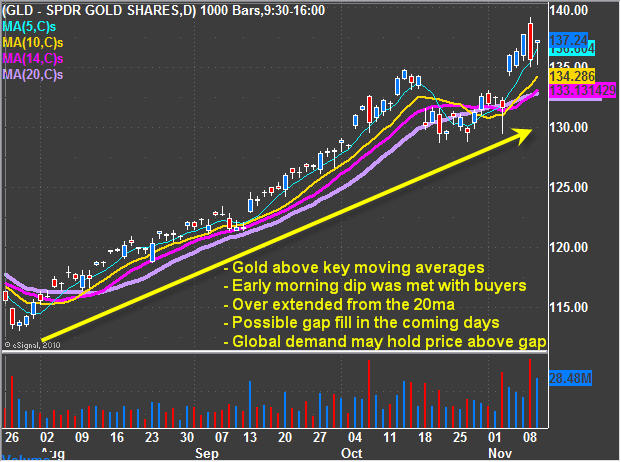
GLD – Gold ETF Trading Fund

Gold has much of the same story as the SP500 but with a couple twists. Gold has huge global demand from banks, investors and traders adding more buying power to this investment than stocks right now. We could see gold hold up above its gap that formed last week. That being said, a pullback to the key moving averages would not only act as a major support level but also fill the gap. We currently have our long positions, but trimmed some profits near the highs and are sitting tight letting the market work it’s self out.

My trading partner J.W. Jones posted a great gold play yesterday which had a nice payout already. Read about his gold options trade here.

Mid-Week ETF Trading Conclusion:

In short, the focus should be kept on trading with the underlying trends until a trend change has been confirmed. So that means short the dollar, long equities, metals and oil.

That being said, because things are starting to look unstable it is crucial to trade smaller position sizes during times of uncertainty like this. Anticipating major market tops is very difficult and generally costly play, just ask everyone who has been trying to pick a top for the past 2 months… Anticipate trend changes, but don’t trade them until the price/volume action confirms the new trend.

Get My Daily Pre-Market Trading Videos, Daily Updates & Trade Alerts Here: www.GoldAndOilGuy.com

Chris Vermeulen

The financial markets continue to climb the wall of worry on the back of more Fed Quantitative Easing. Those trying to pick a top in this choppy bull market may prove to be correct for a couple hours but over time the shorts continue to get clobbered.

Quantitative easing was enough to turn gold back up and gave oil just enough of a nudge to breakout of its cup and handle pattern explained later.

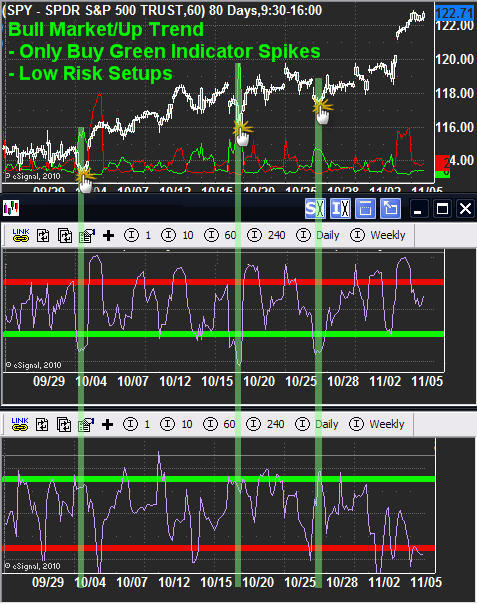
The past few weeks the number of emails I receive on a daily basis about what individuals should do about short positions they took on their own has growing quickly. Usually when my inbox starts to fill up with traders holding heavy losses trying to pick a top I know something big is about to happen and its not going to be in the favor of the herd (everyone shorting). In the past couple week there have been some great entry points for the broad market whether its to buy the SP500, Dow, NASDAQ or Russell 2K. I focus on trading with the trend and entering on extreme sentiment readings as shown in the chart below.

Extreme Trend Trading Analysis

Below are my main market sentiment indicators for helping to time short term tops and bottoms. That being said I don’t pick short term tops in hopes to profit on the down side. Rather I wait for a extreme sentiment bottom to be put in place, then enter long with the up trend (Buy Low).

Once there is a 1-2% surge in price and sentiment indicators are showing a short term top I like to pull a little money off the table to lock in some profits while still holding a core position (Sell High). This is exactly what I/subscribers have done over the last couple weeks. This is a simple yet highly effective strategy and works just as well in a down trend except I focus on shorting extreme sentiment bounces. Subscribers know what these indicators are as I cover them each week in my daily pre-market trading videos as we prepare for the day ahead.

SPX Running Correction

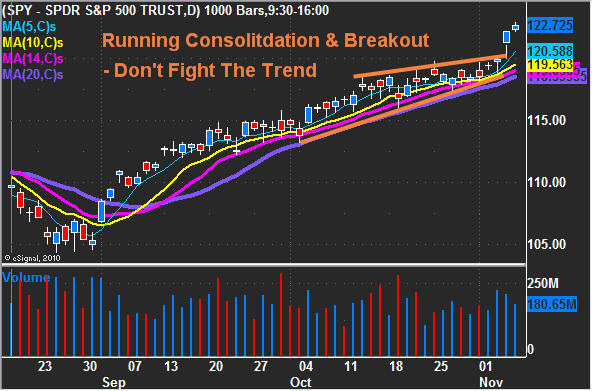
Since early September the equities market has been on fire. In late September the market was extremely toppy looking and trading at key resistance levels from prior highs convincing a lot of traders to take a short position. But instead of a correction the market surged and has since continued to grind its way up week after week.

This rising choppy price action can be seen two ways:
1. As a rising wedge with a blow off top (Bearish)
2. Or as a Running Consolidation (Bullish)

The running consolidation happens when buyers are abundant picking up more shares on every little dip. Overall looking at the intraday price action you will see market shakeouts as it tries to buck traders out before it continues higher. This choppy looking market action if not read correctly looks extremely bearish to the novice trader and the fact the market is so overbought it easily convinces them to take short positions. This choppy action is just enough to wash the market of weak positions before starting another run up.

All that said, both a blow off rising wedge and a running correction are very bullish patterns for a period of time. Again I cannot state it enough, trade with the trend and the key moving averages.

Gold Shines On The Daily Chart

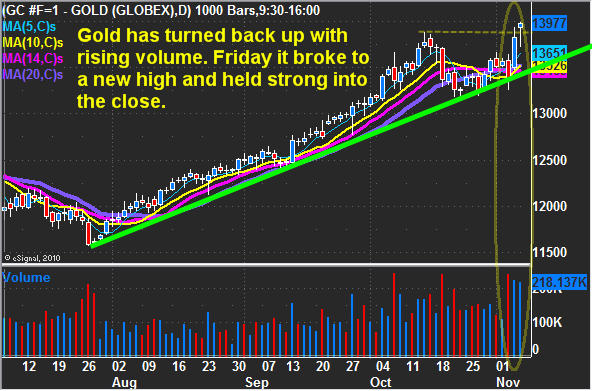
The gold story is straight forward really… Trend is up, quantitative easing is back in action and that is helping to list gold and silver prices. Key moving averages have turned back up and gold closed at a new high which shows strength.

Golden Rocket

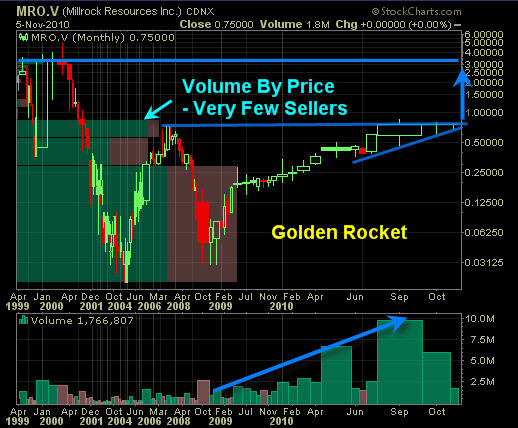
With another round of quantitative easing just starting and gold making another new high last week there is a very good chance gold stocks will rocket higher in the coming 8 months. I have been following Millrock Resources Inc. because of the team involved with this company. A breakout to the upside here could post some exciting gains if you take a look at the chart and see where the majority of volume has traded over the years along with the bullish chart patterns (Cup & Handle/Rising Wedge) with strong confirming volume. From 84 cents to the $3.50 area there should not be many sellers other than traders slowing taking profits on the way up.

Crude Oil Breaks Out Of Cup

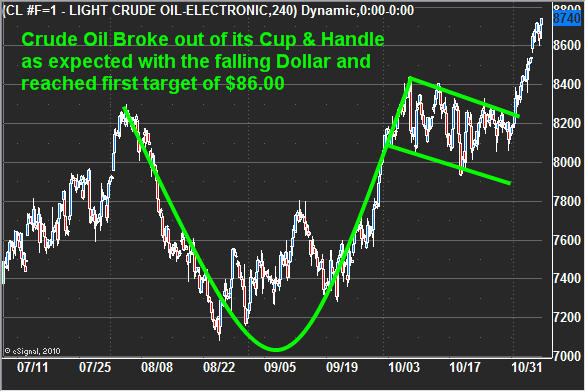
Crude oil has been dormant the past few weeks even though the US Dollar has plummeted. But last week’s news on more QE was enough to send oil higher. The surge took oil prices straight to the 2010 highs as expected and blew past my first target of $86.00 per barrel. I figure it will consolidate here for a while until we see if the dollar bottomed last week or is just testing the breakdown level.

Weekend Trading Conclusion:

In short, the market has played out exactly as we planned and all four of our positions are deep in the money. As we all know the market goes in waves in both price and for trade setups. The past couple weeks were great for getting into trades and now the market is running in our direction. It will take a few days for the market to stabilize (pullback or pause) before we could get anther round of trade setups. Keep position sizes small as the market remains overbought and a sharp correction could happen at any time. Until then, keep trading with the trend.

Disclaimer: I own shares of SPY and MRO.V

Get My Daily Pre-Market Trading Videos, Daily Updates & Trade Alerts Here: www.TheGoldAndOilGuy.com

Chris Vermeulen