During the recent weeks we have seen commodities especially precious metals continue to drop in value. Market participant sentiment has become more bearish on commodities and couple that with a rising dollar it’s no wonder why we continue to see commodities as a whole fall in value.

Money has been flowing out of bonds at record levels this summer telling us most of market participants are feeling bullish on the stock market. This shift in sentiment of the masses are typical as they move their money from the risk on safer assets (bonds & commodities) and rotate into risk-on assets like stocks. While this is a bearish (contrarian sign) stocks could easily continue to rally for an extended period of time and possibly several more months before they actually top out.


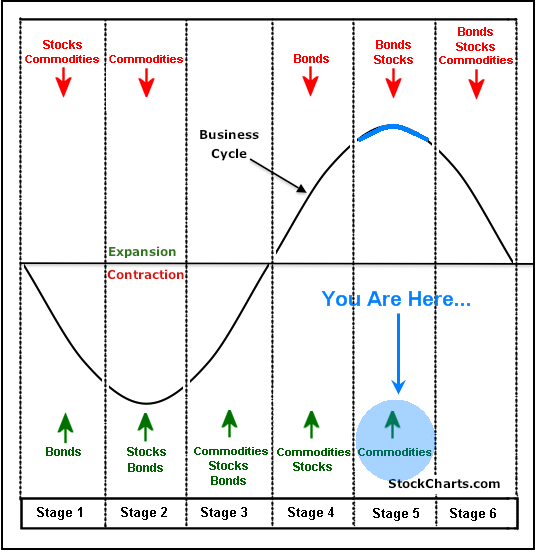
Let’s take a look at the financial market business cycle diagram:

Bond prices have been falling for months and they typically lead the stock market lower. I feel we are starting to enter the phase where stocks will soon top and head lower also. Once this starts money will naturally flow into safer assets that are more tangible like commodities.

Keep in mind this cycle is very slow moving and rotation from one phase to another takes months. This is a process not an event but it is still very tradable.

JMCycle


Now let’s fast forward to precious metals both gold and silver are likely to do in the next couple months. If you review the charts below you will see gold and silver bullion prices are looking primed for a bounce/rally from these deep oversold levels.


Gold Weekly Price

gold


Silver Weekly Price

sil;ver

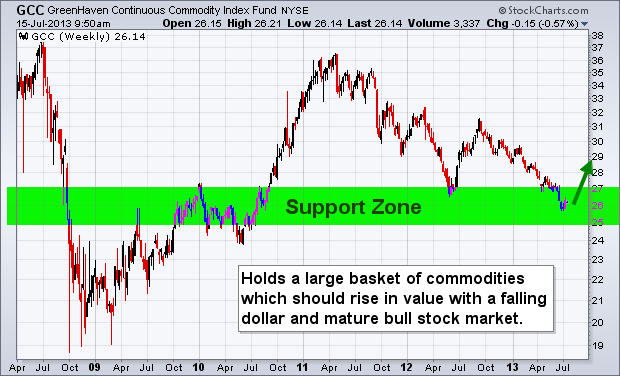
Take a look at a basket of commodities through the GCC ETF.

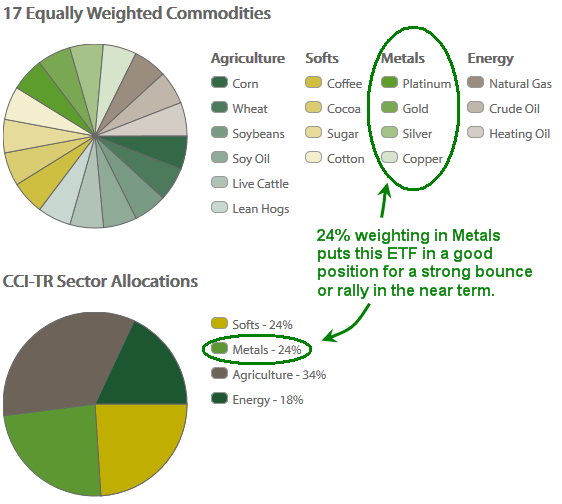
GreenHaven Continuous Commodity Index Fund (GCC) is an Exchange-Traded Fund (ETF) that provides an innovative and efficient way to deliver broad based, diversified commodity exposure. It aims to achieve this by using futures contracts to track the Thomson Reuters Equal Weight Continuous Commodity Total Return Index (CCI). The CCI-TR is an equal weighted index of 17 commodities plus an additional Treasury Bill yield. Because of the equal weighting, GCC offers significant exposure to grains, livestock, and soft commodities and a lower energy weighting than many of its peers. In addition, GCC is rebalanced every day in order to maintain each commodity’s weight as close to 1/17th of the total as possible.

So, knowing metals are 24% of the index it bodes well for a bounce in the overall commodity index. Keep in mind this report is only focusing on precious metals, but many other commodities look ready to rally also like natural gas.

GCC-H


GCC – Continuous Commodity Index Fund Weekly Trading Chart

The chart below shows a very bullish 4 year chart pattern. At the very minimum a bounce to the $29 is highly.

gcc


Commodity Basket Trading Conclusion:

In short, commodities as a whole remain in a down trend. Until they show signs of real strength I will not be trying to pick a bottom. Several commodities are starting to look oversold and ready for a bounce like sugar, coffee, copper and natural gas.

Last month I talked about how a major market top is likely to unfold during the second half of this year. I still believe this to be true. But keep in mind these major market tops which only happen every few years are a MAJOR PROCESS. They take time to form and often we will see a series of new highs followed by quick sell offs as the market gets more people long as they big money distributes their shares/contracts into the new money rotating into the market.

If you want more reports and trade ideas join me at www.GoldAndOilGuy.com

Chris Vermeulen

With 2012 now behind us it’s time to start looking for some new long term investments which have big potential gains in the new year. Copper is one metal that has caught my eye.

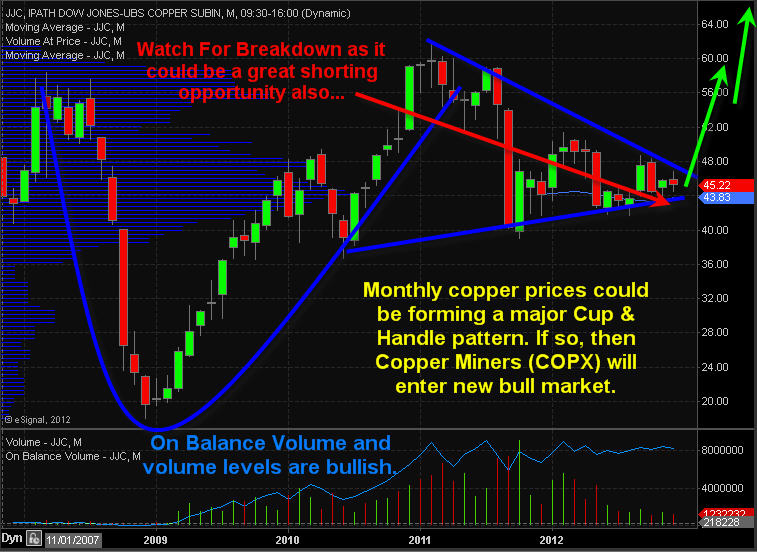
The long term monthly chart of the copper ETF JJC shows a potential cup and handle pattern accompanied with bullish volume characteristics. Last year copper traded sideways in a narrowing range. This type of price action tends to bore traders and investors forcing them to look elsewhere for new to trades. The saying is “If the market doesn’t shake you out, it will wait you out”

You can see on the monthly chart that the interest in this commodity diminished. You can tell because of the sideways movement and declining volume. I like to focus on investments which are out of favor but are showing signs of another big trend starting. getting on the train before it leaves the station can make for a fun ride. I do post some of my trading ideas with my charts updating live each day here: https://stockcharts.com/public/1992897

Take a look at the charts, analysis and my best copper stock setup below:

JJC – Copper Total Return ETN Profile

Description: The index includes the contract in the Dow Jones-UBS Commodity Index Total Return that relates to a single commodity, copper (currently the Copper High Grade futures contract traded on the COMEX).

CopperMonthly


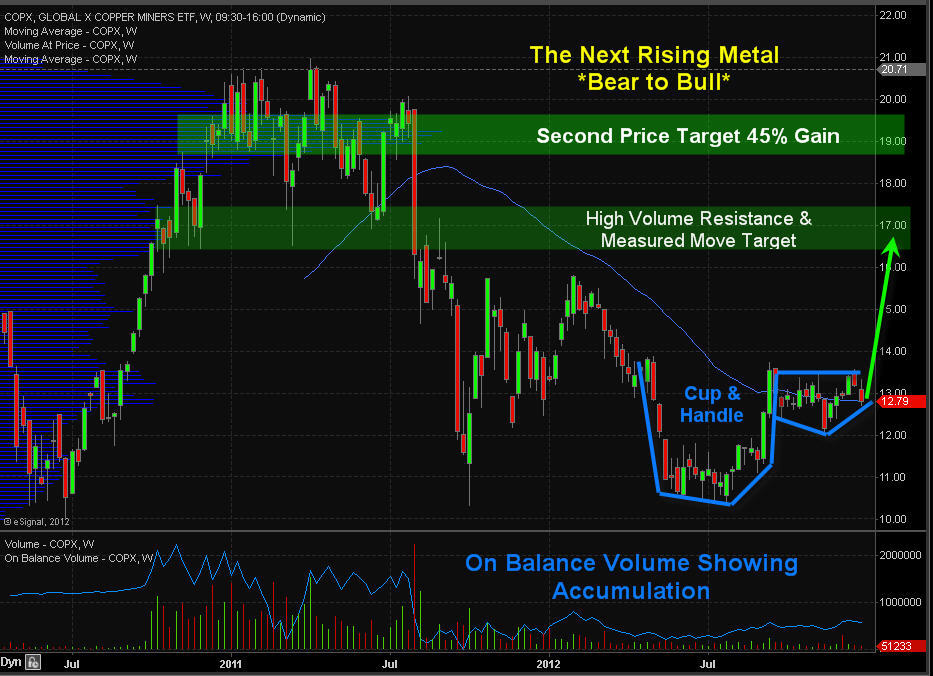
Copper Miner Stocks ETF COPX – Weekly Chart

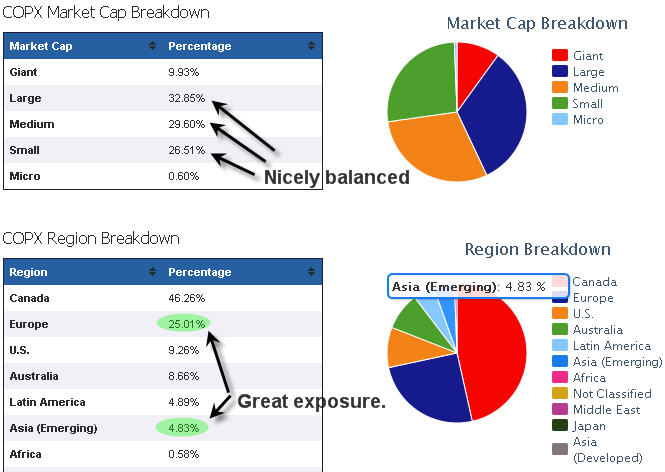
This ETF holds a basket of copper mining stocks which is showing signs of a new trend starting. Take a look at the top holdings stocks and fund breakdown to get a feel for the exposure it provides.

COPX Top Ten Holdings

  1. Inmet Mining Corporation (IEMMF): 6.62%
  2. KGHM Polska Miedz SA (KGH): 5.24%
  3. Xstrata PLC (XTA): 5.04%
  4. Grupo Mexico, S.A.B. de C.V. (GMEXICO B): 4.89%
  5. Jiangxi Copper Company Limited H Shares (00358): 4.83%
  6. HudBay Minerals, Inc. (HBM): 4.82%
  7. Antofagasta PLC (ANTO): 4.78%
  8. Southern Copper Corporation (SCCO): 4.75%
  9. Lundin Mining Corp (LUNMF): 4.55%
  10. Kazakhmys PLC (KAZ): 4.55%

CopxInfo

DEc28Copx


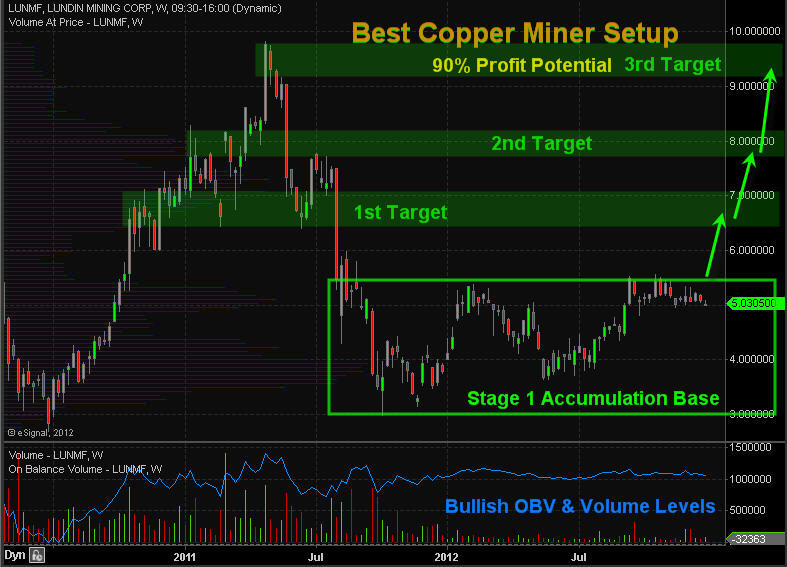
Best Copper Stock Setup – LUNMF

After reviewing the main holdings in this fund I noticed one stock that looks ready to start a new bull market. Lundin Mining. shares look to be building a Stage 1 base and could break out and start to rally any week. Keep in mind 3/4 stocks move with the broad market so we do want the major indexes to find a bottom or at least trade sideways if we want copper stocks to start their run.

CopperMiner


Copper Futures, ETF and Stock Trading Conclusion:

Copper has lost its shine over the past 12 months but could start to make headline news in the near future. I like both COPX and LUNMF if we see further strength. If you would like to get more of these trading and investing ideas and alerts be sure to join my newsletter at: http://www.TheGoldAndOilGuy.com

Chris Vermeulen
Disclaimer:
I currently do not own a position in these investment but plan on buying them in the near future. This material should not be considered investment advice. Chris Vermeulen is not a registered investment advisor. Under no circumstances should any content from this website, article, video, seminar or email from Chris Vermeulen (TheGoldAndOilGuy.com) be used or interpreted as a recommendation to buy or sell any type of security or commodity contract. This material is not a solicitation for a trading approach to financial markets. Any investment decisions must in all cases be made by the reader or by his or her registered investment advisor. This information is for educational purposes only.

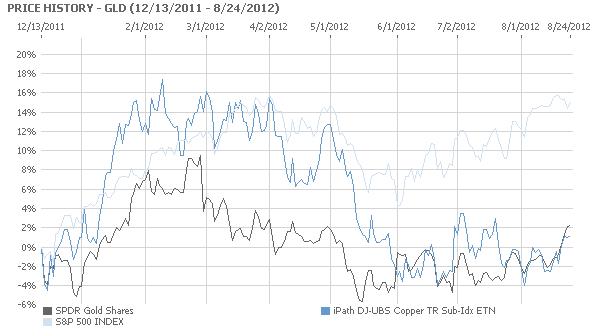
There should be an inverse relationship between gold (NYSEARCA: GLD) and copper (NYSEARCA: JJC).

Most of gold is used for investment purposes.  As a result, it rises when there is economic weakness and investors lose confidence in the fiat currency of a country.  Most of copper is used for industrial purposes.   Therefore, the price of The Red Metal should increase when economies are booming, as there is a greater demand for it from the factories operating at full throttle and for the buildings being constructed.

Gold Bullion Prices

Gold Bullion Prices

As the chart below evinces, the inverse relationship between the exchange traded for gold, SPDR Gold Shares, and the exchange traded fund for copper, iPath Copper, has broken down due to traders positioning themselves for the introduction of Quantitative Easing 3 when Federal Reserve Chairman Ben Bernanke speaks at Jackson Hole this Friday.

Continuing economic weakness in the United States will almost certainly lead the Federal Reserve to act in way that is more powerful than Operation Twist, the selling of short term securities to buy those with a longer term.   Based on the most recent data, economic growth in the United States is falling as the unemployment rate is rising.  A recent statement by the Federal Reserve was unusually clear in calling for greater action.

Both the JJC and the GLD have risen together as traders expect more economic stimulus from the United States Government.  This will weaken the US Dollar and raise the price of commodities, as happened with Quantitative Easing 2.  During the period of Quantitative Easing 2, from November 2010 to June 11, the US Dollar fell in value and the GLD and the JJC soared, along with other commodity prices, particularly oil.  This pattern is being repeated as traders are preparing for the initiation of Quantitative Easing 3 when Bernanke speaks Friday, or at the next Federal Open Market Committee meeting.

Gold Spot Price Chart

Gold Spot Price Chart


TheTechnicalTraders Analysis & Trade Idea Delivered To Your INBOX!