We have been pouring over the charts to find out what to expect over the rest of 2018 and our advanced predictive modeling tools are showing us a few key elements that all traders need to be aware of.  So, let’s get right to it.

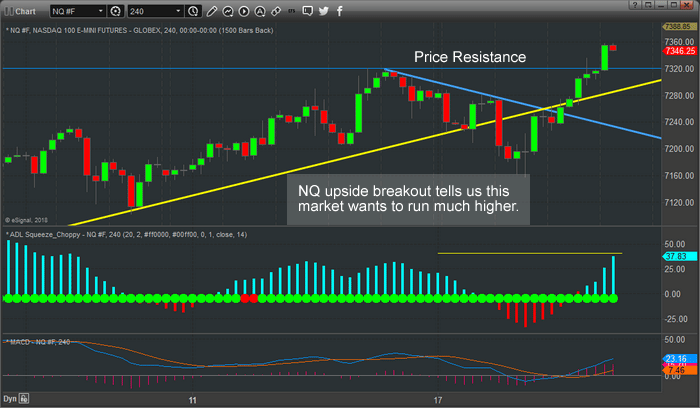
First, the NASDAQ has likely neared or reached its peak near 7400 for the next few months.  Don’t expect the NQ to move much beyond 7400 and don’t expect a lot of volatility in the NQ over the next few months.  Our research shows the NQ should stall near 7400 and volatility should decrease through September (possibly).

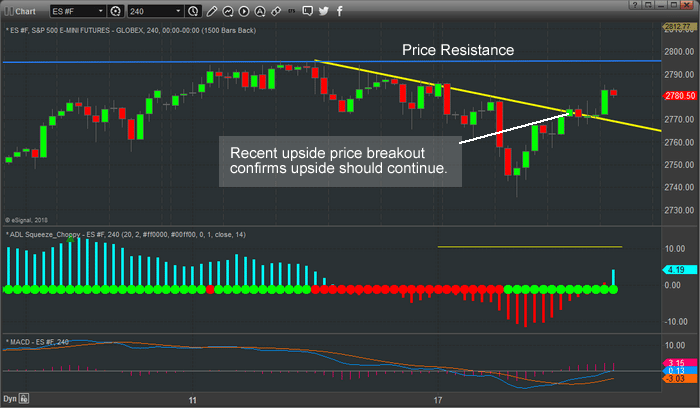
Second, the ES/YM/Transportation sectors are poised for a very healthy rally over the next 3+ months or longer.  We believe a massive capital shift is underway that will drive capital from foreign markets and tech stocks into Blue Chips, Small Caps and the Transportation sector.

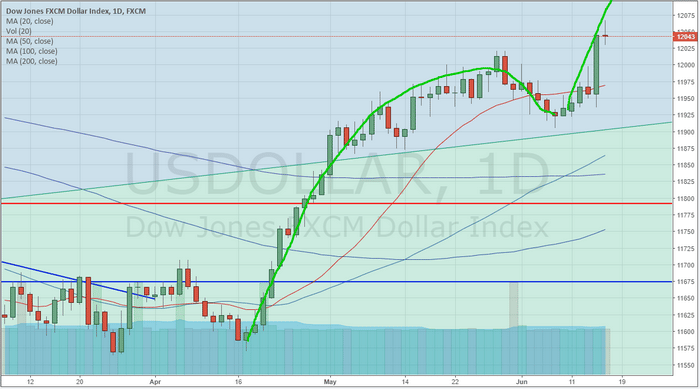
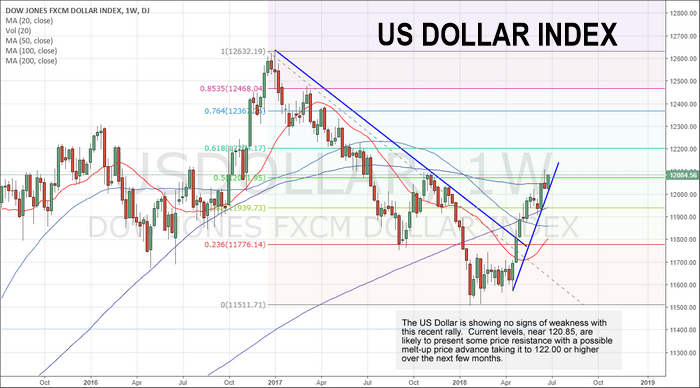
Third, the US dollar will likely continue to appreciate towards 122 after a brief price stall near 120.85.  120.85 is resistance that will probably cause the price advance to stall a bit before pushing higher.  The next resistance level is near 122 and is our next higher target.

Lastly, overall volatility will likely decrease in the general market as price trend continues to unfold.  The recent spike in the VIX has a lot of people wondering if we could see some type of deeper market rotation.  Our opinion is that these projected upside trends will begin after the July 4th trading week and surprise many traders.  Shorts will get squeezed very quickly as this upside trend unfolds.

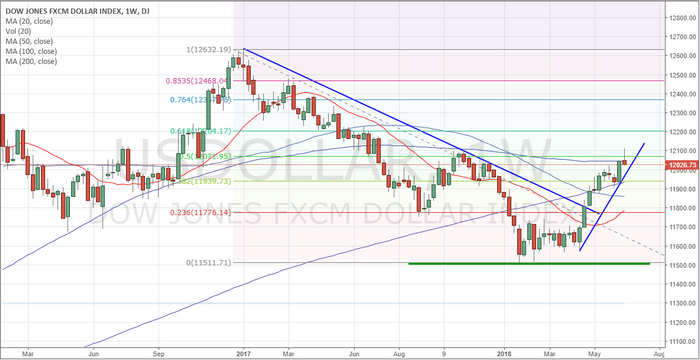
Now, let’s take a look at some charts.  This, a Weekly US Dollar chart, shows the recent price channel breach as well as the clearly defined upside price trend.  120.85 is currently resistance near the 50% retracement level of the previous price downtrend.  This level will likely cause the price to stall a bit before advancing higher to the 122.00 level.  Overall, until something changes in the global markets or price pushes above the 123.65 level, we expect the US Dollar to continue to advance.

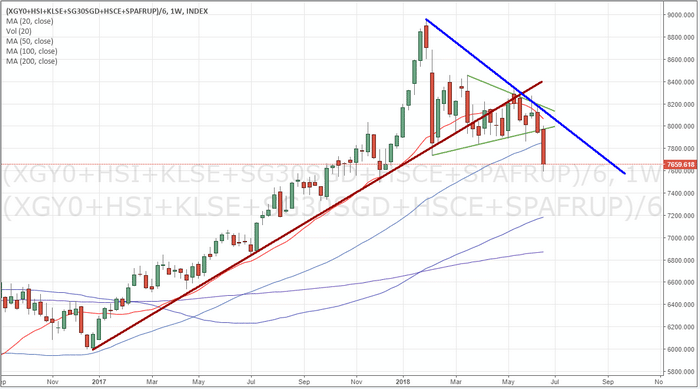
This, the Monthly Dow Jones Transportation Index, shows us the scope and amplitude of recent price swings as well as the price alignment of price rotation over the past 3+ years.  Notice that the last Fibonacci Arc Square aligns with price pullbacks and retracements much like the one originating near 2012 through 2014.  The point of this exercise is to understand how the price is supposed to react within this expansion and to attempt to predict the future upside targets based on these moves.  It is our opinion that the Transportation index will rally to near $12,200 before this move is over.  The reasoning for this is simple – given current and past price rotation, the alignment of the Fibonacci arc suggests that $12,200 will be the ultimate price peak.  Simply put, we just align the Fibonacci arc to price rotation and see where the final outcome for the price is located.


Lastly, this Monthly YM Chart shows us a very clear picture of what to expect over the long term if our predictive analysis and projected price/cycle analysis is correct.  The YM should rally to new highs before the end of this year while potentially stalling near the end of 2018 or within Q1 of 2019.  This stall/peak formation will result in a slight price correction (of likely 3~6%) before prices, again, begin another upside move.  These Fibonacci price circles help us determine projected price targets as well as assist us in understanding current and past price rotation.  The key to all of this is overlaying different analysis and predictive modeling systems that help us understand what to expect in the future.  From this analysis, we can then take at look at these types of “trigger point models” that helps us to understand where and when the price may attempt to reach peaks or troughs.


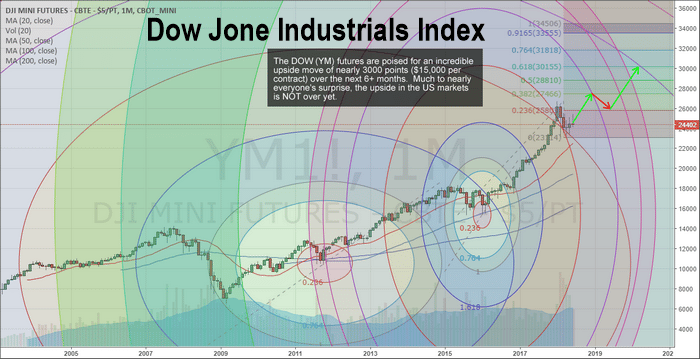
The current price rotation in the market, with the ES trading near 2720, would indicate that the ES, YM and other Blue Chips may be setting up for a massive upside move.  The YM alone could rally nearly +3000 points ($15k per contract) and the ES could rally +100 points (+$5k per contract) over a fairly short period of time (3~8+ weeks).  This is a tremendous opportunity for traders.  Get ready for an incredible opportunity for profits and let us help you stay ahead of these moves.

Please take a minute to visit www.TheTechnicalTraders.com to learn how we can help you find and execute better trading solutions, better research and provide a top-tier solution for active traders.  If you like our research and find it helps you, then consider joining our other valued members in supporting our work and taking advantage of our solutions for active traders.  Want to know where this market is headed and what to expect throughout the end of this year and beyond – our members already know what our predictive modeling systems are suggesting for the next 5+ months.

Do These Charts Make Sense or Confuse You? It doesn’t matter, just use our easy to follow trade alerts complete with entry, stop, and price targets! JOIN NOW AND TRADE LIKE A PRO!

Chris Vermeulen

The US Equities markets rotated over 1.35% lower on Monday, June 25, after a very eventful weekend full of news and global political concerns.  Much of this fear results from unknowns resulting from Europe, Asia, China, Mexico and the US.  Currently, there are so many “contagion factors” at play, we don’t know how all of it will eventually play out in the long run.

Europe is in the midst of a moderate political revolt regarding refugee/immigration issues/costs and political turmoil originating from the European Union leadership.  How they resolve these issues will likely be counter to the populist demands from the people of Europe.

Asia is in the midst of a political and economic cycle rotation.  Malaysia has recently elected Prime Minister Dr. Mahathir Mohamad, the 92-year-old previous prime minister (1981~2003) as a populist revolt against the Najib Razak administration.  In the process, Mahathir has opened new and old corruption and legal issues while attempting to clean up the corruption and nepotism that has run rampant in Malaysia.  Most recently, Mahathir has begun to question the established relationship with Singapore and the high-speed rail system that was proposed to link the two countries.

China is experiencing a host of issues at the moment. Trade concerns, capital market concerns,  corporate debt concerns and an overall economic downturn cycle that started near the beginning of 2018.  What will it take to push China over the edge in terms of a credit/consumer market crash is anyone’s guess?  Our assumption is that continued inward and outward pressures will not abate quickly – so more unknowns exist.

Mexico will have new Presidential elections on July 1, 2018.  What hangs in the balance of this election cycle is just about everything in terms of North American economic cooperation and future success.  It is being reported that a populist “anti-neoliberal” movement is well underway in Mexico and the newly elected leader may begin a broader pushback against President Trump regarding NAFTA, immigration, US corporations operating in Mexico and more.  We won’t know the full outcome of this election till well after July 2018.

Meanwhile, back in the USA, our political leaders in Congress and the House of Representatives seem hell-bent on opposing everything President Trump and many American’s seem to want – clean up the mess in our government and get a handle on the pressing issues before us.  The US has a growing and robust economy.  The last thing anyone wants right now is anything to disrupt this growth.  Yet, it seems the political divide in the US is so strong that it may take some crisis event to push any resolution forward.

What does this mean for investors and traders?  Fear typically appears in one place before it appears anywhere else – the Metals markets (Gold, Silver, Platinum, and Palladium). This Daily Gold Chart shows our predictive cycle analysis pointing to a near-term bottom formation as well as a strong likelihood of immediate upside price action.  These cycles do not represent price levels.  So the cycle peak does not represent where price will go – it simply indicates future cycle trends and direction.

Given this information, it is very likely that Gold will recover to near 1320 within the next couple weeks and possibly push higher on global concerns.  For traders, this means we are sitting near an ultimate bottom in the metals and this could be an excellent buying opportunity.


The Gold Miners ETF shows a similar cycle pattern but notice how prices in the Miners ETF have diverged from the Gold chart, above, by not resorting to a new price low as deep as seen above.  This could be interpreted as the Gold market reacting to global concerns in an exaggerated way while the miners ETF is showing a more muted reaction.  Additionally, notice how the ADL cycle analysis is pointing to similar price peaks in the future with near-term bottoms forming.  This is key to understanding what we should be expecting over the next few weeks in Gold.

Our interpretation is that the global fear will manifest as a renewed upside trend in Gold and Gold Miners over the next few weeks with the potential for a 5~8% rally in Gold. The long-term upside is incredible for these trades but that is if you look years into the future.

As these fear components and unknowns continue to evolve, the metals markets should find support and push higher as fear continues to manifest and global markets continue to weaken.

As we have been stating since the beginning of this year, 2018 is setting up to be a trader’s dream.  Bigger volatility.  Bigger swings.  Bigger profits if you are on the right side of these moves.  Our proprietary predictive modeling systems and price analysis tools help us to stay ahead of the markets.

We help our members understand the risks and navigate the future trends by issuing research posts, providing Daily video analysis complete with cycle projections and by delivering clear trading signals that assist all of our members in finding profits each year.  We are showing you one of our proprietary tools right now, our ADL Predictive Cycle tool and what we believe will be the start of a potential upside move in the metals markets.  Get ready for some great trading over the next few months!

Get These Cycles for Oil, Gold, Bonds, SP500 and More.
Click Here

Over the past few months, our research team has authored many articles regarding the weakness in China/Asia as well as the recent rotation in the global markets as trade issues, debt issues, the G7 meeting and, more recently, concerns in the US and Europe regarding immigration and political issues create chaos in what was, just 18 months ago, a relatively calm global market.  Yes, there have been some concerns over the past few year with regards to debt issues and other concerns, but the recent shakeup in the status-quo of the global markets seems to be presenting a massive opportunity for investors.

The recent news is that the European leaders are convening an Emergency Meeting to discuss immigration issues and other issues.  This emergency meeting is warning us that other issues are at play here and immigration issues are the result of many failed policies and management by the EU to protect and distribute diversity to EU members.

We believe this emergency meeting could result in a big fat “nothing” from the EU which will expand additional pressures on EU member nations to find solutions on their own regarding immigration, costs, debt and others.  In other words, if our assumption is correct that this meeting will result in the EU leaders saying “well, it’s just the way it is right now – we’ll have to come together to find a way to deal with it” will result in a massive backlash revolt from other EU members.

Additionally, concerns originating from within China and Asia are indicating that massive debt issues, defaults and margin calls.  We warned of this economic contagion cycle back in late March 2018 and early April 2018 with our detailed multi-part research post.  This is just beginning as China has been an economic leader for most of Asia, thus as China deals with a contracting economy and some levels of economic contagion, so will the rest of Asia.

We expected to see an explosion in defaults and reduced foreign capital investment as China attempts to curtail this credit crisis event.  This means many of the emerging markets will see some extended weakness while pricing attempt to find support in the face of unknowns and unpredictable outcomes.

Lastly, in the US, with mid-term elections only about 3 months away, and with Mexico having elections only a few days away (July 1, 2018) a number of key factors for North America are unknown.

Right now, Andres Manuel Lopez Obrador (ALMO) appears to be a potential winner of these elections, yet from news we see that Mexico is moving away from new-liberalism and towards a more populist leader that could expand tensions with the US President.  Just recently, ALMO urged Mexican citizens to overwhelm the US with illegal immigrants while attempting to move Mexico away from reliance on the US for economic support.

Our opinion of this is that ALMO is walking a very fine line given everything that is going on throughout the globe at the moment and although it may sound good to his people – there may be some very tough situations ahead in making this a reality.

We, the research team at www.TheTechnicalTraders.com, have recently released a Members Only update to our valued members that shows our predictive modeling systems expectations over the next 2~4 weeks for the US equity markets.  We can’t show these to you because this is a free article to help you see what is happening and that the markets are about to have some big moves.

What will happen? That is only for our subscribers at the Wealth Building Newsletter.  But, what we can show you is what we believe are critical charts for the next few weeks in regards to the global markets and the expectations ahead.

First, Bitcoin recently broke below the $6k level on a breakdown move that could be a sign that no strength really exists near this $6k level.  Please understand that if this $6k level is broken and no real support is found near this level to keep prices above $6k, then $4k or lower is an immediate downside target.  Below $4k, we are talking about $1600 price levels.  This represents a 70% price decrease from recent level if it happens.  So, pay attention to Bitcoin as we believe the meltdown in cryptos could present real issues in the global markets as a derivative market risk factor.


Next, this Weekly BRICS chart (emerging market custom index) is clearly showing the weakness in price levels extending much lower over the past few months.  Remember, the BRICS markets are a basket of major emerging markets and this price channel breakdown could be an early warning of a much larger downside price trend setting up.  Weakness below immediate support may result in an additional price decline of -20% or more from current levels.


This Weekly China/Asia custom index is showing us that recent price weakness has recently broken a FLAG/PENNANT formation that tells us price weakness could accelerate as debt issues, defaults and margin calls expand.  Somewhat similar to what happened in the US 10 years ago, when this debt bubble continues to collapse, the issue is how do the Chinese contain this collapse event while continuing to support their global efforts and multi-national efforts to become a global economic leader?  Think about it and understand that China has expanded quite extensively over the past 12+ years on the support of the global central banks and US Fed.  The recovery efforts throughout most of the world have created an environment where China could attempt to expand with ease and allow their credit markets to expand without much risk.  Well, not that the world is changing direction and President Trump is attempting to settle trade and other issues – it’s a completely new playing field for the Chinese and for most of the world.  We believe the next few months could show further signs of weakness in the Chinese and Asian economies as well as, potentially, lead to an emerging market collapse before the end of this year.

Lastly, the US Dollar.  Yes, the trusty old GREENBACK.  It is not very difficult to explain or understand why the US Dollar will likely stay above 110~115 over the next few years and likely push a bit higher over the next few months.  All of the preparation by global economies to bring multiple national economies near par with the US economy (think the European Union and the efforts of China to bring the Yuan into the global market as a suitable currency), have resulted in what we have today – an expansive effort to bring foreign economies to near par basis levels against the US Dollar.  The attempt to accomplish this was based on a bias that existed 8+ years ago during the global economic recovery efforts and was based on the ability for “all economies” to achieve great success and develop renewed balance as a result of such efforts.

In other words, the intent was to create multiple base currencies that could be used in global transactions that were near par to the US Dollar – ideally removing the US Dollar as the only real stable currency for such transactions.

Yet, here we are – on the cusp of what could become a global divergence from these “best-laid plans” and on the verge of a greater level of debt contagion, credit defaults, margin calls, global political issues and global immigration issues as a result of these globalist biases.  Europe, China, Asia and dozens of emerging markets and European markets are having to defend themselves from the seemingly out of control liabilities and expenses with these globalist biases.  Just as we are seeing in Mexico right now, this defense is resulting in a populist/nationalist movement that could push the unraveling of these biases even further.

And what happens to the US Dollar through all of this?  Our belief is that the US Dollar will, again, attain and secure itself as the leading global currency with continued strength and security.  We believe a massive capital flight mechanism has already been active where foreign capital is rushing into the US markets in an attempt to avoid devaluation and risk factors.  We believe this will continue for at least the next 6~12 months as global issues continue to be resolved.


Please take a moment to review some of our other, older, research posts by visiting www.TheTechnicalTraders.com and seeing how we can help you stay ahead of the market and find greater success while trading.  Our members love our research, our predictive price modeling systems, our Daily video forecasts, ETF trade alerts, and more.  Our job is to help you become a more informed, and better trader.  We know you will be satisfied with our efforts and we urge you to become one of our valued subscribers today.


We’ve been warning our followers not to become frightened by price rotation in the US majors for months.  Our predictive analysis has been showing us the upside in this market is far from over and our most recent analysis of the global markets is showing us that emerging markets and many global markets may be “disconnecting” from the US majors in a dramatic price move.  See our most recent research posts for more on this potential crisis in the making.

Today, we want to alert you to the fact that the move in the US majors may not be over and we could be looking at many weeks or months of upside price bias with some 3~6% price rotations going forward.  As we’ve been trying to warn our followers, there are a bunch of “top sellers” in this market because many believe this market is well overextended and has already reached an Elliot Wave 5 completion.  Our analysis is saying this is simply incorrect and these professionals are failing to see the alternative perspective in the markets.  What if their “completed wave 5” is really just a larger “Wave A” formation or a completed Wave 3 or 5 – which would lead to much higher and longer upside price potential than anyone has imagined.

Still, with a bit of a chuckle, we read the news that some of these professionals were taking larger positions as “short sellers” and read their comments about “this is it – this is the top of the market”.  We posted our analysis and stood by our belief that this market continues to have upside potential and the reasoning behind our belief is relatively clear.  The global markets have been primed by more than $16 trillion in quantitative measures and many foreign and emerging markets have squandered the opportunity to secure solid fundamental economic opportunities for their future.  Very few global economies have the capacity for growth that the US and other mature/major markets have.  It is because of this current economic situation that the US and other mature/major markets will be viewed as the “only suitable economic investment on the planet” for a while and capital will continue to run into these markets as a source of protection and returns.

This ES (E-Mini S&P) chart (240 minute) shows the recent price decline over the past week that had many people very worried about a massive top formation.  You can see this decline was relatively muted compared to the previous upside move.  Over the past few days, the ES retested and broke above the downward resistance channel (in yellow) and is headed back towards the Price Resistance level just below 2800.  This price level is likely to be reached within a few days and breached as the ES, YM, and Transportation related markets should push dramatically higher over the next few weeks.


This NQ 240 minute chart shows the same time-span, yet it shows the dramatic upside price breakout in the technology, pharma, and small-cap related indexes.  Why are these markets a large driving force in this upside rally?  Because capital is searching for suitable investments in US equities for protection and gains.  Many of the FANGS and other major market symbols have already seen huge gains over the past 4+ year, yet there are hundreds of other suitable, less pricey symbols available in the realm of Small Caps, Technology and Biotech/Pharma and others.  Simply put, money is hunting for US based investment in suitable companies for simple reasons – protection from currency devaluations, protection from political turmoil and potential returns.  There is only one place to go, the US stock market.


Lastly, we want to warn our followers that the NQ may stall a bit in an upside bias over the next few days or weeks while the ES, YM, and Transport related equities see bigger gains over the same time-span.  It is our opinion that as this rally continues, the NQ will likely see a bit slower price acceleration as the DOW, S&P and Transport stocks pick up momentum.  We are not saying the upside move in the NQ is over.   We are suggesting that it may be a bit more muted going forward while other symbols pick up the slack and rally higher.

Our valued members get access to clear and direct predictive analysis using our proprietary Adaptive Learning price modeling systems.  This helps them know what to expect Days, Weeks and even Months in advance.  Our ADL price modeling system is telling us that our analysis future NQ price activity consists of 17 instances of correlative price data that average between 80% to 97% predictive probability of success going forward 20 price bars.  To simplify this for our readers, we have a future price analysis with an 85% to 95% probability of success given 17 instances of similar price data.


Our members are uniquely positioned right now to take advantage of this without excessive risk.  We will continue to evaluate new trades with regards to the potential for success while considering risk.  Our objective is to not overweight our positions too heavily into one aspect of the market.

Although, we will add that once confirmation of this move is evident, we may find multiple opportunities for quick profitable trades for our members.  Get ready for some exciting price action and for this next move which most people are not expecting.

Our articles, Technical Trading Mastery book, 3 Hour Trading Video Course, and our Trade Alert Newsletter are designed for both traders and investors to explore the tools and techniques that discretionary and algorithmic traders need to profit in today’s competitive markets. Created with the serious trader and investor in mind – whether beginner or professional – our approach will put you on the path to win. Understanding market structure, trend identification, cycle analysis, volatility, volume, when and when to trade, position management, and how to put it all together so that you have a winning edge.

Join Us This Weekend and Trade
Your Way To Wealth This Summer!

Well over a month ago we warned our followers of a “capital market shift” that was taking place in the global markets.  Nearly 3 months before that time, we warned that China’s economy was about to enter a sustained economic downtrend cycle that could be dangerous to the global markets.  Today, we offer further evidence that the global markets are, in fact, shifting away from a price correlation to the US Majors and this move could be a warning sign that emerging markets and global markets could lead the world into an extended stagflation cycle.

Think about this for a minute, as we briefly discussed in our last article, what would happen if the US markets continued to rally on a strong economy with strong consumer participation while the US Fed was slow to raise interest rates while supporting a transitional shift of the US economy towards more manufacturing, technology, and expectations?  How would the world’s economies react to such a shift given their current economic cycles and opportunities?  Would they be able to keep up with the US or would they start to trail further and further behind the US?

It is our belief that any continued strengthening of the US economy could, in fact, present real dangers for many of the world’s economies simply because they may fall completely out of sync with the US stock market as their currencies, economies and consumer expectations fail to keep up with the US capabilities.  How all of this will play out over the next few months/years is our concern.  We know it will result in some tremendous trading opportunities for investors, but it could also create a new class of undervalued assets that could present some real long-term opportunity over the next 20+ years.

Let’s start by taking a look at our China/Asia custom index to show how the past 60+ days have more clearly shown this price disconnect happening.  When you look at this chart, pay attention to how closely this custom index (the candles) have moved in relation to the SPY (the blue area chart overlaid onto the candles).  Notice how the moves in the SPY were relatively closely mirrored by the custom index.  This is a direct price correlation to the SPY over an extended period of time.

Now, focus on the last 6~9 bars on this chart and take a really close look at how the SPY has rallied higher while this custom index has stayed flat to lower over the same time frame.  The only answer for this type of price disconnect is that a global capital shift could be underway that is driving capital out of certain markets and away from risk and danger.  In other words, it is our opinion that the China/Asia markets are starting to be perceived as riskier and more dangerous in relation to the US market and other more mature markets.


Now, let’s take a look at the BRICS custom index.  YIKES!!  What happened here?  Through most of 2017, a price correlation can be seen where the BRICS index moved somewhat in unison with the SPY price activity – although in some cases a bit delayed.  Yet, after March 2018, something dramatic happened.  When the SPY rotated lower in late March 2018, the BRICS index stayed relatively flat near the highs.  Then in May 2018, a price disconnect became very evident as the SPY began to rally while the BRICS index began to sell-off – very dramatically.  The BRICS index also broke through the BLUE price channel recently which is another sign that price trends/activities have shifted.


You should now be starting to see what we have been warning you about for months – the global capital market shift that is taking place.  This is happening because mature nations and economies are capable of achieving great economic growth and stability than many foreign markets and because many foreign markets have squandered the last 10+ years attempting to expand externally and not support their fundamental economic needs.  As we have used this example before, a flower only has two modes of operation – flower mode (expand) or survive (keep the core plant alive).  We believe these foreign markets have been in “flower mode” for the past 10+ years and have failed to support the core elements of their economies.

Now, onto more examples, this time Western Europe.  Again, this custom index is weighted with the SPY, so it should reflect some of the price support of the recent uptrend.  Yet, we see the most recent few weeks of this chart have shown a dramatic downtrend?  This would indicate that the European markets/currencies are disconnecting from the US majors at a much more dramatic pace, recently, that they have been over the past few years.  Yikes!


What about India & SE Asia?  Our custom India index has shown relatively FLAT recent price activity compared to the SPY.  Overall, our opinion is that India has yet to completely diverge from the US majors and we urge all investors to be aware that any further price breakdown in this India custom index will warn that the Indian/SE Asian economies are losing their battle to stay correlated to the US markets going forward.  Right now, there is evidence of weakness in the India custom index – yet there are limited signs of a broken correlation to the US markets.  It certainly shows that this price disconnect could be happening and likely is happening – yet we don’t have clear signs that this custom index is breaking to new lows (yet).


Lastly, lets take a look at our Russia/Eastern Europe custom index for signs of a price disconnect.  This chart is somewhat similar to the India chart (above).  There are signs of weakness and downside price rotation while the SPY has been rallying, yet there is not massive disconnect evident on the right edge of the chart.  We believe the recent downside price rotation within this custom index are the early warning signs of a price disconnect in the early stages of setting up (just like in the India chart).  We believe these charts clearly show that the US market (and other mature economies) are advancing beyond the functional capabilities of many emerging and foreign markets.  What will come from this, if it continues to play out as we expect, is a huge number of opportunities for traders and investors.


The next 3 to 5 years are likely to be very interesting and exciting for traders and investors.  These types of moves don’t happen too often and should these markets continue to rotate as we are expecting, we could see some very big currency and foreign market moves over the next few months and years.  You owe it to yourself to stay ahead of this move and learn how to profits from the extended volatility that will likely result from this price disconnect.

We believe we have nailed this analysis as we have correctly called the weakness in China/Asia as well as the global capital shift that is starting to play out in the global markets.  We already know what will likely move and when we should expect these opportunities to set up.  We are preparing our valued subscribers for this move and protecting them by providing them even more detailed research and analysis than you are seeing here.  Visit www.TheTechnicalTraders.com to learn how this could be the biggest opportunity of your trading and investing life and how you need a qualified and dedicated team of researchers to help you stay ahead of these moves over the next 2+ years with our long-term discounted subscription plan and Save 39%.  There will come a time when you will be wishing you had access to our proprietary research and member-only trade alerts and investment positions. Become a technical trader today and prosper with us!

Chris Vermeulen
Technical Traders Ltd.

Our articles, Technical Trading Mastery book, and 3 Hour Trading Video Course are designed for both traders and investors to explore the tools and techniques that discretionary and algorithmic traders need to profit in today’s competitive markets. Created with the serious trader and investor in mind – whether beginner or professional – our approach will put you on the path to win. Understanding market structure, trend identification, cycle analysis, volatility, volume, when and when to trade, position management, and how to put it all together so that you have a winning edge.

Become A Technical Trader With Chris Vermeulen

and Receive His Trade Daily Analysis & Trade Alerts!

As we all know a picture says 1000 words, which is one of the reasons why I gravitated to trading using technical analysis. I can look at a chart and in seconds understand what price has done and is likely to do in the near future, without knowing a single thing about the company, index, or commodity. Why spend time reading news, financial statements, and other opinions when you can fast-track the entire process with a chart.

So, let’s just jump into the 30-minute chart of natural gas which shows the regular trading hours 9:30am – 4pm ET.

Natural Gas 30-Min Chart with Oversold and Trend Analysis

This chart could not be any more simple. Green bars and green line mean price is in an uptrend and you should only look to buy oversold dips. We got long a 3x natural gas ETN on May 3rd right near the dead low. After a few weeks, price action and longer term charts started to signal potential weakness, so we closed out the position for a simple 32% profit.


UGAZ 3X  Leveraged Natural Gas Fund

Here is 240 minute (4-hour) candlestick chart of the natural gas fund.


53 years experience in researching and trading makes analyzing the complex and ever-changing financial markets a natural process. We have a simple and highly effective way to provide our customers with the most convenient, accurate, and timely market forecasts available today. Our stock and ETF trading alerts are readily available through our exclusive membership service via email and SMS text. Our newsletter, Technical Trading Mastery book, and 3 Hour Trading Video Course are designed for both traders and investors. Also, some of our strategies have been fully automated for the ultimate trading experience.

Become a technical trader today and profit!

Closing out a big week in the markets, we see the US markets rotating a bit lower after a number of news events.  Some of these were very positive and others were negative.  The take away from last week can be condensed into the following:

The US Dollar strengthened all week and shot up above $120 near the end of the week

_  Crude Oil tanked on Friday – falling nearly 3% to just below $65.00 ppb

_  EURUSD fell nearly 2% on QE concerns in Europe as well as trade issues that are mounting

_  Silver rotated lower on Friday (-4.5%) as new tariff announcements between the US and China hit

_  US Small Caps held up quite well throughout most of the week ignoring these news events

The NQ closed higher for the week while the ES (flat) and YM (lower) were mixed to lower overall

China appears to have already entered a downward economic cycle and we’ll have to watch to see how deep this move can actually go before getting too far ahead with our analysis.

When we take into consideration the currency and commodity moves last week, there are two things we can assume headed into this week and beyond.

First, the US Dollar strength will create certain levels of havoc for emerging markets and foreign manufacturing firms, yet the strong US dollar will likely act as a magnet for global investors to continue to pile into the US Equity market rally.

Secondly, the downward rotation in Oil and Metals may create some broad economic pressures in foreign markets that could play out over the next few weeks as fantastic opportunities for skilled investors.

Lower Oil prices puts pressure on foreign oil suppliers, foreign currencies and many emerging markets.  The supply glut throughout the world right now is something that will not likely vanish any time soon.  This extended pressure on foreign markets may present a potential for some bigger price moves in ETF and certain global markets over the next few weeks or months.

Gold and Silver, on the other hand, appear to be running what we have termed a “rope-a-dope” pattern.  Our analysis shows the Metals are poised for a bigger upside breakout move – but this move would likely coincide with some bigger news event that creates broader concern in the global markets.  The move high last week started us thinking that this could be a new upside leg forming to create a new near-term price high.  But Friday’s pullback was just enough to neutralize the momentum of the upside move (for now).  We would not be surprised to see another upside move early over the next few weeks as this pullback may be reactionary in nature and not fundamental.

There are so many dynamics at play right now with trade issues, economic fundamentals, Fed/Central Bank moves and commodities moves all rotating in broad ranges.  Our recent analysis has been almost perfect in terms of the Oil moves, the Metals moves and the US Majors price advance.  As of right now, nothing has really changed with our analysis and we believe most of the price swings this week were purely reactionary in nature.

Our continued belief is that the US market is really the only game on the planet with a strong US Dollar and a strong/growing economy.  Oil pricing concerns will likely result in emerging market and currency issues that could continue to drive investment into the US markets.  Gold and Silver will likely continue to play the “rope-a-dope” congestion pattern with a slightly upward price bias until some massive news event sends it skyrocketing higher.  US Blue Chips and Small Caps will likely resume their upward trends quickly by taking out recent price highs and stunning the shorts/top-callers again.  When you get down to the bottom line of these big news weeks, after all the dust settles – most of the time the core economic fundamentals are the real momentum of the markets.  These news events are ripples in price caused by an external force. They go away after a short period of time and the fundamentals kick back in to drive future price moves.

Assuming nothing big hits the news wires to cause any further external events, we believe the US markets will quickly begin to recover their previous trends (higher) and oil will continue to drift lower (to near $60 first, then lower) while Gold and Silver begin to form a new price base for another attempted move higher (again).  World leaders are attempting to do all they can to keep the train on the tracks and are stunned at the growth and success of the US economy/markets.  Their biggest issue is that they may become second or third tier economies in comparison to the US.  All of these dynamics, which are actively playing out right before our eyes, currently are driving capital into the US in an effort to avoid what appears to be a bottomless pit of economic uncertainty in many other nations.  This, we believe, is the core dynamic at play in the global markets and we are watching for any signs that some new contagion may set in to change this dynamic.

Our suggestion is to take advantage of the opportunities that are currently available to skilled traders and try not to be too greedy.  As we learned, recently, from the EURUSD price drop – these events can unfold very quickly and foolish trading can sometimes put you in very risky positions.  We believe it is more suitable for skilled traders to take advantage of larger swing trading opportunities right now and to avoid the high-risk trades.  There will be lots of time for those types of trades when the global economic environment settles down a bit more.

53 years experience in researching and trading makes analyzing the complex and ever-changing financial markets a natural process. We have a simple and highly effective way to provide our customers with the most convenient, accurate, and timely market forecasts available today. Our stock and ETF trading alerts are readily available through our exclusive membership service via email and SMS text. Our newsletter, Technical Trading Mastery book, and 3 Hour Trading Video Course are designed for both traders and investors. Also, some of our strategies have been fully automated for the ultimate trading experience.

With the G7 meeting concluding and the world about to start reacting to what was said and what was heard, it is time to take a look at the Crude charts with our Advanced Fibonacci price modeling system.

Our research team, at www.TheTechnicalTraders.com, believes Crude will continue to drift lower over the next few weeks testing the $60 ppb level before breaching this support level and ultimately targeting $58 or lower.  Lacking a real resolution to the trade and other global issues, we believe continue global economic pressures will drive oil prices dramatically lower over time – at least through the Summer months.

This Monthly Crude Light chart shows our Advanced Fibonacci price modeling system at work.  As of right now, we see a recent price rotation top (highlighted by the RED DOWN TRIANGLE) near the right edge of price as well as the RED and GREEN Fibonacci projection levels near $69.50.  These projection levels indicate that the $69.50 level is likely resistance.  Notice the BLUE and CYAN Fibonacci projection levels near $58.00 ppb.  The fact that these two levels nearly overlap one another indicates that the $58.00 ppb level is a key price level for current support.  Obviously, the ultimate downside target, near $14.00 ppb, is an extended downside level that could happen – but is not likely till all other levels a breached with downside price activity.

Currently, as long as the $60.00 ppb is not breached, the Monthly Fibonacci price modeling system trend is “Bullish” and a move to below $58.00 would change the trend to “Bearish”.  As we stated, the $60.00 price level is critical going forward on this Monthly chart.


This Weekly Crude Light chart paints a shorter-term price picture and clearly highlights the most recent price decline with a clear sell trigger near $69.00.  Take special notice of the Fibonacci upside targets between $54 an $58 near the right side of the chart.  These upside targets, because the price is moving lower from above and has breached the Bearish Price Trigger Level (RED), are now downside target levels.  With no real support between the current price and the $58.00 level, we expect oil to continue to fall to near the $58.00 level before finding some support – possibly as low as $54.00.  Ultimately, if these levels don’t provide sufficient price support, oil prices could fall back to near $45 ppb before finding any real support – a -30% decrease from current price levels.


One thing that we find interesting is that the ERY (Energy Bear ETF) has yet to reflect any of this concern.  Yes, we can see some price support near the right edge of this Weekly ERY chart, yet it appears the general market is not factoring in the gap in support below the $58.00 price level – meaning ERY could see a big jump higher on any price breakdown in Crude prices.  How big?  Our research team believes this move could be greater than 70% ROI from current levels if our predictions are correct.  A breakdown from current levels to below $55.00 ppb in Crude would likely cause ERY to rocket above $60.00 per share from the current price levels near $32.50.


To be clear, Crude is poised to retest the $60.00 ppb level before attempting to find support near $58.00.  If this support fails, then expect Crude to fall to near $54.00 ppb before finding support.  This move will likely cause ERY to rocket upward to well above $50.00 on a short-term move (possibly higher).

Watch for news this week regarding oil supplies and the G7 aftermath.  We are certain the news cycles will provide some hints as to the future economic cycles and expectations for the Summer months.  We believe the supply glut and current trade issues are causing concerns in trade and transportation activities, thus we believe the downside move in Oil is almost inevitable at the moment.  Great supply, diminishing demand, and global trade/economic concerns will likely push Oil prices back below $55 within the next 30~45 days.

Stay aware of these fantastic trade opportunities by visiting www.TheTechnicalTraders.com and learning how we can help you stay ahead of the markets with our advanced predictive modeling systems, expert research, daily video content and detailed trading signals.  Our proprietary research is second to none – you won’t find these tools or capabilities anywhere else.

Visit www.TheTechnicalTraders.com to learn how we’ve called nearly every move in the markets this year and continue to astound our members with our detailed research.  Opportunities exist for profits every week – it is simply a matter of finding them and executing them.

JOIN THE WEALTH BUILDING NEWSLETTER NOW
AND KNOW WHAT WILL HAPPEN TOMORROW!

As the world continues to see economic improvements, specifically within the US and major global markets, Gold and Silver are relegated to an after-thought by investors.   Why consider Gold or Silver when the NASDAQ or S&P leaders are rallying 2%+ per week?

Well, the recent G7 meeting and President Trump’s meeting with Kim Jung Un in Singapore may spark a little interest in these shiny metals as they setup a “rope-a-dope breakout” for those not paying attention.

One of the easiest components of Fibonacci price theory is the concept that “price must always attempt to establish new price highs or new price lows within price rotation – ALWAYS”.  For those of you that are familiar with our research, visit www.TheTechnicalTraders.com if you are not, you know that the lack of new price highs indicates a downward trend may have formed.  Conversely, a lack of new price lows indicated an upward price trend may have formed.  With this in mind, let’s take a look at this Monthly Gold chart.

Please notice that the recent price lows, originating near the start of 2016 all the way through current price activities, are continually higher.  Even the current price rotation, near the right edge of the chart, is still higher than the previous low price rotation near the middle of 2017.  Ladies and Gentlemen, we have an uptrend already in place in Gold.  The “rope-a-dope breakout” that we are suggesting is right around the corner is the potential for a $1370 price break that has been setting up since June 2016.

Our proprietary Fibonacci price modeling system is showing us the current price trend is BULLISH and that support is near $1250.  Additionally, the newest Bearish Price Trigger level, near $1124, is a result of extended price rotation and lack of clear price trend (the “rope-a-dope” setup).  This has lulled many metals investors into thinking any price breakout may never happen if the global economy continues to strengthen.


Well, we’re here to tell you that this price breakout may be less than 30 days away from now and the key to any potential move will originate in the global fear that may continue to grow as the world’s leading economies continue to spar over trade, economic cooperation and fair opportunities going forward.  Nearly 3 months ago, we authored a detailed research piece on China and the fact that China and SE Asia were entering an economic malaise cycle.  The recent elections in Malaysia may have changed this perspective a bit, but the core economic cycles have not likely changed much.  We believe Gold and Silver are setting up for breakout of the $1370 price level with the potential to rally to near $1430~$1463 within the next 3~5 months – +11.5% or more.


Silver, the other shiny metal, is the one investment that many have overlooked and the chart proves why this is the case.  This Monthly Silver chart shows that silver has been trapped in a sideways trend for months.  The price low, set in early 2016, is a critical low point regarding future price analysis.  From this point, we are able to establish price waves, counts and other key factors of future price activities.  Our proprietary Fibonacci price modeling system is showing use that the price of Silver MUST rally above $19.50 to qualify for a new BULLISH price trend.  Currently, the price of Silver is $16.82.  This means the price of Silver MUST rise by more than 16% to establish a new BULLISH trend.  Hmm…


Think about that for a minute..  Gold has already shown a Fibonacci Bullish price trend is in place and a breakout is nearly upon us.  Silver is showing a similar setup, but is telling us that price has to move upward by more than 16% to establish a new bullish price trend whereas Gold only needs to move higher by about 8% for the same outcome.  Either way, if Gold moves higher by greater than 8% and Silver moves higher by greater than 16% from current levels) – that is a GREAT TRADE.  The upside potential after that is even better.

The price rotation required to achieve this upside breakout is likely to play out over the next 30~45 days or more.  Remember, we’re calling this a “rope-a-dope breakout” because we believe this will be a sleeper move to the upside.  Gradually climbing over the next 30+ days and gradually building up momentum till a massive upside breakout move takes place.  By then, these lower price levels will be gone and the upside move will already be taking place – catching many traders flat-footed.


There has been talk that many big players are setting up short positions in the US markets (financials and others). We believe this could be a disaster waiting to unfold should the global markets play out as we expect.  Yes, fear of some economic issues will continue to drive Gold and Silver higher, but we believe the US market is somewhat immune from this debt concern because it is really the only game on the planet to generate returns and opportunities.  Things can change, but for right now, expect Gold and Silver to continue to rotate higher and watch for Silver to start moving at 1.5x or 2.x that of gold as the breakout takes place.  This “rope-a-dope breakout” is setting up to be a fantastic trading opportunity for those able to see it unfolding.

Stay aware of these fantastic trade opportunities by visiting www.TheTechnicalTraders.com and learn how we can help you stay ahead of the markets with our advanced predictive modeling systems, expert research, daily video content and detailed trading signals.  Our proprietary research is second to none – you won’t find these tools or capabilities anywhere else.  Visit our Wealth Building Newsletter today to learn how we’ve called nearly every move in the markets this year and continue to astound our members with our detailed research.  Opportunities exist for profits every month – it is simply a matter of finding them (that’s what we do) and you just execute the trade setups.

Join the Wealth Building Newsletter Now

and Know What Will Happen Tomorrow!