After last weeks closing bell for stocks and the early signs of the Capital Market Shift which we mentioned previously was taking place are now clearly evident. We wanted to alert all of our followers that this week could be very dramatic with a number of key events playing into global expectations.

Our research team at Technical Traders Ltd. have been combing through the charts trying to find hints of what may happen and what to expect in terms of price volatility next week.  We know our ADL price modeling system is telling us that certain price weakness will continue in certain sectors and strength in others – but we are searching for the next opportunities for great trades.

One of the key elements of the G7 meeting is the continued communication regarding global participation in key infrastructure projects and national cooperation in regards to economic stability.

Over the past 8+ years, the bulk of the global recovery has been based on the US economic stability and recovery.  US interest rates allowed for a global “carry trade” that supported a large component of the economic bias in foreign countries.  Additionally, the deeply discounted US bonds provided a “fire sale” opportunity for many countries to secure US Treasuries at a time when global central banks were printing cash to support failing economies.  Overall, the economic conditions from 2009 to 2015 were such that every opportunity was provided to the global markets to make it easier to attempt a proper recovery.

Some nations were able to capitalize on this environment while others squandered the opportunity to create future growth, capabilities and new opportunities for success.  Given the current global market environment, we expect some harsh comments to come from the G7 meeting as well as some wishful thinking comments.  Overall, we believe the outcome of the G7 meeting will become a defining moment for the remainder of the year in terms of global economic expectations and forward intent.  It will certainly be interesting to see how these leaders decide to operate within the constructs of the ever-changing global market liabilities to say the least.

Right now, a lot of concern has been directed towards the Emerging Markets and what appears to be a near term market collapse.  Debt spreads and global indexes have been moving in a pattern that clearly illustrates the Central Banks problems in containing the diverse economic conditions throughout the globe.  Infrastructure projects, social/political shifts and currency valuations are complicating matters by creating extended pressures in many global economies recently.  All of this centers around the strength of the US economy and the US dollar as related to expectations and valuations of other foreign economies and currencies.

Almost like a double-edged sword, as the US economy/dollar continues to strengthen, foreign capital will migrate into these US assets because of the inherent protection and gains provided by the strength and growth of these markets.  While at the same time, the exodus of capital from these foreign markets create a vacuum of value/capability that results in a continued decline in asset valuations and more.

Almost like the 1994 Asian Currency Crisis, the more the US economy strengthens, the more pressures the global markets feel as valuations and assets become more risky to investors.  As investors flee this risk, they search for safe returns and value that is found in the US economy/Dollar – driving US equities higher and strengthening the US Dollar.  It is a cycle that will likely continue until some equilibrium point is reached in the future.

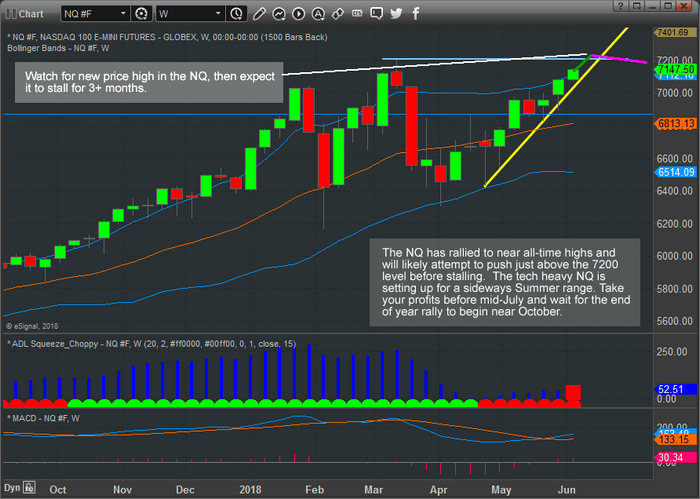
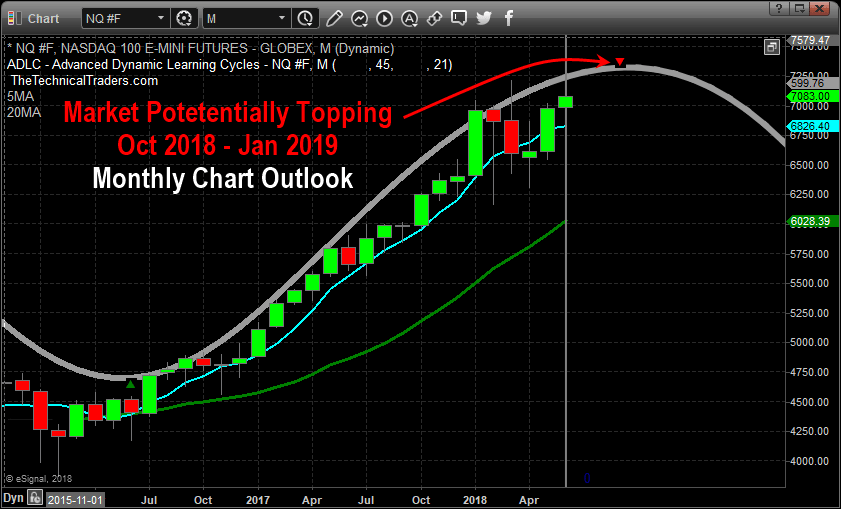
The US markets are on a terror rally because global capital is searching and seeking the greatest returns possible – and the only place on the planet, right now, that is offering this type of return is the US economy and the US equities market.  Our recent research shows that the NASDAQ indexes may stall and rotate over the next few months as price valuations have accelerated quite far and because the blue chips are relatively undervalued at the moment.  This means, capital will likely continue to pour into the S&P and DOW heavyweights as this capital shift continues to play out.

The G7 meeting, in Toronto, this week will likely present some interesting outcomes.  Early talk is that the G6 nations (minus the US) may enact some deal that they believe would be suitable for these nations going forward.  Our concern is not the deal or the threat of these nations trying to engage in some deal without the US – far from it.  Our concern is that their wishes may be grandiose and ill-timed given these currency and valuation issues.

Imagine, for a second, the G6 nations engage in some grand scheme to engage in something to spite the USA.  Some plan that seems big and bold and over the top.  Yet, 5 months from now, debt issues plague these nations, currency valuations have destroyed any advantage they may have perceived they had and the member nations are beginning to feel the pressures of their own entrapment.  What then?  The USA to the rescue (again)?

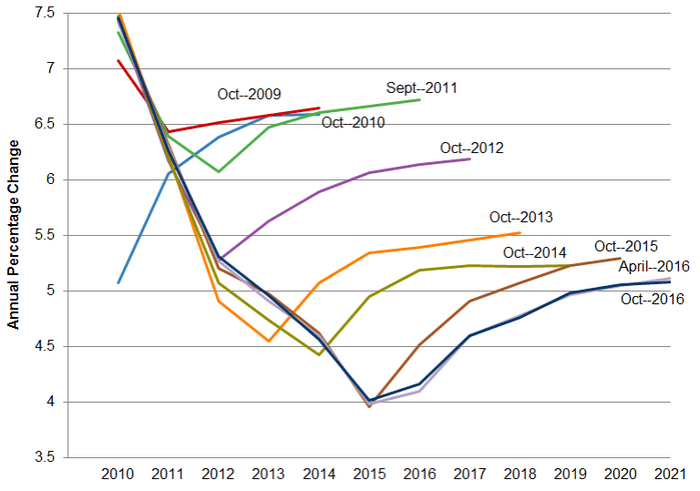
Recently, Ben Bernanke, a Senior Fellow at The Brookings Institute, warned that Donald Trump’s economy was like a Wile E. Coyote going over a cliff.  Everything seems well and fine till the road ends and the cliff begins.  I would like to remind all of our readers that The Brookings Institute does not have a stellar record of predicting much of anything over the past 10+ years.  Take a look at this graph showing the economic expectations and predictions from The Brookings Institute over the past decade or so.  Do these people seem capable of accurately predicting anything regarding the US or global economy?


Now, ignoring all of the what-if scenarios that are being presented by different people.  The bottom line is that the next 6+ months are going to be very exciting for traders and investors.  There are huge issues that are unfolding in the global economy right now.  Currency levels are about to be shaken even further and the G6 nations, by the time they complete their high-priced dinners and evening events, will walk out of the G7 meeting staring down a greater global debt/currency/economic beast of their own creation.

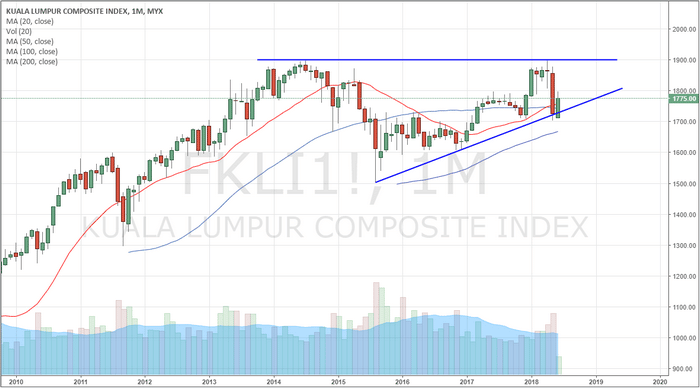
SE Asia is in the process or rewriting and resolving issues of the past 10+ years (see Malaysia/Singapore).


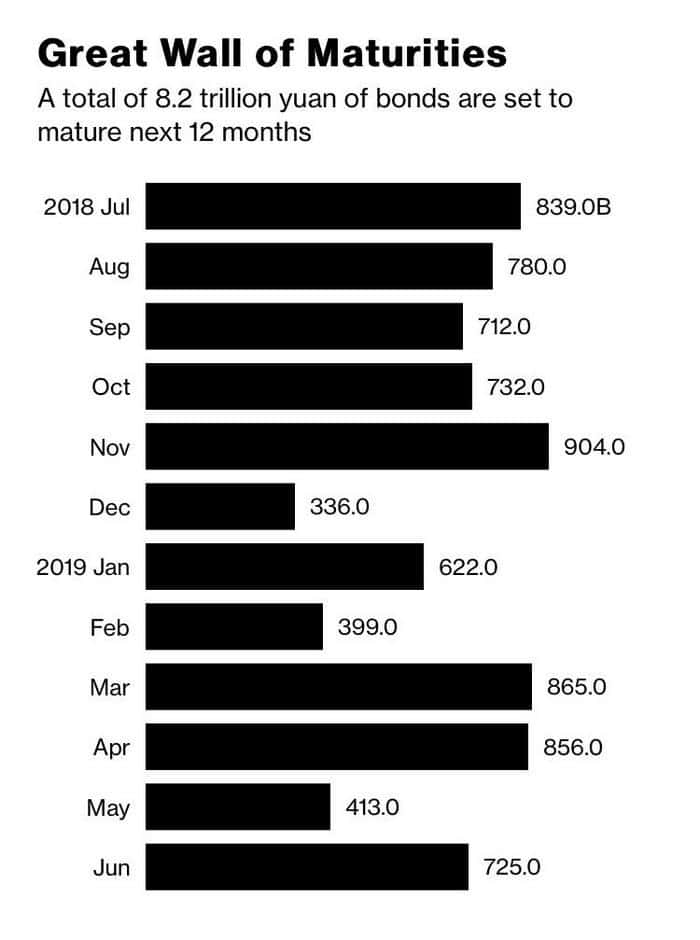
China is in the midst of a massive debt cycle that is about to play out over the next 18+ months (totaling about 1.8 Trillion Yuan).

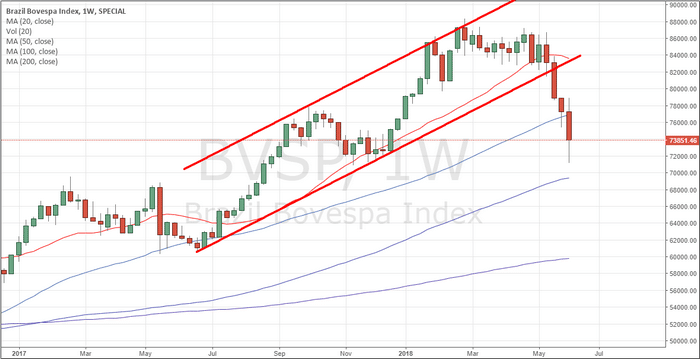
The Brasil Bovespa Index has rotated into new BEARISH territory.


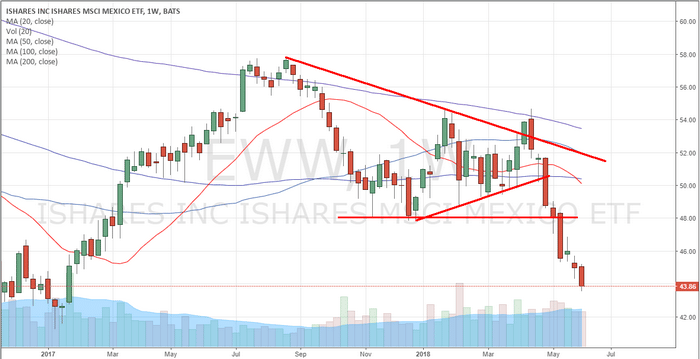
The Mexican iShares (EWW) ETF is about to break multi-year lows.


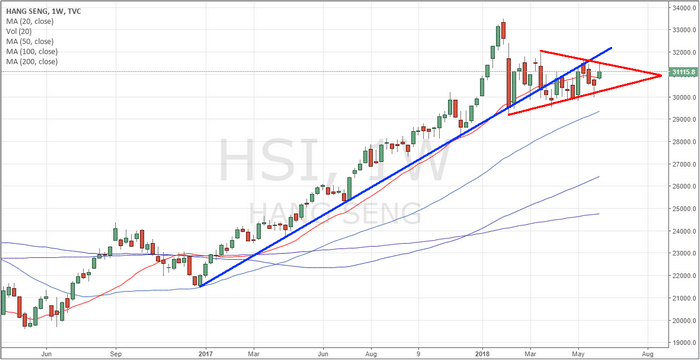
The Hang Seng Index is setting up a possible topping pattern that could break down given state and corporate debt concerns.


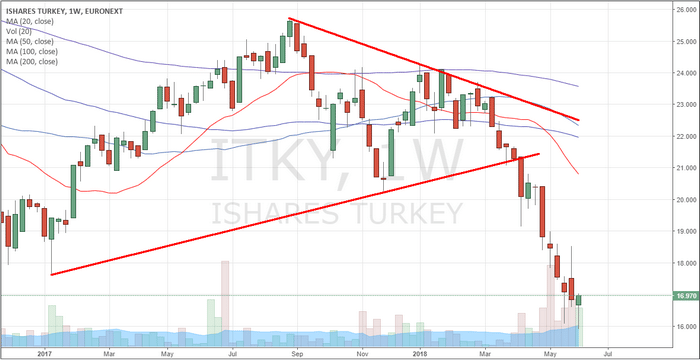
The iShares Turkey (EURONEXT) index has already broken to new multi-year lows.


The G6 better have some rabbits in their hats that they can magically transform into big bullish projects over the next 12 months or the economic functions that are at play in the world already are likely to steamroll over the top of any news that originates from the G7 meeting.

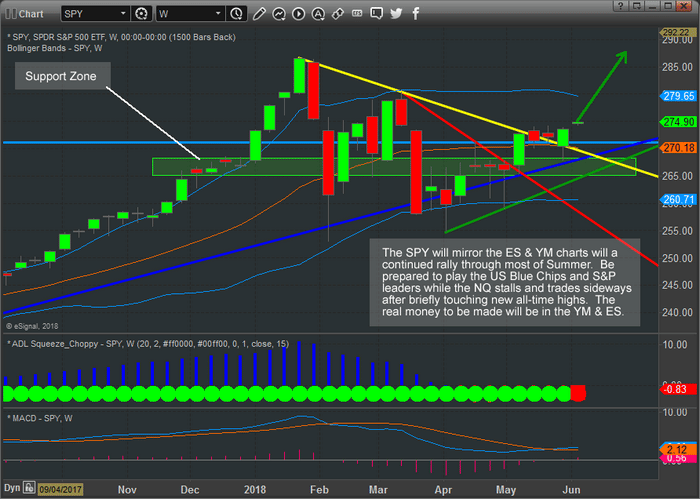
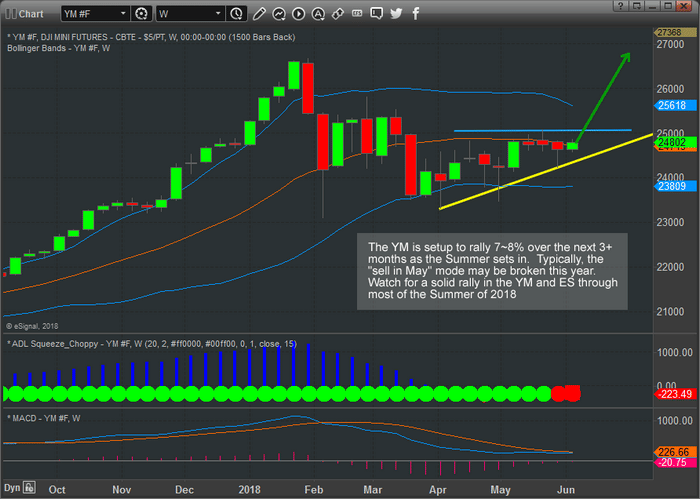
The US markets are setup for a continued bullish rally with a bit of Summer capital shifts.  Our recent research called the rotation out of the tech-heavy NASDAQ and a renewed capital shift into the S&P and the DOW leaders.  This rotation is likely to continue for many weeks or months as global investors realize the earnings capabilities and dividends values within the US blue chips are of far greater long term value than the risks associated with technology and bio-tech firms.  Because of this, we believe the S&P and DOW/Transports are setting up for a massive price rally to break recent all-time market highs.

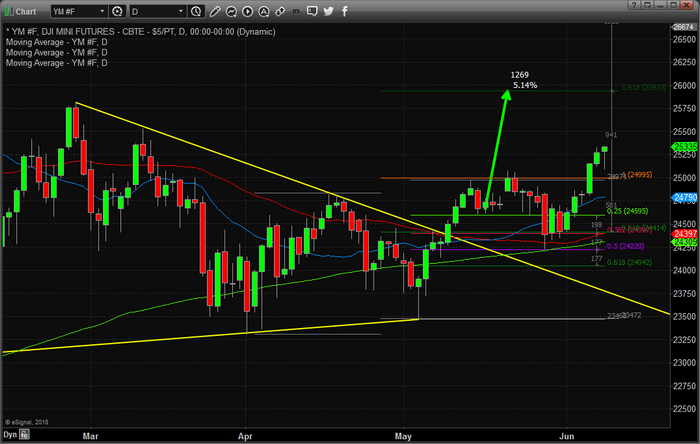
Here is a Daily chart of the YM futures contract showing the recent price breakout and rally.  Our expectation is that 26,000 will be breached within 30 days or so and that a large capital shift will drive a continued advance through the end of 2018 – possibly further.


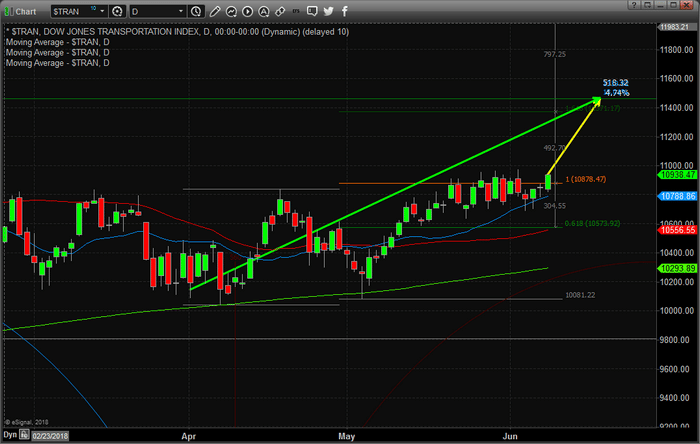
Here is a Daily $TRANS chart showing a similar bullish move.  Although the Transportation Index has not broken to new highs yet, we believe this upside move is just beginning and we believe the continued improvements in the US economy will drive the Transportation index to near 11,450 or higher before the end of this year.


Our opinion continues to support the hypothesis that the US markets are the only game on the planet (at the moment) and that a great capital shift is underway in terms of investment in, purchases of and generally opportunistic investment opportunities for US equities and markets going forward.  Until something changes where the US dollar strength, foreign economic weakness and foreign debt cycles are abated or resolved, we believe the great capital shift that we have been warning of will continue which will put continued pressures on certain foreign markets and expand debt burdens of at-risk nations over time.

Smart traders will be able to identify these opportunities and capitalize on them.  They will see this shift taking place and take advantage of the opportunities that arise for quick and easy profits.  If you like our research and our understanding of the global markets, be sure to join our premium research and Trade Alert Wealth Building Newsletter. Our valued members stay with us because we have continually proven to be ahead of nearly every market move this year – in many cases many months ahead of the global markets.  So, with all of this playing out over the next 6+ months, we suggest you consider joining www.TheTechnicalTraders.com to learn how we can help to keep you out of trouble and ahead of the markets for greater success.

Become A Technical Trader Subscriber Today

and Profit Consistently from Market Movements!

Our 53 years experience in researching and trading makes analyzing the complex and ever-changing financial markets a natural process. We have a simple and highly effective way to provide our customers with the most convenient, accurate, and timely market forecasts available today. Our stock and ETF trading alerts are readily available through our exclusive membership service via email and SMS text. Our newsletter, Technical Trading Mastery book, and 3 Hour Trading Video Course are designed for both traders and investors. Also, some of our strategies have been fully automated for the ultimate trading experience.

BECOME A PROFITABLE TECHNICAL TRADER TODAY

WITH OUR WEALTH BUILDING NEWSLETTER!

While the US majors continue to push higher through recent price rotation levels, the IWM (Russell 2000 ETF) is showing investors where strength lies in the markets.  Recently, we issued a research report showing that a massive dynamic shift is beginning to take place in the US market that provides an incredible opportunity for investors.  Now, we have further proof that this shift is well underway and is likely much further along than we initially expected.

The Russell 2000 is one component of the US market that often reacts to market strength and weakness a bit differently than the S&P, DOW or NASDAQ index.  The reason for this is that the Russell 2000 index makes up a broader scope of trading symbols that represent a greater chunk of the total market segment.  The US majors don’t always follow the Russell 2000, but when the Russell 2000 index breaks recent all-time highs on a broad push higher – we need to pay attention.

Investors need to be very aware that most of the market believes the recent Feb 2018 price rotation setup a completed Elliot Wave 5 TOP.  Yet, we believe this analysis is incorrect and we believe the markets are setting up for an extended Wave C or compounded Wave C that will drive market prices much higher over the next few months.  The fact that the IWM (Russell 2000) has breached recent all-time highs and is now pushing into uncharted high price territory is critical to our understanding of the future price moves for the US Majors.

With the Russell 2000 driving upward price action, clearing recent high price peaks and closing May with an incredible upside price move, we look to our advanced price modeling systems to help us understand the potential future price moves.  This next chart shows our Fibonacci predictive price modeling system and clearly shows the “Fib Target Zones” near the right side of this chart.  Current prices are already near these target zone levels – yet they can extend well beyond these levels when price dynamics “expand”.  Therefore, should the upside trend expand as we expect, we believe the upside potential in the IWM to be at least 15~20% higher from these current levels.


This SPY chart showing our proprietary Fibonacci predictive price modeling system shows what we believe to be the correct Elliot Wave count and shows “C3” where the current price peak/high price rotation exists.  We believe this rotation is not a completed wave 5 – but a compound wave C that will continue higher to form a full 5 leg wave C move.  If we are correct, this market has at least 15% more to the upside and the S&P and DOW stocks will likely be the big winners in this move.


Our recent analysis suggested that a massive capital shift is taking place in the US markets where the NASDAQ may be nearing a temporary price peak and where the S&P and DOW stocks may still have room to run.  This shift indicates that the blue chips and S&P leaders may be the big runners over the summer months.  Currently, Russell 2000 leaders may also benefit from this move given this recent research.

You won’t want to miss the opportunities this move presents and the potentially massive “short squeeze” that is setting up.  Visit our website to learn how we can help you navigate these markets and stay ahead of the markets to create opportunity.  If we are correct, this upside leg will put great pressure on some of the biggest names in the business because they have completely missed this expanded Elliot Wave formation and are shorting the market in the billions.  When this breaks, it could break very hard to the upside.  Join www.TheTechnicalTraders.com today to take this opportunity and turn it into success.

Our 53 years experience in researching and trading makes analyzing the complex and ever-changing financial markets a natural process. We have a simple and highly effective way to provide our customers with the most convenient, accurate, and timely market forecasts available today. Our stock and ETF trading alerts are readily available through our exclusive membership service via email and SMS text. Our newsletter, Technical Trading Mastery book, and 3 Hour Trading Video Course are designed for both traders and investors. Also, some of our strategies have been fully automated for the ultimate trading experience.

BECOME A PROFITABLE TECHNICAL TRADER TODAY

WITH OUR WEALTH BUILDING NEWSLETTER!


Chris Vermeulen

Our proprietary predictive modeling systems are showing us a core market dynamic that many people are completely unaware of right now.  We are going to show you something in this post that is so valuable that you won’t believe we are sharing it with you.  Why are we doing this you might ask?  Because we want you to think about how different your daily trading routine would be like as a member of Technical Traders Ltd. and how our specialized research and proprietary modeling systems can assist you in staying ahead of the markets.

If you’ve followed any of our previous analysis posts, you already know we called this market bottom as it happened, over 60 days ago.  You also know we’ve been predicting the markets to rally in an attempt to breach the all-time market highs for the past 40+ days.  Now, you are going to learn what the markets are going to do over the next 3~5+ weeks as a dynamic price valuation shift is starting to unfold.  If you want to see what the markets are going to do all the way into early 2019, then join www.TheTechnicalTraders.com and learn how we can help to keep you ahead of these market moves and learn how we can help you find profits every week.

Here we go..

Right now, as we understand it, a number of institutions and professional traders are watching the global markets for any immediate signs this market will rotate lower and potentially crash.  Many institutions are betting that the foreign markets and the US market is overextended and may collapse.  Yet, our proprietary analysis and price modeling systems are showing a completely different picture for the next 6~9+ months.  You are about to learn how and why you want to focus your trading on specific sectors over the next 4~6 months.

Recent price action in the US majors has been a bit lopsided into the tech-heavy NASDAQ.  Because of this, the other US majors have now seen the types of price advances that our predictive modeling systems have predicted.  The NQ has advanced substantially as we believe a unique capital flight is taking place where foreign capital is rushing into the US markets chasing profits and earnings.  The general consensus is that investing in technology firms will provide the best returns.  Well, this may not be the case over the next few months and we believe the real opportunity lies in the Blue Chips and S&P sectors.

This NQ Weekly chart shows that the NASDAQ has nearly rallied to above all-time price high levels and has little more than +1% to go before testing/breaching these levels.  Granted, the move in the NQ has been impressive and we believe the primary factor in this move is the rush of capital entering into the technology and biotech markets that make up the NQ sectors driving this rally.  Our price modeling systems suggest this move is nearly over and the NQ will likely consolidate and rotate over the next 3 months.

This leads us to believe that capital will shift from the technology and biotech-heavy NASDAQ to the other US sectors that have underperformed recently.

This SPY weekly chart shows what we believe is the underlying shift that is taking place.  While the NQ has rallied to near all-time highs, the SPY has just recently begun to advance above recent rotational highs.  With a strong support zone near $255 and all-time highs near $268.60, the SPY has a potential for a +4.5% price rally to reach these recent all-time highs.

This YM chart shows a similar setup to the SPY.  With support near 24,450 and a clear upside sloping price channel, the YM chart shows a potential for a +7~8% upside price move before reaching near all-time highs.

We believe a pricing valuation shift will begin to occur in the US majors over the month of June where the NQ rallies to just above the all-time high levels, stalls and rotates over the Summer months while the S&P and DOW Blue Chips and leaders rally +4~10% over the same time span.  We believe this shift in pricing dynamics will be the result of price valuations/expectation levels in the NQ having outrun true earnings potentials.  Foreign capital has been pouring into the US technology stocks for well over 16 months now.  Much like the 2000 Dot Com bust, this run may be overextended and a pricing shift is likely already started.  The real profits over the next few months will be in the S&P and DOW leaders.

Isn’t it about time you made an investment into your trading future that really generated returns for your subscription costs? Take a look at some of our recent research posts to see how accurate our research really is and understand that we are providing you with valuable insight in this article that you will probably start to hear about in 30+ days from all the other researchers.  If you want to stay ahead of the markets like we do, then visit www.TheTechncialTraders.com and become a valued subscriber.  We know you will be satisfied with our efforts to help you become more successful.

BECOME A TECHNICAL TRADER TODAY
AND PROFIT FROM THE MARKETS

Last week was a roller-coaster ride for traders and investors.  After a long holiday weekend, traders were greeted with concerns originating in Italy regarding political stability and the potential that any further issues could result in a collapse of the EU.  Even though the risk of this happening was somewhat minor, the US markets tanked near 2% as fear seemed to override common sense.  The rest of this week has been a wild ride of price rotation within a range.  We’ve been reading all types of news and comments regarding all types of “what if” scenarios from analysts and researchers while scratching our heads at some of the comments.

As we stated in our earlier article regarding the Italy political crisis, the one important aspect to trading and investing is to not lose focus on the true perspective and true market fundamentals.  Yes, if you are an intraday trader, these wild price swings can either be great profits or wild losses as you try to swing with these rotational moves.  As a swing traders/investor, though, we care about the overall stability and direction of the markets.  We are willing to ride out some rotation as long as our core analysis is sound and the technical and fundamental basis of our trades is still in place.

In our opinion, there are three things that are core elements of our analysis at the moment and these three things are likely driving the economic future of the US equity markets.

  1. The US Dollar continues to strengthen as the US economy shows solid signs of a broad-based economic increase.
  2. Oil/Energy prices have continued to decline recently, now down nearly 10% from the recent peak, and this decrease relates to supply and demand expectations throughout the end of this year (roughly 4~6 months into the future).
  3. The Transportation Index is pushing higher as stronger economic activity is expected throughout the rest of 2018 and into 2019.


These three key elements cross-populate as follows:

  1. The strong US dollar is acting like a magnet for foreign capital investment as the strength of the US dollar in combination with the strength of the US economy/equities markets creates a triple-whammy for foreign capital investments. Not only are foreign investors trying to avoid capital devaluation (currency price devaluation) and debt risks in their own local markets, they are trying to find ways to achieve ROI and stability for their capital investments.  With almost nowhere else to go, the US equities markets and debt markets are pretty much the only place on the planet for this triple-whammy opportunity.
  2. The strong US jobs numbers and robust economic activity, in combination with the past capital market stimulus and lowered interest rates, are creating a fuel heavy economic environment in the US not that President Trump’s deregulation and policies have injected the Oxygen needed to create the “economic combustion” that is driving this current growth. Energy prices are moderate and dropping as a result of the shift in technologies attributed to electric and hybrid transportation enterprises.  All of this, jobs growth, earning growth, economic growth, moderately low interest rates and a true combusting economy, provides for much greater opportunities for an advancing US equities market.
  3. The US equities markets are rotating higher throughout the global weakness and debt concerns while the Transportation index pushes higher as a sign that US investors expect the US economy to continue to grow. Transportations lead the us equities markets by about 4 to 6 months (on average).  Lower oil prices, strong jobs numbers, dynamic opportunities in the US economy and a stronger US dollar drive continued US and foreign investments into the US equities markets and debt markets.


As we have stated in earlier research posts regarding “capital migration”, capital (cash) is always seeking the best environments for stability, growth and opportunity in a continual effort to balance risk vs. reward.  Capital is capable of moving across the planet relatively quickly in most cases and is always seeking the best opportunity for ROI and stability while trying to balance unknown risks and devaluation.  Right now, the only games in town are the established economies, the US, Canadian and UK markets.

As you can see in the graph below US investments continue to grow as the best risk/reward for capital.


Our opinion is that until something dramatic changes this current global economic environment and risk unknown, capital will continue to rush into the US markets even if the US dollar continues to climb or oil continues to fall.  The only thing that can change this equation is the one key factor in understanding risk vs. reward – when does the opportunity for reward outweigh the risk of complete failure by applying capital into any other foreign or non-established market environment?  When investors believe the reward of moving capital out of the US equity markets in search of new opportunities or advantageous risk/reward setups in foreign markets exists, that is when we’ll see a change in investment dynamics resulting in more downside pricing pressure in the US markets – and we don’t believe that will happen within the immediate 4~6+ month span.

Pay attention to our most recent research as we have been dead-on in terms of calling these market swings.  The NQ chart, below, shows how the tech heavy NASDAQ is leading the breakout while the YM and ES markets lag a bit.  We believe all of these US majors are in the process of breaking to new all-time price highs and as the foreign market turmoil slowly unfolds, we may see some moderate price rotation.  Yet we believe the global economic dynamics that are currently in place create a very opportunistic, rich, green opportunity for continued capital infusion into the US equity markets and a continued moderate advance of the US Dollar.


Remember, there is now over $12 trillion in capital that has been created and introduced into the global markets over the past 10+ years.  All of this capital is searching for projects and investments to develop suitable ROI and gains.  Where do you think this capital is going to go for the most stable, most capable and most successful ROI available on the planet?  Think about that for a minute – where else would you consider putting capital to invest for safe and consistent returns right now?

This weekend could prompt a massive upside price breakout early next week on continued positive economic news or lack of any foreign market concerns.  The bias of the US equity market is, and has been, bullish – just as we have been telling our members.  If you have been fooled by this recent price rotation or other research posts, please consider Technical Traders Ltd. services to learn how we can help you profit from these moves.

We know you value our research and hard work trying to keep you ahead of these market turns and swings.  Please consider joining our other loyal members where you’ll receive exclusive updates, video content, trading signals and access to our proprietary price modeling systems and proprietary research reports.  Our proprietary research is already showing us where this market should be trading well into July 2019.  If you value our research, analysis and detailed reporting like this article, then please visit www.TheTechnicalTraders.com to learn how you can join our other members and begin receiving our exclusive research and more.

Become A Technical Trader Today And Profit From The Markets