
Natural Gas Setup for 32% Move in UGAZ
As we all know a picture says 1000 words, which is one of the reasons why I gravitated to trading using technical analysis. I can look at a chart and in seconds understand what price has done and is likely to do in the near future, without knowing a single thing about the company, index, or commodity. Why spend time reading news, financial statements, and other opinions when you can fast-track the entire process with a chart.
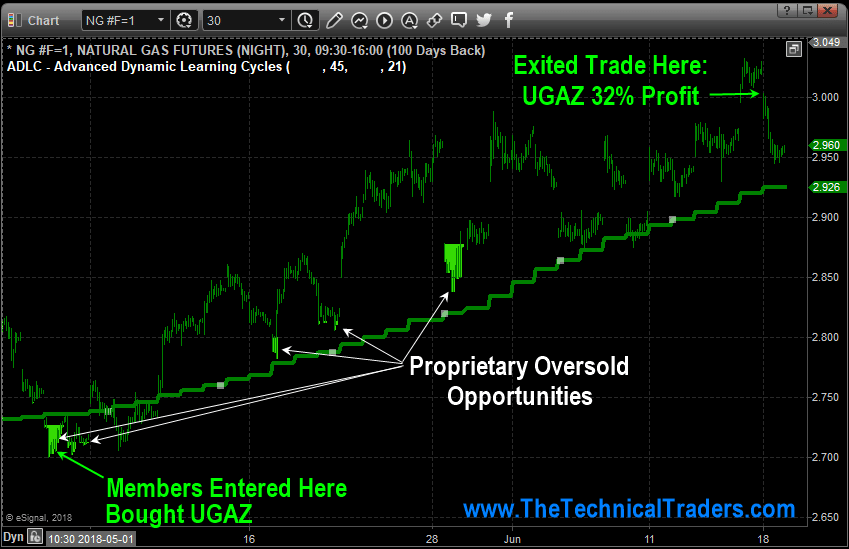
So, let’s just jump into the 30-minute chart of natural gas which shows the regular trading hours 9:30am – 4pm ET.
Natural Gas 30-Min Chart with Oversold and Trend Analysis
This chart could not be any more simple. Green bars and green line mean price is in an uptrend and you should only look to buy oversold dips. We got long a 3x natural gas ETN on May 3rd right near the dead low. After a few weeks, price action and longer term charts started to signal potential weakness, so we closed out the position for a simple 32% profit.
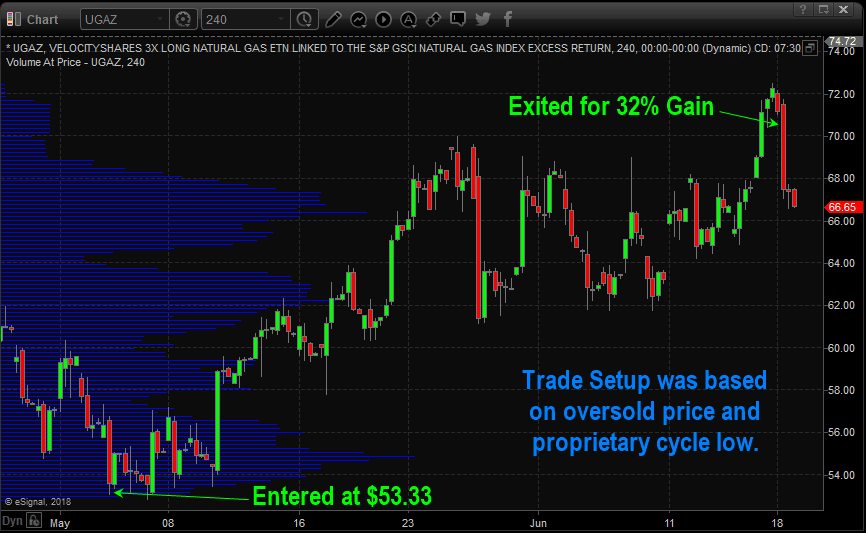
UGAZ 3X Leveraged Natural Gas Fund
Here is 240 minute (4-hour) candlestick chart of the natural gas fund.
53 years experience in researching and trading makes analyzing the complex and ever-changing financial markets a natural process. We have a simple and highly effective way to provide our customers with the most convenient, accurate, and timely market forecasts available today. Our stock and ETF trading alerts are readily available through our exclusive membership service via email and SMS text. Our newsletter, Technical Trading Mastery book, and 3 Hour Trading Video Course are designed for both traders and investors. Also, some of our strategies have been fully automated for the ultimate trading experience.

