You don’t have to be smart to make money in the stock market, just think differently.
That means: we do not equate an “up” market with a “good” market and vice versa
– all markets present opportunities to make money!
We believe you can always take what the market gives you, and make a LOT of money.
53 years experience in researching and trading makes analyzing the complex and ever-changing financial markets a natural process. We have a simple and highly effective way to provide our customers with the most convenient, accurate, and timely market forecasts available today. Our stock and ETF trading alerts are readily available through our exclusive membership service via email and SMS text. Our newsletter, Technical Trading Mastery book, and 3 Hour Trading Video Course are designed for both traders and investors. Also, some of our strategies have been fully automated for the ultimate trading experience.
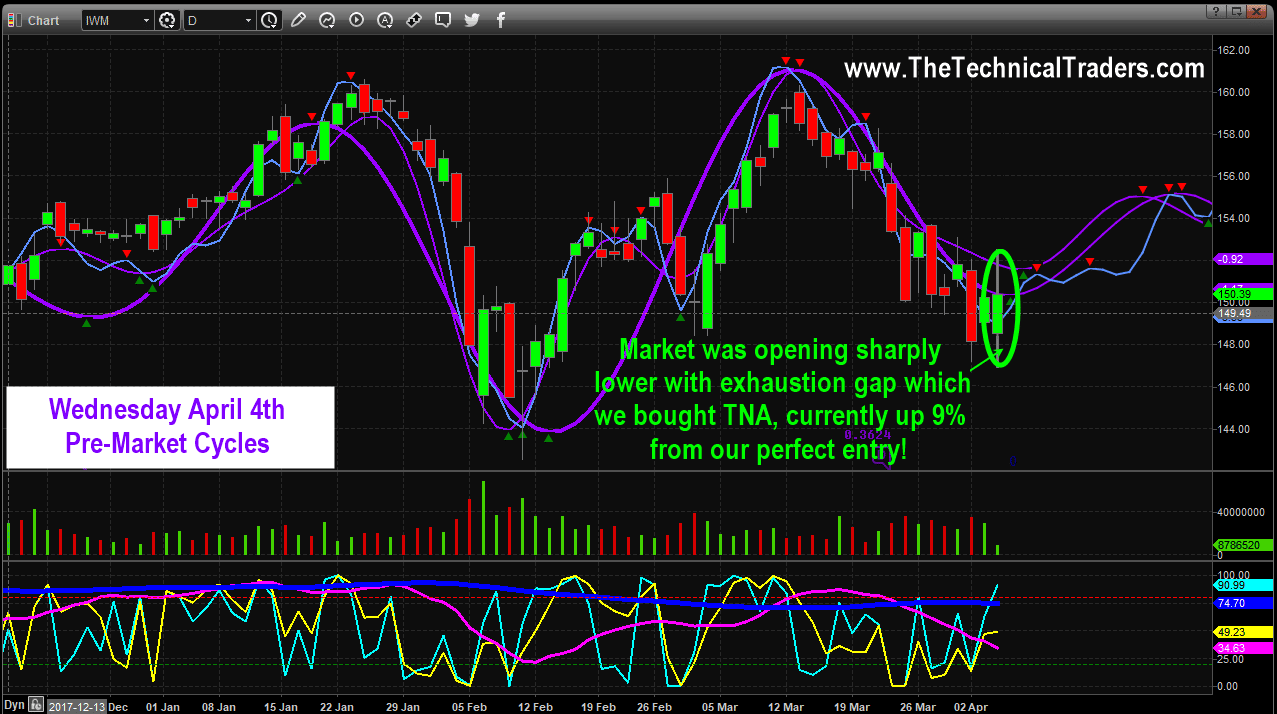
On April 4th in pre-market, we talked about how small-cap stocks were our favorite index because of their relative strength compared to the DOW, NASDAQ, and SP500.
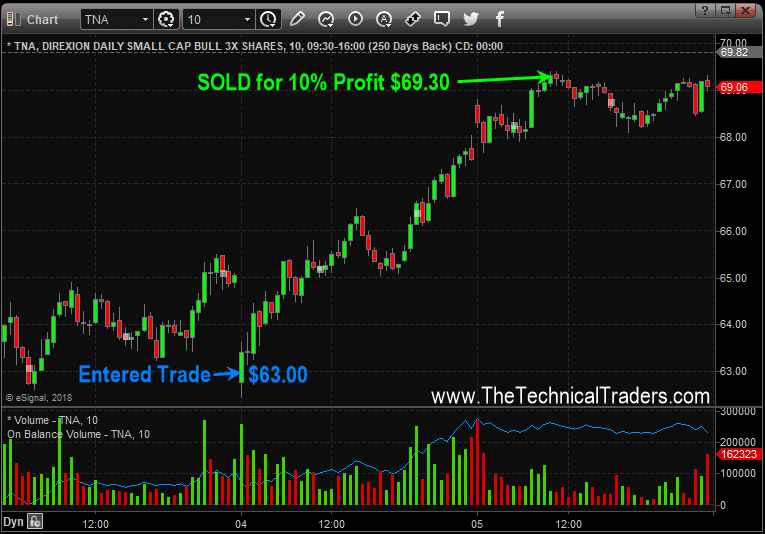
On Wednesday morning stocks were set to gap sharply lower on heavy volume, and the VIX was rising fast indicating massive panic selling among traders and investors. While everyone was in a panic and worried about the trading session at the opening bell, our team and subscribers were sitting comfortably watching and waiting to get long the IWM Russell 2K (TNA 2x Fund).
Before the markets opened we showed our members our proprietary cycles analysis and price prediction model which shows a significant market bottom should take place any day. This same type of cycle analysis is how we profited 15.5% with DUST profiting when gold stocks fell in February, and 9.1% from the natural gas bottom in March and the list goes on.
https://thegoldandoilguy.com/wp-content/uploads/2018/04/tna.png534765adminhttp://www.thegoldandoilguy.com/wp-content/uploads/2014/11/tgaoglogo.pngadmin2018-04-05 23:06:172018-04-05 23:06:17Small Cap Stocks Show Reversal Pattern
Our research team at Technical Traders Ltd. has been hard at work trying to identify if this recent downside price move is more concerning or just a rotational move. The recent global news regarding the US/China trade tariffs as well as the fallout that started nearly two weeks ago in Technology with Facebook, Snap and others has spooked the markets. Our additional research shows that China and Asia are extremely fragile at the moment and the global Central Bankers as well as the Real Estate market could be key to any future unraveling of the markets.
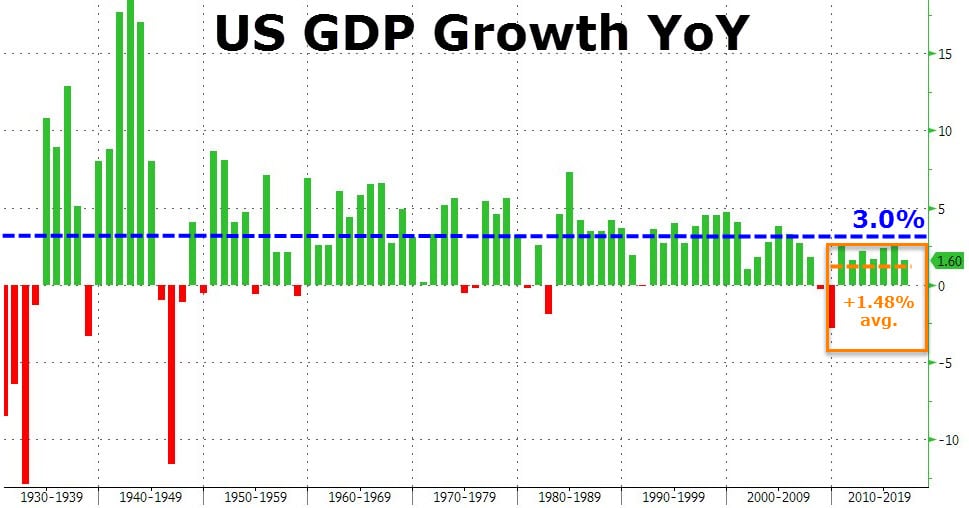
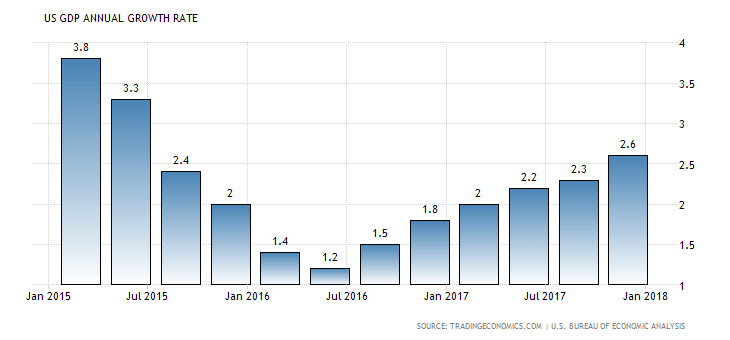
Yet, at this time we believe our predictive modeling systems and analytical systems are indicating a strong market recovery is just days away. As we have discussed earlier, capital is constantly searching for the safest and most reliable ROI throughout the planet at all times. We believe the current market environment will show signs that stronger, more established economies will continue to benefit from capital migration as a result of this new wave of uncertainty plays out. The US DGP growth rate over the past 2 years has been exceptional – increasing over 200% from 2015~2016 averages of 1.48%
As you might have read from our China/Asia Implosion research, there are many factors at work currently in the markets and the one thing that is a constant is consumer and debt cycles. Additionally, we have been relying on our cycle analysis, Adaptive Fibonacci modeling system and our incredible Adaptive Dynamic Learning modeling system (ADL), for much of our analysis throughout the end of 2017 and early 2018. Today, we are going to share what we believe to be one of the most amazing analytical calls of this year – a potentially massive rally in the US markets.
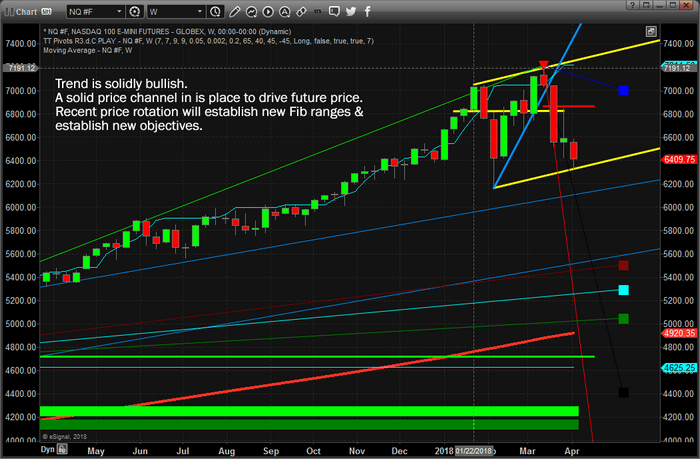
First, our Weekly Fibonacci modeling system is still showing strong bullish signs while indicating recent price rotation is below bearish trigger levels. Because of this last component, we are still concerned that unknown factors could derail any price recovery that our advanced modeling systems are predicting. Yet, we believe the core elements of Capital Migration and the fact that capital will chase the greatest ROI and safest environment for future liquidity and growth indicate that the US markets are the only game in town. The newly established price channel can be clearly seen in the chart below.
As we consider the fragility of the global markets as well as the potential that foreign and domestic capital will likely be migrating into the US Equity markets in an attempt to maintain ROI and liquidity that is simply unattainable in other global markets. Risks are starting to stack up in many foreign markets with Brexit, debt issues, cycle rotations and other issues. Yet, the US markets have recently been unleashed in terms of growth expectations and regulations.
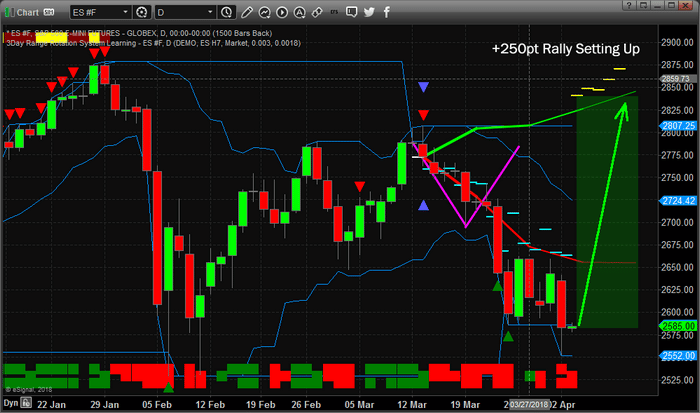
This S&P Daily chart showing our ADL predictive price modeling system is clearly showing the price anomaly that is currently setting up. Prices are been pushed much lower – below our price expectations shown as DASHES on the chart. Yet we need to pay attention to the dramatic price reversal setting up to the upside. Without our ADL price modeling system and the ability to identify these types of setups, we would have little knowledge that this type of dramatic price increase is about to hit the US markets.
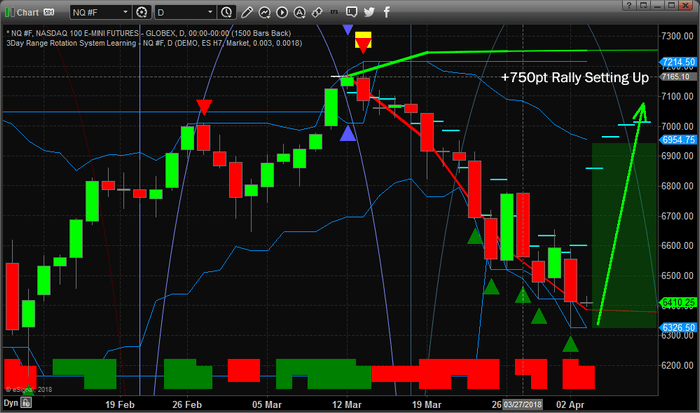
Additionally, when we compare the ES chart (above) to this NQ chart (below), we can see another price anomaly that is setting up in the US markets. These types of price anomalies are quite unique in the sense that they represent a price disconnect that usually results in a violent and dramatic price reconnect. In other words, when these types of price anomalies happen, price is driven outside normal boundaries of operation for periods of time, then it recovers to near the projected price levels – just like it did in early February 2018 with a dramatic downside price correction.
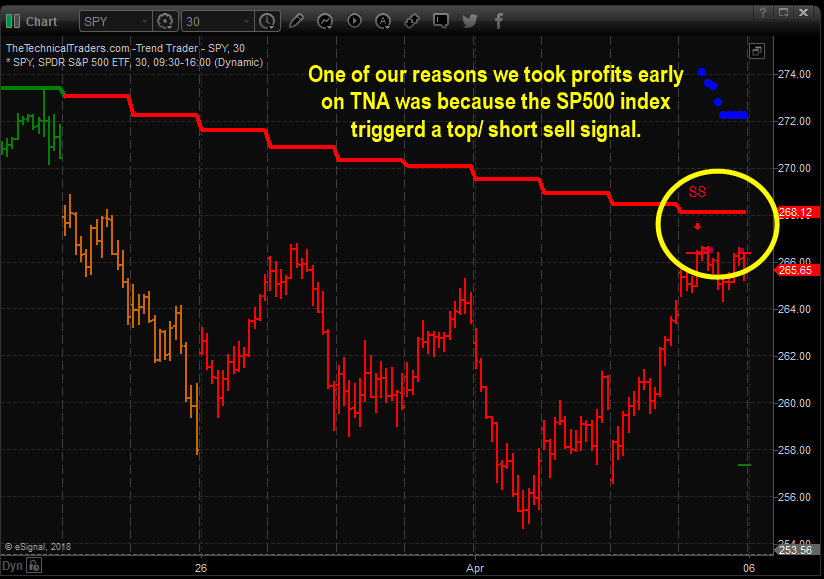
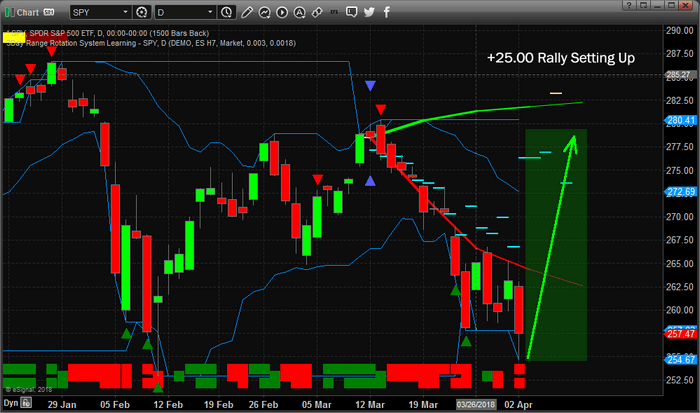
Lastly, this SPY chart below is confirming all of our price analysis with a very clear picture of the price anomaly that is currently setting up. External news factors have driven the current price to well below the expected ADL levels and setup what may turn out to become a Double Bottom in the process. Yet, the most critical part of all of this is the potential of a massive 10% or greater price rally over the next 3 to 10 days.
Many people simply don’t believe our ADL system can be this accurate, yet we urge readers to visit www.TheTechnicalTraders.com to review our research articles from late 2017 and early 2018 to see for yourself how well it has worked out so far. You don’t want to miss this move and what follows. This move will be a huge opportunity as our analysis is showing the potential for 8 to 12+% price advances over the next 30 to 60 days.
We are writing this message to alert all of our members and followers that we are uniquely positioned to take advantage of this move while others are preparing for the potential price decline that is evident by move traditional technical analysis modeling system. If you want to learn how to stay ahead of these moves and profit from this type of adaptive predictive price modeling, then please visit our website to learn more about our stock and ETF service for active traders and investors.
Our articles, Technical Trading Mastery book, and 3 Hour Trading Video Course are designed for both traders and investors to explore the tools and techniques that discretionary and algorithmic traders need to profit in today’s competitive markets. Created with the serious trader and investor in mind – whether beginner or professional – our approach will put you on the path to win. Understanding market structure, trend identification, cycle analysis, volatility, volume, when and when to trade, position management, and how to put it all together so that you have a winning edge.
Chris Vermeulen, from The Technical Traders, shares his outlook for the precious metals and oil by relating how he thinks the USD and US markets will move in the next couple weeks. With the USD rebounding slightly we can expect some more upside. As for the US markets, a bounce is also expected as we continue the choppy sideways movement.
https://thegoldandoilguy.com/wp-content/uploads/2018/02/featuring-cory.png109173adminhttp://www.thegoldandoilguy.com/wp-content/uploads/2014/11/tgaoglogo.pngadmin2018-04-04 10:14:302018-04-04 10:14:30Technical Traders Outlook on Oil, Gold, and Stocks Indexes
As we, the research team at www.TheTechnicalTraders.com, continue to deliver sections of this multiple part global market research report centered around China and Asia as a catalyst for an impending global market/debt collapse, we want to make sure our readers understand this process will likely play out over many months into the future. This is not something that we should concern ourselves with right away. This is not a warning that “the sky is falling and we need to run to our bunkers”. This is forward-looking research that indicates a strong possibility that China and Asia, along with many other nations in this region, may experience a credit/debt market contraction that could lead to another global credit crisis and we need to be aware of it and plan to profit from it. (Part I, Part II, Part III, Part IV)
So far, we have covered the history of Chinese property and equity market growth from before the 2008-2010 global credit crisis till now and have clearly shown that the Chinese property market is rolling over (downward) after the 2016 regulations were put into place to curtail the mass exodus of capital from within China. We have also gone over many of the correlative economic items that point to the fact that a 15~25% correction in any one market segment, property, equity, credit/debt or global markets that result in capital risks for China, could drive a contagion effect for the Chinese investors/government. In other words, a simple 10~20% price decline in two or more of these markets could put enough pressure on the Chinese that capital reserves could diminish dramatically as well as some level of investor panic could set in to drive a “death spiral” type of event.
Whereas growth rate of purchases (land), commercial sales and floor space sales and growth rate of fund for development have decreased dramatically just over the past 3+ months. When you look at this data on a year over year context, it shows mild contraction up until December 2017. After December 2017, the contraction in Residential and Commercial real estate activity is dramatic – almost frightening.
Throughout all of 2017, the Growth Rate of Investment in Real Estate Development averaged near 8.1%. Beginning in early 2018, this level shot up to 9.9% – the highest level in over 13 months.
Growth of Land Area Purchased over the same period showed signs of increase over 2017 – averaging near 11.2% or so throughout 2017. The values of this indicator near the end of 2017 were above 15%.. Whereas the 2018 levels show a -1.2% growth rate. In one month span, the level of this indicator fell -17%?
The Growth Rate of Floor Space and Sales of Commercial Buildings continued to decline throughout most of 2017. Starting near 25~26% and ending the year near 10% – a -15% decrease. What we found very interesting is that Sales of Commercial Buildings increased 1.6% in early 2018 while Floor Space sold decreased 3.6%. It would appear the Chinese central bank is willing to lend to property buyers while floor space buyers are falling off the map.
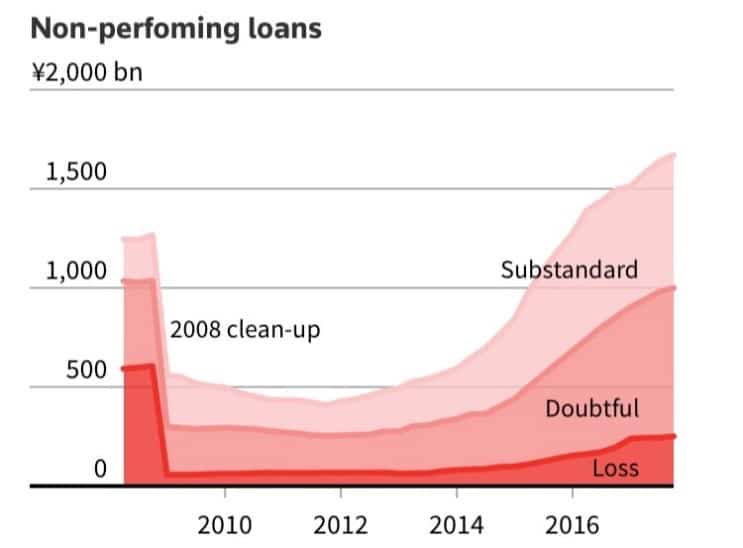
Our primary concern with regards to any type of Chinese or Asian credit market collapse is that the recent 5 to 7+ years of outward capital expansion, expanding investments outside of China/Asia in support of lofty objectives and fuzzy real/return values, may have prompted a massive sub-standard debt issue that could become very dangerous for the world. We’ve all been reading of the issues of Non-performing assets and loans in China recently. These types of credit/debt are the same types of instruments that led to the 2008~2010 global credit crisis.
Imagine the Chinese economy as both a local organism (contained to only the China/Asia general region), but also as an international organism (depending on external sources for essential life sustaining components – like the US and UK for purchases and the other emerging markets for growth projects). Now, imagine these external sources experience an extended 10~35% general asset decrease over a period of 3~5+ years while the US Federal Reserve, and other central banks, tighten the credit markets and push up borrowing costs. If China is dependent on these outside sources for essential economic sustaining components, then the economic balance they depend upon could become threatened – if not even more fragile than we have already examined.
Yet, consider one additional component of this hypothetical exercise. Consider that the Chinese property and equity markets experience a moderate contraction event (say 10~20+% lower over 2~3 years) while the US and other established economies continue to push up the borrowing costs with rising interest rates. We have long believed that capital migrates into the most healthy and opportunistic environments, with ease, and as capital migrates to new sources of returns, it leaves deteriorating economies in a “death spiral” for a period of time. Capital that is unable to quickly move to new opportunistic sources may become trapped in these contracting economies for many years or decades.
The signs of this hypothetical economic exercise are already starting to become evident. Recent China housing market data shows an incredible decline in activity and pricing – about to fall into negative territory.
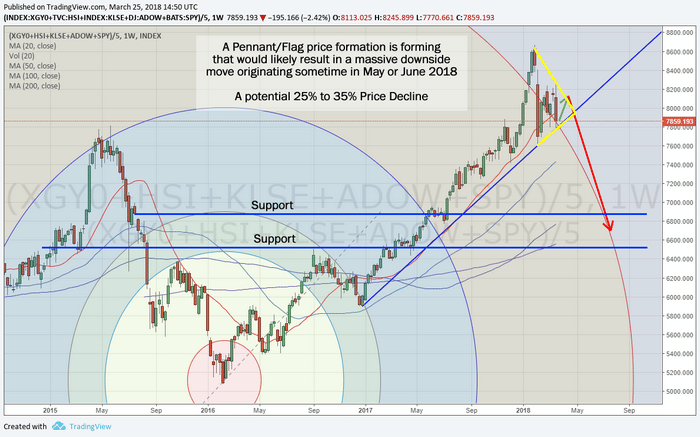
China’s property market cycles have topped out as well, indicating a strong potential for further contraction in the real value of property assets.
Combine this with a global central bank tightening and recently announced US/China tariffs and economic positioning and we have the making of another Global Crisis event – this time originating in China/Asia as the Chinese Dragon economy bursts.
As US mortgage rates continue to climb above 5%, the inevitable economic tightening across the US and globe will continue. The attempt to move China away from a US Dollar based economy and become more focused on the Chinese Yuan will, in our opinion, be a difficult transition over many decades. We believe the Chinese/Asian markets are on the cusp of a potentially dramatic collapse and the recent news of US and Chinese tariffs do nothing more than exasperate the current issues. Pay very close attention to the surrounding Asian markets as we continue to watch for breakdown events.
In the next, and last, portion of this series, we will attempt to present our final conclusions and expectations for traders and investors. We have attempted to clearly illustrate our detailed China/Asia market research and the potential for a dramatic price decline in the immediate future. We’ve outlined how this incredible opportunity for investors was setup, almost perfectly, by the global recovery efforts after the 2008-09 credit crisis. At this point, it would appear the Chinese Dragon economy is on its last leg and we are well positioned to take advantage of the next big move.
If you find our research valuable and want to learn how you can stay on top of these moves while profiting from them, visit www.TheTechnicalTraders.com to learn more about our services and memberships. We work very hard to keep our members aware of these types of opportunities and make every effort to deliver successful results for our valued members. We hope to see you in the members area soon where we can share more insightful analysis and research.
53 years experience in researching and trading makes analyzing the complex and ever-changing financial markets a natural process. We have a simple and highly effective way to provide our customers with the most convenient, accurate, and timely market forecasts available today. Our stock and ETF trading alerts are readily available through our exclusive membership service via email and SMS text. Our newsletter, Technical Trading Mastery book, and 3 Hour Trading Video Course are designed for both traders and investors. Also, some of our strategies have been fully automated for the ultimate trading experience.
Chris Vermeulen
https://thegoldandoilguy.com/wp-content/uploads/2018/04/ChinaPropertyCycles.png7461030adminhttp://www.thegoldandoilguy.com/wp-content/uploads/2014/11/tgaoglogo.pngadmin2018-04-03 13:44:302018-04-03 13:44:30Part V – China/Asia Economic Implosion on the Horizon?

 Imagine the Chinese economy as both a local organism (contained to only the China/Asia general region), but also as an international organism (depending on external sources for essential life sustaining components – like the US and UK for purchases and the other emerging markets for growth projects). Now, imagine these external sources experience an extended 10~35% general asset decrease over a period of 3~5+ years while the US Federal Reserve, and other central banks, tighten the credit markets and push up borrowing costs. If China is dependent on these outside sources for essential economic sustaining components, then the economic balance they depend upon could become threatened – if not even more fragile than we have already examined.
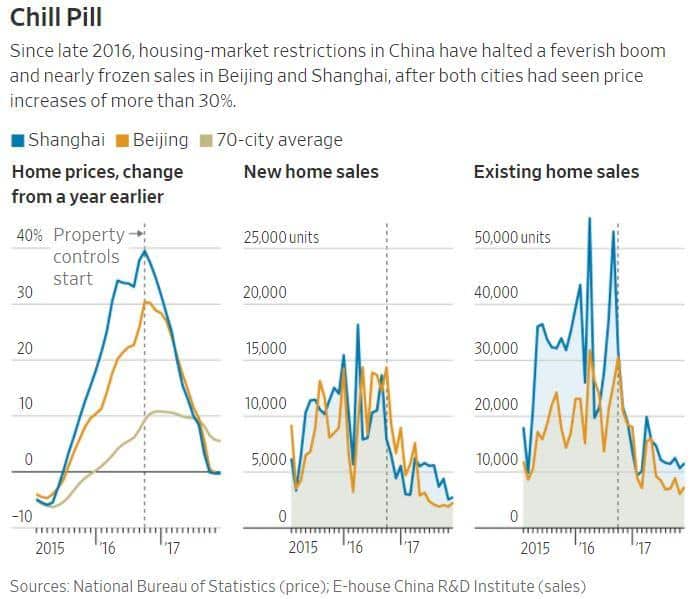 China’s property market cycles have topped out as well, indicating a strong potential for further contraction in the real value of property assets.
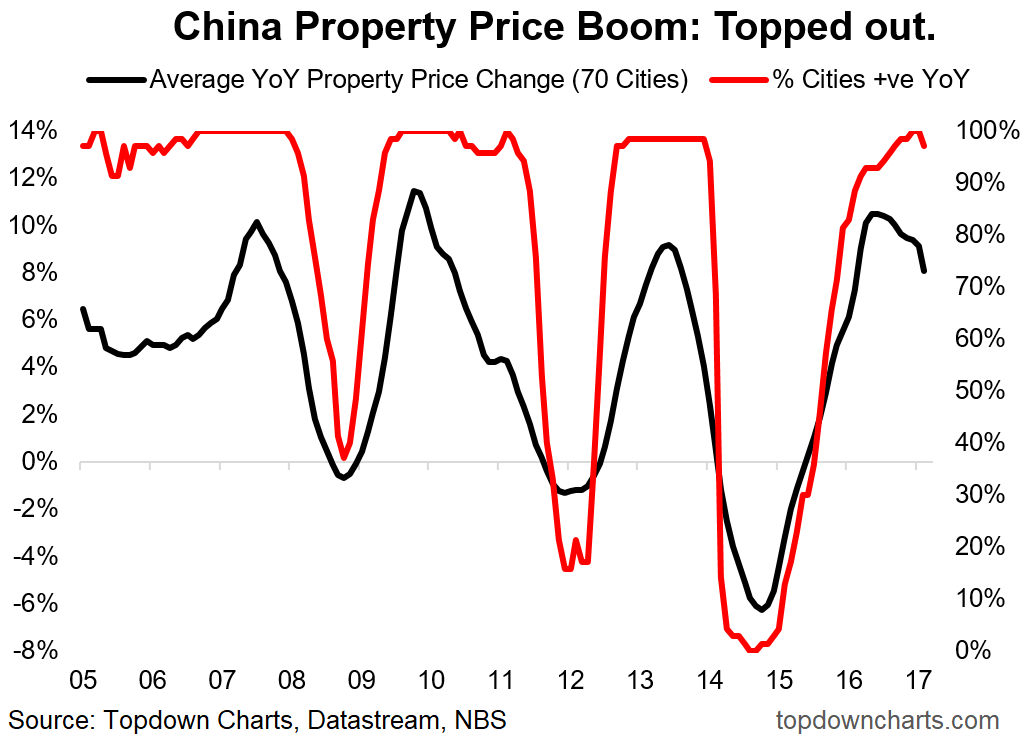
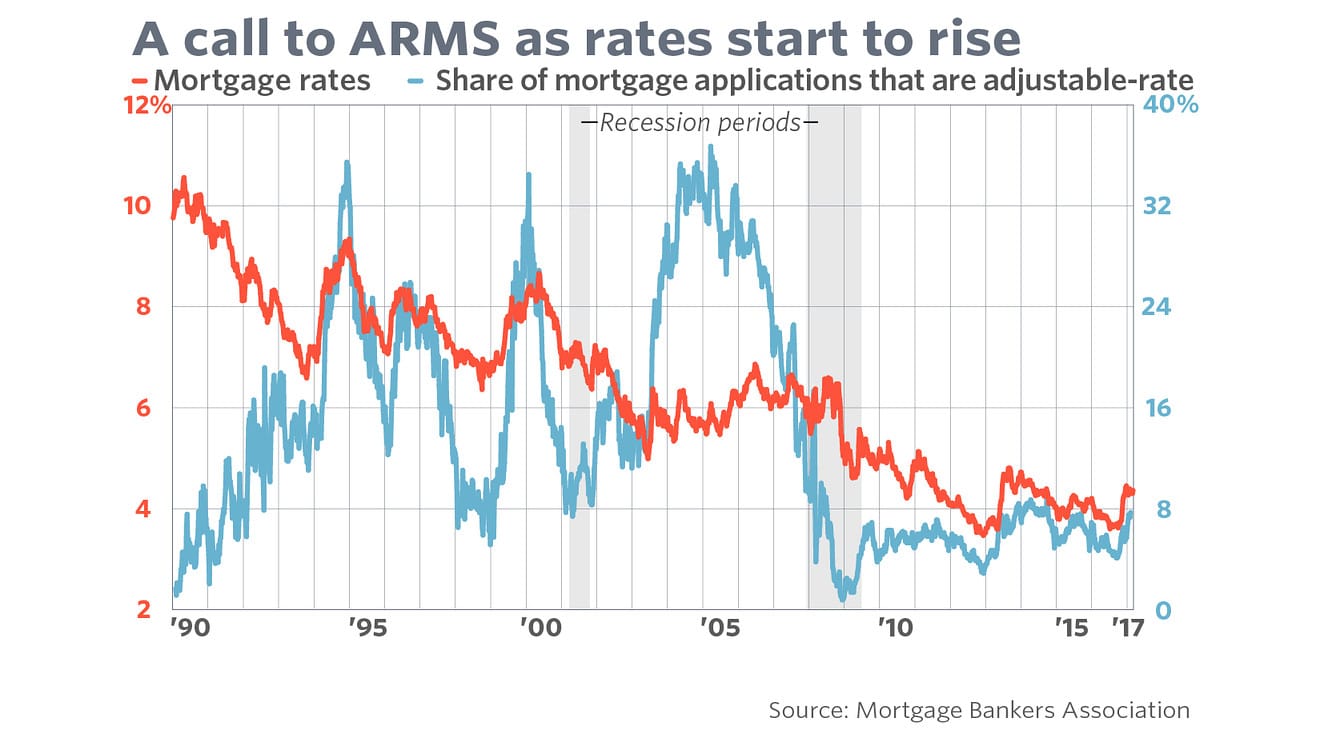 As US mortgage rates continue to climb above 5%, the inevitable economic tightening across the US and globe will continue. The attempt to move China away from a US Dollar based economy and become more focused on the Chinese Yuan will, in our opinion, be a difficult transition over many decades. We believe the Chinese/Asian markets are on the cusp of a potentially dramatic collapse and the recent news of US and Chinese tariffs do nothing more than exasperate the current issues. Pay very close attention to the surrounding Asian markets as we continue to watch for breakdown events.