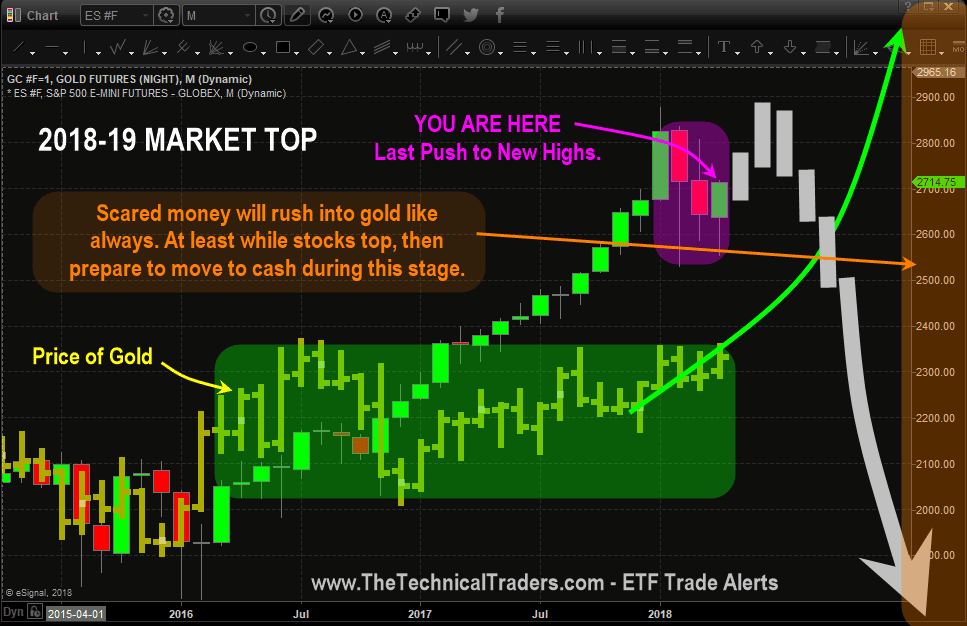
Since Spring is in the air here are some colorful charts and show you where we feel the price of stocks are within the current bull market.
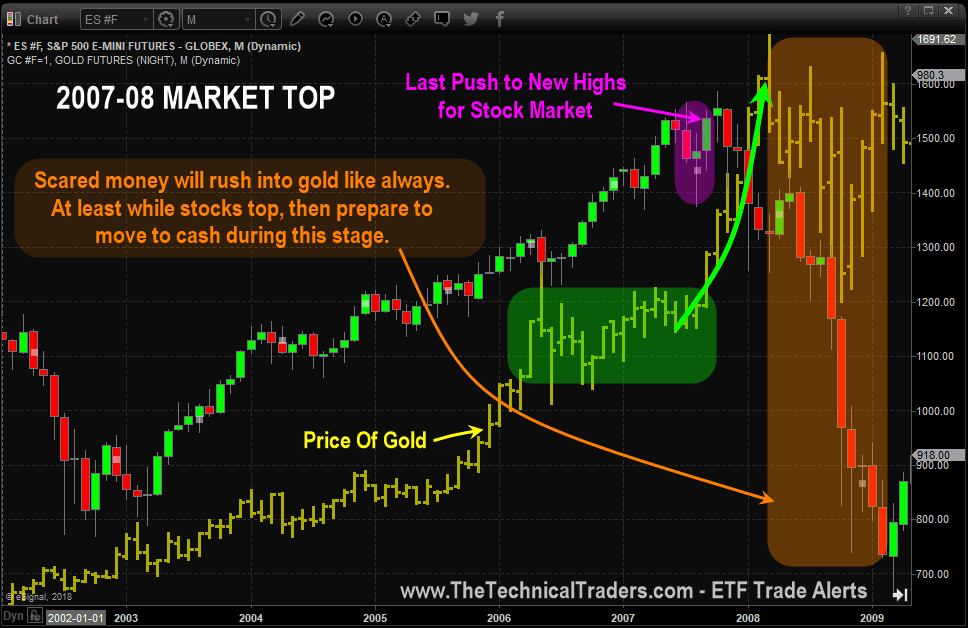
Below are monthly charts of the SP500 index and the price of gold. The first chart shows a pattern that gold formed just before stocks hit all-time new highs and the bear market started.
The chart is a little noisy, lots of analysis, but we color-coded each area to break it into clear bits size analysis. The chart shows you what happened and what is likely to happen again.
YOU ARE HERE IN THE STOCK MARKET
This is the current monthly chart, and if you compare the price action with the above chart, you can’t help but think things are set up in a similar formation as 2007 – 2008.
WHAT DOES ALL THIS MEAN?
It means, the stock market is nearing a significant top and all everyone’s long-term buy and hold investments should be reviewed and prepared for a rebalancing later this year. Precious metals should do well this year, stocks should top out and for you to preserve their hard-earned money cash is always king for those who don’t actively trade. But if you do trade or you are an active investor huge amounts of money can be made during times of increased volatility, precious metals, and falling stock market prices.
TODAY’S STOCK MARKET ANALYSIS – WED APRIL 28TH
What an AWESOME DAY!
All our positions rocketed higher with our most recent entry in SIL (silver miners) leading the way.
We closed our TNA position to lock in 17.7% on the second portion of that trade.
Yes, we do feel the markets will run higher, but we also like to lock in the quick, easy money trades like TNA especially when the overall market is looking and feeling a little top heavy for a day or three.
The chart below of the SP500 index paints a color picture of what I feel will unfold in the very near term.
IN CONCLUSION:
Our analysis of the markets was DEAD ON. We called the 2678 level on the ES as a key resistance level to watch before any breakout to the upside would potentially happen. We also called this market bottom nearly three weeks ago on March 28, 2018 and we locked in 17.7% today with our subscribers. We have been nailing these market reversals with incredible accuracy all year and we are just getting started with our Advanced Dynamic Learning systems we have developed.
The bottom line is that smart traders and investors look into the future and position their money where they feel it will increase in value the most. We say this all the time, which is money is continually looking for the best ROI and flows from one asset class to another as the market evolves. With potentially another major financial crisis forming, war, and a bear market in stocks we do not doubt that we are about to experience a huge rebalancing of money over the next few years, and I feel precious metals may be the next little hot pocket for trades.
So if you want our pre-market video analysis showing you where the markets, oil, and gold are headed every day and want out ETF trade alerts be sure to join the Wealth Building Newsletter today!
Chris Vermeulen
https://thegoldandoilguy.com/wp-content/uploads/2018/04/08-Top.png628968adminhttp://www.thegoldandoilguy.com/wp-content/uploads/2014/11/tgaoglogo.pngadmin2018-04-18 17:17:532018-04-18 17:20:15Gold – A Unique Repeat of the 2007 and How to Profit
The US majors are all nearly 1% higher for the day with the NASDAQ up over 2.25%. Our analysis of the markets was DEAD ON. We called the 2678 level on the ES as a key resistance level to watch before any breakout to the upside would potentially happen. We also called this market bottom nearly three weeks ago on March 28, 2018 and we are up over 15% on a position to take advantage of it with our followers. We have been nailing these market reversals with incredible accuracy all year and we are just getting started with our Advanced Dynamic Learning systems we have developed.
We should all expect this move higher to continue for the next few weeks as a dual time/price cycle is driving prices higher for the next few weeks. Our predictive analysis and traditional technical analysis has indicated this move will last till after the cycle apex – which should be near the end of April or early May. At that time, we should expect a price stagnation/rotation that is rather muted in range because the overall dynamics of this cycle move is still strongly bullish. We will update you with new data as we update our research, but if you want to know about moves before the happen you are best to subscribe to our Wealth Building Newsletter for real-time analysis and trade alerts.
On the chart below you can see the price channel is also driving price rotation throughout this advance. Expect the markets to continue their push higher until they near recent highs. At that point, expect the markets to stall a bit in a sideways rotation for a few days before attempting another push higher near or after May 7th.
This is an incredible opportunity for traders and investors. The price moves we have been able to identify and call correctly over the past 6+ months have resulted in some fantastic opportunities for our members. Visit www.TheTechnicalTraders.com to subscribe today and stay ahead of these markets and increase your profits. Where else can you get this type of detailed, consistent, and accurate price analysis? We believe we provide incredible value and insight to our members and we welcome you to join our other members in building greater future success.
https://thegoldandoilguy.com/wp-content/uploads/2018/04/Chart_18-04-17_NQ_MeltUp.png486700adminhttp://www.thegoldandoilguy.com/wp-content/uploads/2014/11/tgaoglogo.pngadmin2018-04-17 22:24:102018-04-17 22:24:10The Short Squeeze/Melt-Up We Predicted Started Today
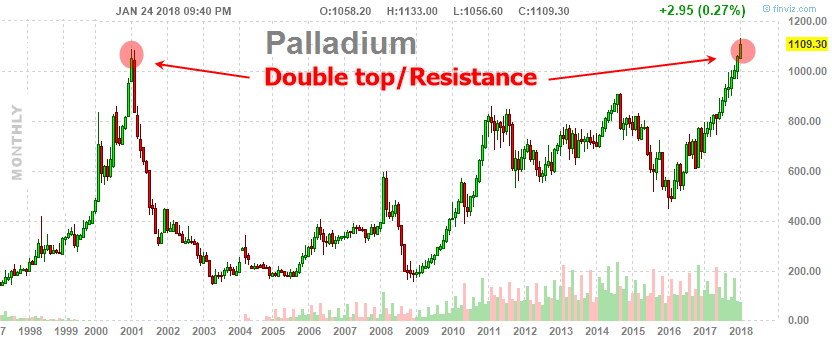
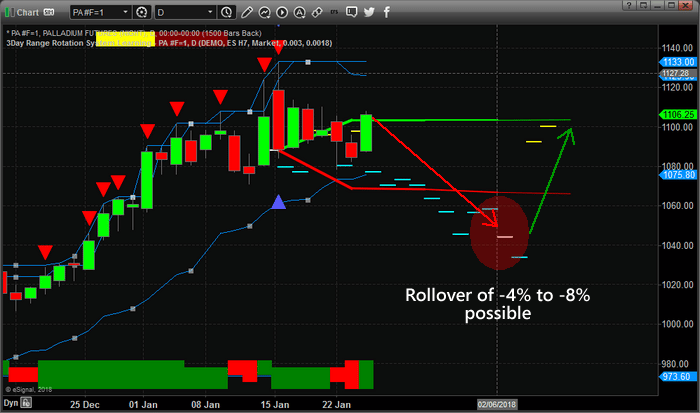
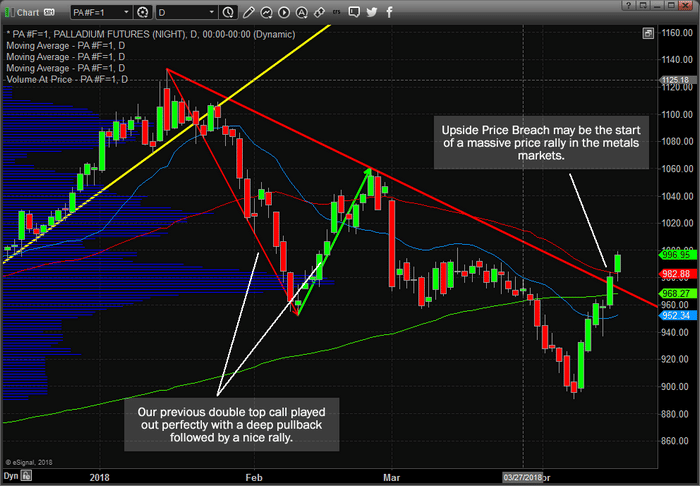
Many months ago we made an interesting call in Palladium and alerted to this setup on January 24th, 2018. This nearly perfect call included our future price expectations using our advanced ADL price modeling system. Today, we are refreshing that call with a new market call to inform you that our price prediction has played out perfectly and it has completed its pullback.
Last January, we identified this critical double top in Palladium and warned our followers that a 4~6% price correction was about to unfold.
At that time, this chart below showed our predictive price analysis and warned that prices would retrace in price. This type of setup/move is a simple technical trade. In short, when price of an asset has had a substantial move and reaches a clear resistance level like this, you must expect sellers to step in and unload their position to lock in profits. This, what was drives the price lower temporarily.
This next chart below is the current daily Palladium price showing the upside price breakout that has recently caught our attention and the reason why we are alerting our followers to the upside potential of this move. We have been long the metals markets for quite a while and this upside breakout in Palladium may be the start of a massive upside move in the metals.
Our recent research shows that the precious metals markets may be setting up for a solid upside price rally with the Syria event and other recent news. Please visit www.TheTechnicalTraders.com to read some of our other recent research posts and to see how we can assist you in finding great trades like this to help you profit from the markets on a monthly basis.
Friday night opened up a whole new perspective on the global markets with the coordinated targeted attack on Syria. It’s not that we didn’t know this was a possibility, yet the event itself changes how the markets may react on Monday and throughout this next week. Our researchers at Technical Traders Ltd. have been diligently trying to identify the price rotations that will occur early next week and we believe this research post will help to prepare all investors for what may be a wild ride.
First off, with this event playing out late Friday night and early into Saturday, there are a number of things we have to consider. The US Dollar may be under some pressure this week as a result of this event. Gold and Silver may rally as fear and panic enter the markets. Oil will likely rise on fear of a disruption or conflict related supply issue. The US stock market will likely rotate with a bit with continued large price volatility early Monday morning as traders attempt to reposition after this event. Given all of this, the long-term perspective has to be maintained in order to understand the true market dynamics.
As we understand it, this event was a “shot over the bow”, so to say, with regards to the players in Syria and the fact that chemical weapons attacks will not be allowed to continue. Syria is an absolute mess with multiple parties attempting to develop alliances and dominate the narrative of this conflict. The US involvement started quite a while ago and we believe the US will attempt to stay as far away from direct engagement as possible with regards to this ongoing event
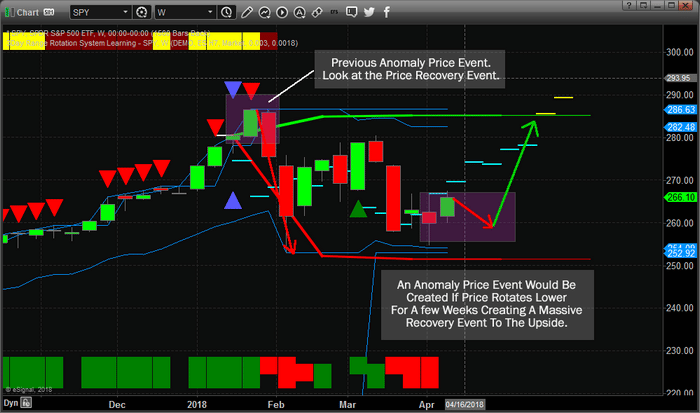
As traders, we have to understand that this type of isolated event may create price anomalies in the markets that present incredible opportunities for smart investors. Our ADL price modeling system is still warning us that the US markets should be headed higher over the next 3~5 weeks. How does this event in Syria change these predictions? It doesn’t. It just means that pricing pressure because of this event may create what we call a “price anomaly” that allows us to position our trades for the “recovery event.
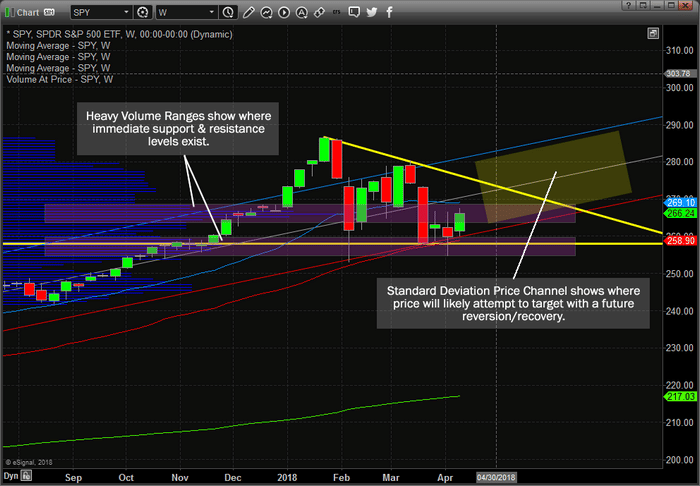
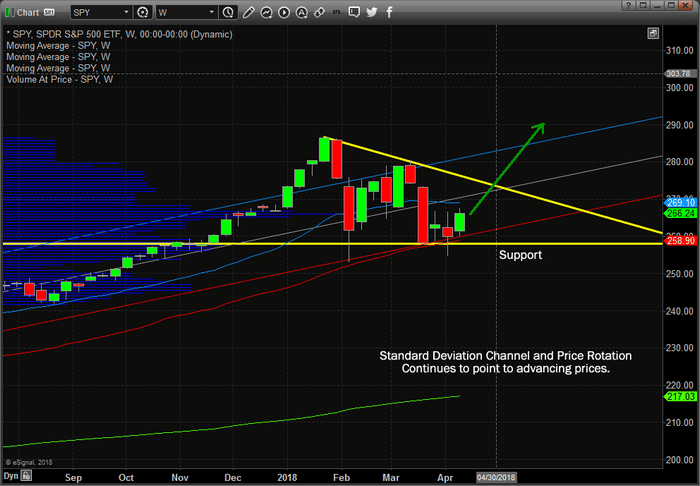
This SPY chart illustrates what we believe will be the most likely outcome. If investors panic and rush into the US markets, then we could see a broad market rally early this next week. If investors panic and attempt to rush into a protectionist position, then we could see the US majors consolidate near these lower price ranges for a few weeks setting up the “price anomaly” we have been discussing. Either way, we believe the markets will attempt a massive upside move in the near future because our advanced price modeling systems are showing a clear upside bias as well as the fact that capital will always move into safe and stable environment for returns. The US and other established markets are really the only places where capital will attempt to reside if this conflict extends much further.
This additional SPY chart shows a number of key technical elements; the Standard Deviation Price Channel and the key Volume Support & Resistance zones. These are important for all traders to understand, the Volume Support & Resistance zones are key to understanding the current price consolidation range. These levels are going to continue to be price boundaries till price breaks these levels and attempt a move higher or lower. The Standard Deviation Price Channel is also key to understanding that price will attempt to “recover” to this level at some point – unless some massive market event disrupts this channel and creates a new price channel. We believe the markets have not accomplished this disruption event yet and the current price channel is still valid.
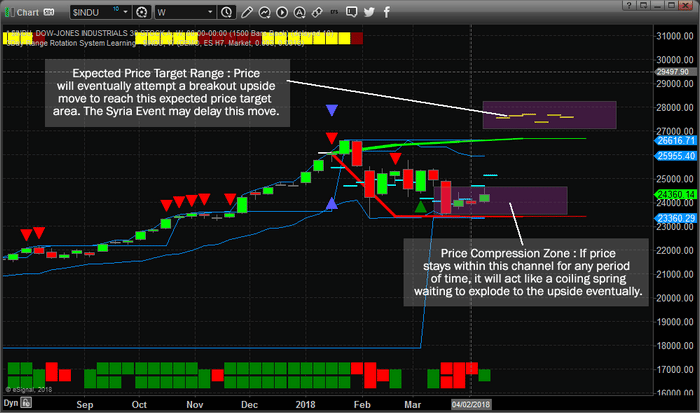
This $INDU weekly chart provides a much clearer example of the ADL price modeling system at work and what we believe could be an explosive upside price move within the next 3~5 weeks. See how the ADL price modeling system is predicting the “Expected Price Target Range” much higher than current price levels? If the Syria event continues to hold prices down in the illustrated “Price Compression Zone”, then the reactive recovery event for price will be an explosive upside price swing in the near future. These are the types of anomalies that we look for in our analysis. They can be very powerful and very profitable if one knows how to position selected trades to take advantage of these moves.
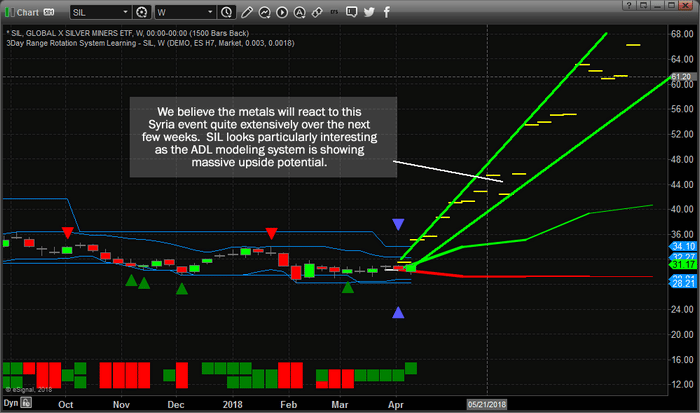
Lastly, this one chart sums up our metals analysis quite well. The Syria event is probably not over yet and the world’s powers will continue to control the narrative of this event for quite a while. What we can determine from this is that some level of additional fear will likely reenter the markets which means that Metals and Oil will likely move higher as this fear comes into play. This SIL Weekly chart shows that our ADL price modeling systems is predicting substantially higher prices over the next 3~12+ weeks. Many people have discussed that Silver is the poor man’s Gold and the disparity in pricing between Gold and Silver makes Silver a substantially advantageous commodity to own. If this ADL price modeling is correct, Silver and SIL will begin to skyrocket higher over the next few weeks and months as capital, which is always searching for a safe and viable environment for returns, hunts for the best protected areas of the market for continue ROI growth. Where will it go?? Probably into the US equities, metals and oil.
Remember, with events like this, there is not a single person on the planet that can attempt to predict the future with any degree of accuracy. Even our own price predictive modeling systems can’t be 100% accurate all the time. We have to consider all perspectives of these markets and when we get more than one analysis that confirms our primary research, then we have a better understanding of what might happen. What we can tell you is that our team of researchers are dedicated to helping our members stay ahead of the markets and find suitable trading opportunities for success. Our analysis and price modeling systems have been dead-on accurate through almost all of 2018 and late 2017. Our analysis is saying that we have to watch what happens early this week to see which of the two expected price reactions are going to play out and make decisions based on what price is doing then. Still, we have a plan to execute positional trades for our members to allow them to profit from these moves either way and we believe the opportunity for success is incredible.
If you want to learn how to take advantage of these types of opportunities and market anomalies with stock and ETF trade alerts, then visit www.TheTechnicalTraders.com and see what we have to offer. Start off with our Quarterly membership to give yourself ample time to see how we find and deliver success for our members. Remember, these moves don’t always play out like we expect, we will be updating our members with new research as the markets show different setups in the future. Right now, we’ve shown you what will likely happen for the next 3~5+ weeks and we are uniquely positioned to take advantage of these moves. If you feel you are in need of our assistance, then please visit www.TheTechnicalTraders.com to learn how we can assist you in profiting from these massive price swings.
https://thegoldandoilguy.com/wp-content/uploads/2018/04/Chart_18-04-14_SIL_W_ADL.png413700adminhttp://www.thegoldandoilguy.com/wp-content/uploads/2014/11/tgaoglogo.pngadmin2018-04-15 15:28:142018-04-15 15:28:14Bombs, Missiles and War – What to expect from the stock market next
We, at Technical Traders Ltd., believe recent data released by China presents traders with a huge opportunity over the next 6~18 months. Recently released Chinese economic market data points to a general market disruption in regards to trade values, import/export data and loan/debt risk. As reported by Reuters and Business Insider, the continued crackdown on Shadow Banking in China, as well as recently announced trade tariffs, may be shifting the dynamics of the Chinese Dragon economy dramatically.
Additionally, we recently read an article where the IMF intended to discuss the numerous Chinese expansion projects throughout the globe in an effort to attempt to restrain “partner country debt risks”. We believe the intent of the IMF is to attempt to protect partner countries from entering into what appear to be expansion projects (backed by China) while risking a debt collapse in the near future. Much like Greece or Puerto Rico, once a poor nation crosses that debt to GDP ratio, it is almost impossible to recover because the debt balance become insurmountable.
In terms of US market research and investment opportunities, this new data from China presents a number of new opportunities in terms of market dynamics. First, we believe China will continue to decrease its capital reserves in an attempt to prop up their economic functions. Secondly, the new trade tariffs will put additional pressure on the Chinese economy. Lastly, we believe the consumer and real estate market cycles will come into play over the next 6~18 months which will create further pressure within the Chinese economy. Because of all of these factors, in addition to the fact that much of the Chinese economic expansion is debt based, we believe a massive capital migration into US, Canadian and UK stocks will become more evident over the next 6+ months.
Our research team has been working to identify these opportunities for our members and to position our clients properly for this future move. Our advanced predictive modeling systems have been DEAD ON accurate for the past 5+ months with regards to these major market moves.
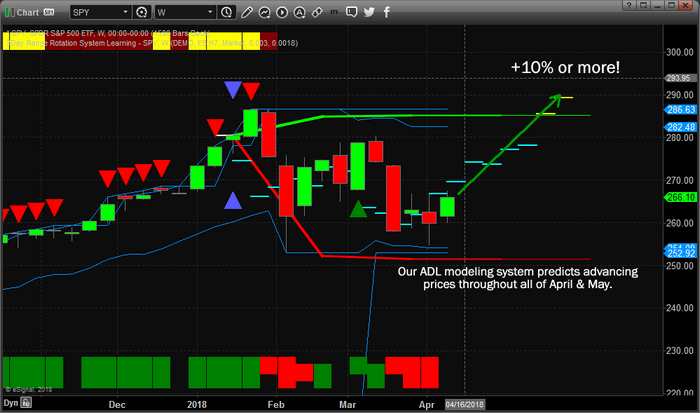
The chart, below, shows our ADL predictions for the SPY throughout the end of May 2018. As you can see, our price modeling system is predicting that prices will continue to advance for the next 6+ weeks. We believe that as the Chinese economic data continue to roll in with mixed results, the capital migration to the US and other established markets will be tremendous and push US equities to new highs.
Additionally, this potential move opens up a number of possibilities in commodities and other equities throughout the next 18+ months. If you want to learn how our research team at www.TheTechnicalTraders.com can assist you in finding these opportunities then please visit our website to learn more and read some of our most recent research reports. Pay close attention to our recent China Collapse article for more detailed information regarding our thinking. Trust us – you won’t want to miss this move in the markets.
53 years experience in researching and trading makes analyzing the complex and ever-changing financial markets a natural process. We have a simple and highly effective way to provide our customers with the most convenient, accurate, and timely market forecasts available today. Our stock and ETF trading alerts are readily available through our exclusive membership service via email and SMS text. Our newsletter, Technical Trading Mastery book, and 3 Hour Trading Video Course are designed for both traders and investors. Also, some of our strategies have been fully automated for the ultimate trading experience.
https://thegoldandoilguy.com/wp-content/uploads/2018/04/Chart_18-04-13_SPY_ADL_W.png413700adminhttp://www.thegoldandoilguy.com/wp-content/uploads/2014/11/tgaoglogo.pngadmin2018-04-13 14:25:402018-04-13 14:25:40Shocking Chinese Economic Data Points Will Disrupt Markets
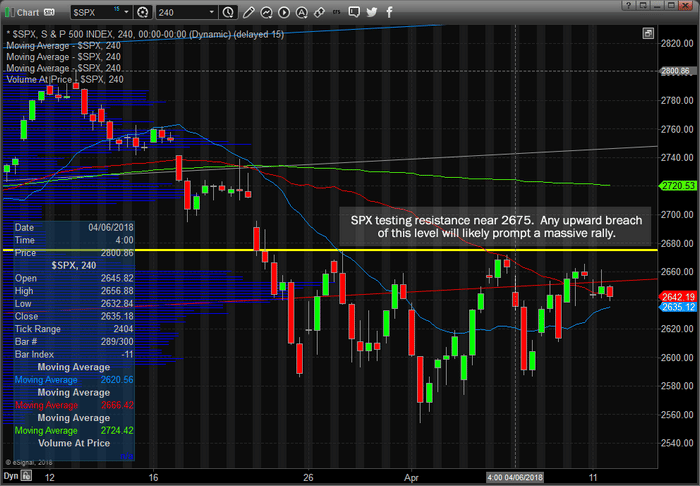
Our analysis continues today with this research of a potential Short Squeeze in the SPX and other broader markets. As you are probably well aware, we, at www.TheTechnicalTraders.com, have been nailing the markets with our detailed analysis for quite a while. Our Advanced Analytical tools have called nearly every move. Nearly two weeks ago we called a massive market bottom to form in the US markets – well before just about anyone else even saw a bottom formation. In fact, we have already banked 10% profit on the first half of our best-cherry-picked setup for subscribers and it’s continuing to rally more.
Today, we are calling the potential for a massive upside breakout move on what we believe is a massive Short Squeeze position just above resistance in the SPX. Take a look at these charts.
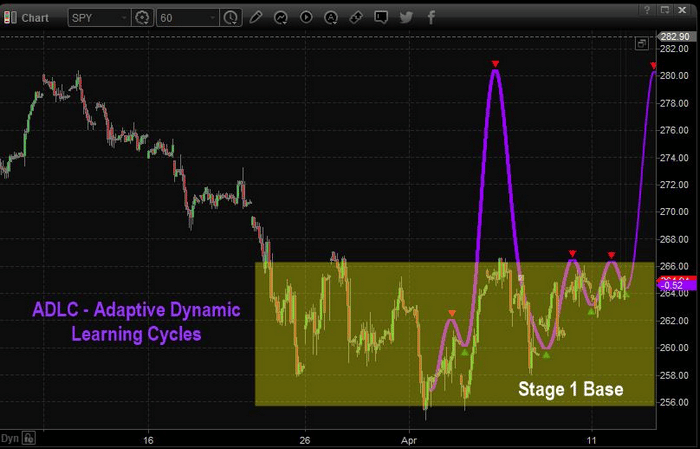
This SPY chart showing our Advanced Adaptive Dynamic Learning Cycles and the Stage 1 basing pattern that we referenced yesterday is still very valid. This resistance channel, near the top of the yellow rectangle, is very clear and we can see prices are tightening near the top of this channel. Our ADLC cycle modeling system is showing a very clear upside breakout – the massive Short Squeeze move.
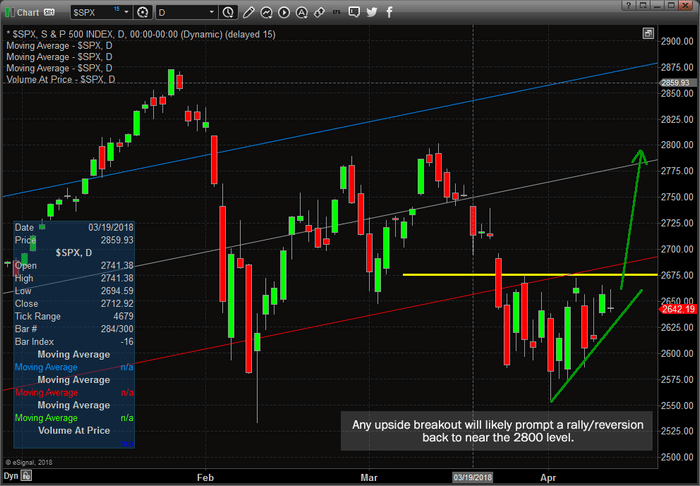
This SPX chart shows a similar setup with a resistance channel near 2675 and a very clear upside potential to near 2800 or higher. What is interesting about this chart is that the Standard Deviation channels show this move would actually be considered a “reversion trade” – back to within normal pricing channels. This means that we could see a much broader move higher with this upside potential – possibly well above 2850.
This final chart is a 240-minute SPX chart that helps to better understand and see the resistance channel that we expect to be broken today or tomorrow. We believe this downside resistance has setup a massive Short Squeeze position that coincides with our ADL and ADLC predictive analysis technology to indicate that we should see a massive upside price move in the immediate future. As traders, this means we have some real profit potential over the next few weeks with this move.
Take a look at our trade alert service Wealth Building Newsletter and tools we provide our members at Technical Traders Ltd. and see how we can assist you in finding and executing great trades like these every week. We have hundreds of members that are following our daily video and other analysis each week. We believe you should have a great team of researchers and traders backing you up with opportunities for greater profits – check us out www.TheTechnicalTraders.comto see how we can improve your trading success.
Chris Vermeulen
https://thegoldandoilguy.com/wp-content/uploads/2018/04/spy3.png449700adminhttp://www.thegoldandoilguy.com/wp-content/uploads/2014/11/tgaoglogo.pngadmin2018-04-12 10:45:392018-04-12 10:45:39SPX Resistance May Prompt A Massive Short Squeeze
New massive breakout patterns have been setting up in the markets for months and our research team at the Wealth Building Newsletter has been quietly watching these setups – waiting for the right time to alert our followers of these exceptional opportunities. Today, we are announcing our research and triggers to all of our followers so you can attempt for profit from our hard work and see just how critical our “Adaptive Learning Tools” are for success.
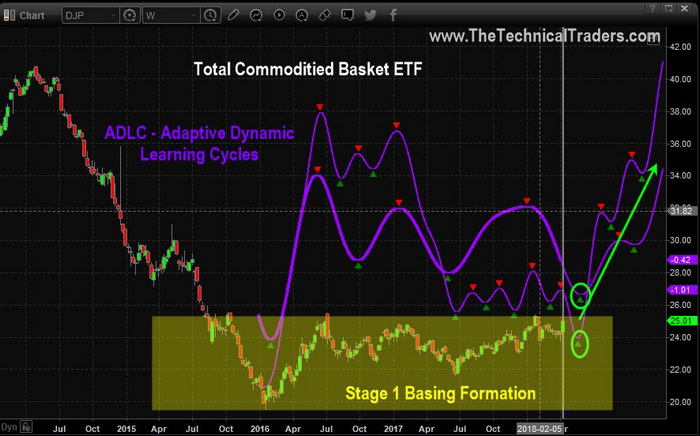
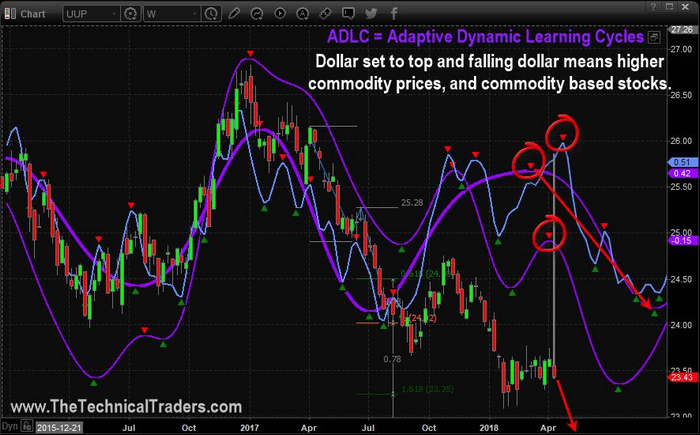
We believe the following charts clearly show just how important these breakout patterns are for traders. This first chart shows the Stage 1 Basing formation that we’ve been following for quite a while with our Adaptive Dynamic Learning Cycles. These cycle projections help us to determine the future potential of any markets as well as help us to understand historical and current price cycle rotations.
Right now, these cycle predictions are warning that a massive cycle bottom is likely to happen within the next 2 to 3 weeks followed by a massive upside price rotation in commodity prices. We don’t believe this future bottom cycle will be very deep – therefore we believe now is an excellent time to consider a positional trade expecting higher commodity prices in the future.
Conversely, our Adaptive Dynamic Learning Cycles are showing future weakness in the US Dollar. Combine these two cycle patterns, weakening US Dollar and potentially stronger general commodity prices, and we have an almost perfect setup for traders and investors. If the US Dollar weakens while external market factors (like foreign geopolitical tensions and trade issues) continue to drive the news cycle, we may be setting up for a very explosive upside move in commodities.
On Wednesday, April 11th, we issued a buy signal in a specific asset which we believe will post the largest gains of all for our subscribers and this can be trades both as an active swing trade, or as a long-term investing position.
We are providing you with this general analysis currently because we believe unique opportunities will continue to present themselves over the next 2 to 5 weeks as this movement continues to play out. We believe active traders will want to take advantage of these setups to execute successful trades as this move extends.
If you want to learn how to profit from these setups and others, please visit www.TheTechnicalTraders.com to learn more about how we help our members take advantage of these setups. Our research team is dedicated to helping you stay ahead of the markets while identifying these types of trading opportunities. You will be amazed how just how stress-free trading and investing can be when you know with a high probability where the markets are headed in the days and months ahead so Join Now!
53 years experience in researching and trading makes analyzing the complex and ever-changing financial markets a natural process. We have a simple and highly effective way to provide our customers with the most convenient, accurate, and timely market forecasts available today. Our stock and ETF trading alerts are readily available through our exclusive membership service via email and SMS text. Our newsletter, Technical Trading Mastery book, and 3 Hour Trading Video Course are designed for both traders and investors. Also, some of our strategies have been fully automated for the ultimate trading experience.
Chris Vermeulen
https://thegoldandoilguy.com/wp-content/uploads/2018/04/bull-marketi.jpg15362048adminhttp://www.thegoldandoilguy.com/wp-content/uploads/2014/11/tgaoglogo.pngadmin2018-04-11 12:34:152018-04-11 12:34:15Rise Of The New Bull Market?
Our articles, Technical Trading Mastery book, and 3 Hour Trading Video Course are designed for both traders and investors to explore the tools and techniques that discretionary and algorithmic traders need to profit in today’s competitive markets. Created with the serious trader and investor in mind – whether beginner or professional – our approach will put you on the path to win. Understanding market structure, trend identification, cycle analysis, volatility, volume, when and when to trade, position management, and how to put it all together so that you have a winning edge.
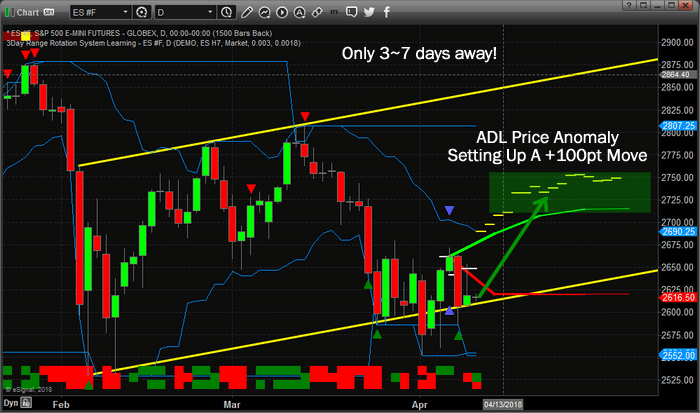
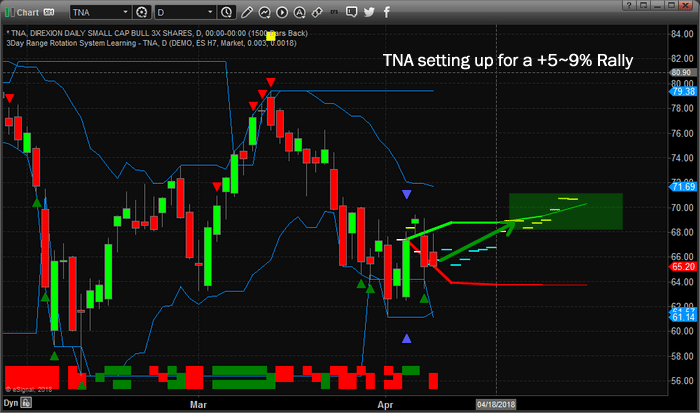
Our Adaptive Dynamic Learning (ADL) modeling system has been hot. Now we want to share something super exciting with all our followers – a super trade setup in the ES. Our research team at Technical Traders Ltd. has identified what may be one of the best trading signals we’ve seen in a long time – a potential +100pt move. That’s right, our advanced predictive modeling system is been calling a bottom in the markets for over 10 days now and we believe the following charts show us the that S&P will be one of the leaders in the move higher. Therefore, we want to urge our followers to be prepared for a potential 100+ pt upside move in the ES within the next 3~5 days and to trade accordingly – we certainly will be.
This chart shows us the ADL price modeling system at work. We can see that the ADL price modeling system is showing a very strong potential for an immediate price rally to well above 2700 on the ES. Monday’s close is 2616. We believe this trigger price anomaly is an exceptional opportunity for traders to identify and capture a rather lengthy upside price move over the next 3~7+ days.
Additionally, our ADL system is showing that this move may be isolated to the S&P. Other price modeling results show more muted bullish price outcomes. This happens sometimes when the market dynamics are diverging a bit. Not every market moves in a similar range. Sometimes the NQ will move 2~3x the range of the other major indexes.
Still, a +5~9% rally in the Small Caps is a decent move. One should never complain about a solid profit on a trade that lasts less than 15 days.
MOST RECENT TRADES:
Want to know what we’re telling our valued members is going to happen next week and the many weeks that follow? Visit www.TheTechnicalTraders.com to learn what we offer our members and to learn how we can help you spot these move days or weeks in advance.
https://thegoldandoilguy.com/wp-content/uploads/2018/04/2.png413700adminhttp://www.thegoldandoilguy.com/wp-content/uploads/2014/11/tgaoglogo.pngadmin2018-04-09 21:42:232018-04-09 21:42:23Buy It When It’s Not Hot!
Recent news about the US and China posturing for Trade Deals and the continued increase in rhetoric has weighed heavily on the markets these past few weeks. Yes, trade issues are a concern for nations and fair trade is essential to support both economies. Yet, the news seems to be exaggerated in scale and scope when one considers the totality of it all. Our research team at Technical Traders Ltd. has recently completed a detailed analysis of the Chinese economy including a study of the expected pressures that are mounting throughout most of China/Asia. A property market cycle, extended debt issues, foreign capital projects, military tensions and now “trade tariffs” are adding up to quite a bit of headwind for the Chinese.
As we discussed in an article last year, we believe capital is like a living organism – always attempting to migrate to sources of better return, less risk and a more healthy environment for success. We believed, at the time of that article, that capital would migrate into the US because of the recent election of a new US President and because of the multiple deregulations and pro-business steps taken by the new US President. At the same time, in 2016/2017, we were keenly aware of a broader market cycle that had been setting up with regards to the early stage price advances throughout 2017.
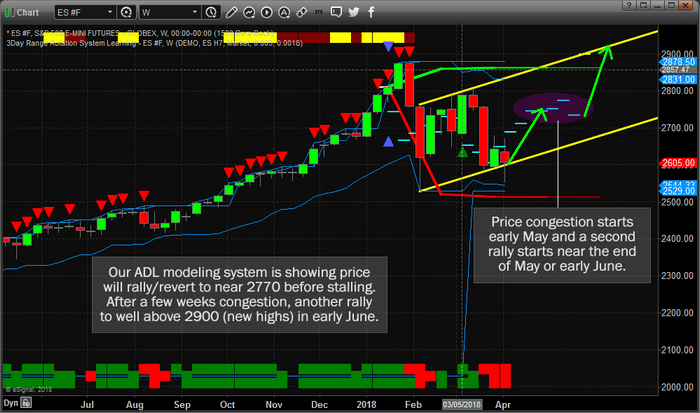
Somewhat similar, we now believe the trade issues in conjunction with economic cycle issues, that are playing out as we write this article, will coincide to drive capital away from riskier environments and, again, towards the US as a “safe haven” investment. We believe this will drive another wave of upward pricing pressure over the next 2~3 months starting with an early stage price rotation in the ES to near 2770.
Take a look at this ES chart with our Adaptive Dynamic Learning modeling system at work. This modeling system is one of the tools we use to help us understand and predict future price moves by asking it to scan and research the highest probability outcomes for the price in the future. One can clearly see the upward price channel, drawn in YELLOW, as a key source of price boundaries. One can also clearly see the ADL predictive learning model showing prices should advance throughout early April to near 2770, then stall near this level for a period of about 3~4 weeks (we expect early/mid May), before another massive advancement in price starts near the end of May or early June. This later stage advancement appears to predict “new highs” set in early June 2018.
Therefore, we are advancing the analysis that this recent news about technology issues (Facebook and others) in addition to the trade issues and comments between China and the US are nothing more than a distraction from the reality that we are discussing multiple nations, multi-trillion dollar economies and billions of global consumers. In a worst-case scenario, certain products and raw materials will cost a bit more over a period of time. These costs will be absorbed into the general economies and consumer costs over time. Over time, traders will come to understand this as an opportunity to take advantage of depressed pricing.
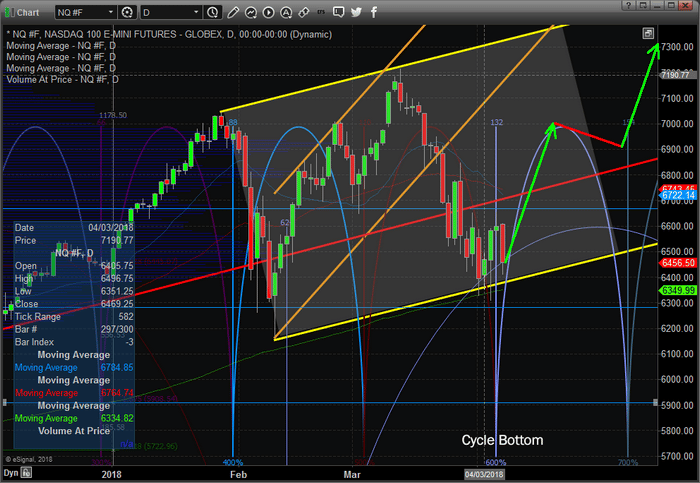
As we apply the same type of ADL price prediction to the NQ, we can see similarities in price setup and advancement. Additionally, we have added a time cycle component to this chart that helps to identify price rotation levels, cycle bottoms, and tops. One can clearly see we have recently passed a massive cycle bottom formation where price rebounded off of the lower price channel.
Additionally, a longer-term price cycle bottom formed in early March. This longer-term price cycle rotation is indicating we should see prices advance through April and May before reaching a peak in the middle of June (sometime). The further out we attempt to predict price peaks and troughs, the vaguer the timeline analysis becomes. We can attempt to predict an immediate price advance simply because the time cycles and ADL price predictions are showing us that price is currently below ADL predicted levels and the predicted levels are moving higher. This tells us that price should rebound from this lower price channel very quickly in an attempt to “re-balance” with expected price levels.
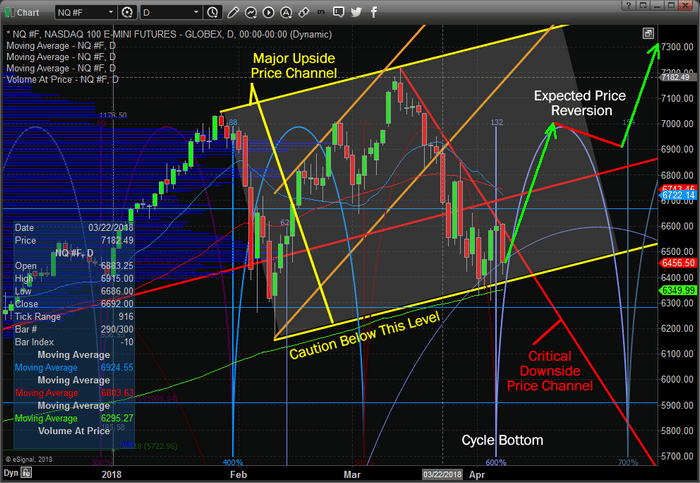
One key element has been added to this next chart, the downward price channel that is currently containing price advancement. Once this level is breached, we believe the move higher will be aggressive and sustained. All of this analysis coincides with a number of factors that play into our analysis. We believe that capital will continue to migrate into the US as a safe haven from foreign market crisis events. We believe that China/Asia are on the cusp of a potential asset/general market downturn. We believe that other nations will experience a “ripple effect” from the China/Asia rotation that we are predicting. And we believe these events will drive further investment into the US markets and equities as a source of continued returns.
Overall, we do believe that at some point in the near future the US market will experience a massive price rotation that will begin a new bear market – but we don’t believe that is happening right now. As you can see from the chart, above, we have indicated that “Caution Below This Level” would be an early warning signal that a deeper price rotation may be set up. As long as the price stays within this major upward price channel, we should see a mean price reversion to the projected levels and if our ADL predictions hold true, we will likely see new price highs before the end of June 2018.
If you want to learn more about our research team, specialized tools for traders and how we can assist you in taking advantage of these price swings, please visit www.TheTechnicalTraders.com to learn more and to read our previous research articles. We offer daily videos, commentary, trading signals and more to our members to assist them in profiting and preparing for these future market moves. Our advanced technologies provide us a unique view into the future. If you want access to our powerful tools and to become a profitable technical trader, then please visit www.TheTechnicalTraders.com to see how accurate our technology has called all of 2018 – almost to the exact day of many price tops and bottoms.

 Want to know what we’re telling our valued members is going to happen next week and the many weeks that follow? Visit