Want to see the new trade that was issued today for TheTechnicalTraders.com members and take advantage of this opportunity, then do yourself a favor and sign up for our QUARTERLY membership so you can see how we help our members generate profits and stay ahead of the markets every week also!
RESEARCH POSTING ANNOUNCEMENT
After careful consideration and respect for our members and followers, as of May 1, 2018, we have decided to make all of our more detailed and dedicated price modeling research only available to our subscribers and members while still attempting to provide more general market research to our non-member, free followers. We are making this alteration to our posting and publications in an effort to provide more exclusive value to our members and to limit the free public exposure of our proprietary price modeling systems that have been generating incredibly accurate price triggers over the past 7+ months. Our efforts are to better support our members and to make our proprietary research exclusively available to our subscribers – the people that support our research and team of developers at Technical Traders Ltd.
We will continue to post research articles regarding the markets, trend and forecasts for our free followers to learn from and gain market insight. Our proprietary market cycles, Fibonacci price modeling, Adaptive Dynamic Learning (ADL) price modeling and other proprietary research models will become exclusively published within our members area for our valued subscribers to profit from.
We have been contacted by a number of people recently who have expressed their admiration and astonishment of our posts, research and price modeling system’s success. We believe we are offering the most innovative and inclusive market research that you can find anywhere. We don’t know of anyone that has the tools we have or has the capabilities we have in regards to accurately predicting market trends, turning points and setups. All you need to do is read our recent posts to know how incredible our calls have been in the markets for the past 7+ months.
We urge you to become a subscriber of www.TheTechnicalTraders.com to continue receiving our advanced research and access to our incredible price modeling systems. If you want to know where the market is going today, tomorrow, and next month, and if you want some greater insight regarding what to expect from price, then you owe it to yourself to join today and make your trading decisions easier and more profitable. Remember, we called every major move in the markets this year and at least 3 weeks in advance – where else are you going to be able to get that type of analysis?
We look forward to continuing to serve all of our followers and subscribers. We will still post-free research posts to the general public. They will simply be more general and exclude our proprietary market turning points and price forecasts. JOIN NOW!
Respectfully,
Chris Vermeulen & team
https://thegoldandoilguy.com/wp-content/uploads/2018/04/signal.png717747adminhttp://www.thegoldandoilguy.com/wp-content/uploads/2014/11/tgaoglogo.pngadmin2018-04-30 14:33:032018-04-30 14:33:03Trade Setup & Last Research Posting Announcement!
Here at Technical Traders Ltd., our inbox has been full of questions from followers regarding the recent market rotation and concerns about another downside move. We understand trading is an emotional process and that fear and anxiety often play a very big role in decision making – we get it. So, before the markets open for trading this week, we wanted to share some exciting news and we hope this helps to settle some emotions.
As you are probably well aware of by now, our Adaptive Dynamic Learning (ADL) price modeling systems has been nailing the markets for the past 7+ months for both intermediate and intraday highs and lows. One of the most powerful components of this predictive modeling system is watching for price correlation to modeled behavior and watching for what we call “price anomalies”. We have mentioned this before in previous research articles.
Before we continue, its important to mention that we will no longer be posting these (ADL) forecasts and trade setups publically. This analysis is reserved for our subscribers and for our own trading to take full advantage of the markets.
Price anomalies occur when the current market price is under some level of pressure (upward or downward) that pushes price away from the predicted levels. This happens with global news events, earnings events and other market psychology events. Our opinion is that price reacts to these external events over a relatively short period of time, then, as the events settle, price reacts to the traditional behavioral models predicted by the ADL modeling system and attempts to recover to near these predicted levels. Let’s take a look at a recent example of these ADL price anomalies and how the work.
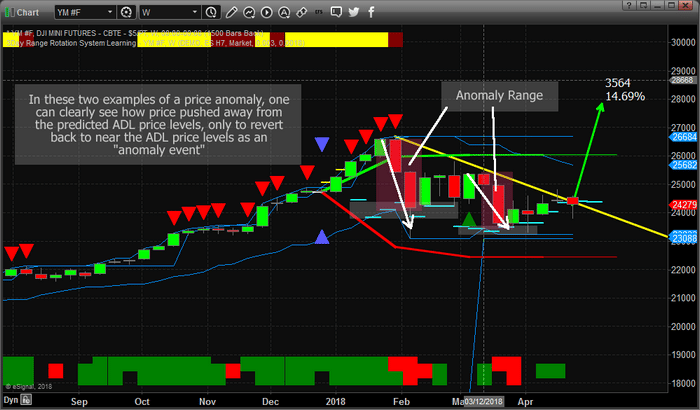
In this example below, we see two recent weekly ADL price anomalies and how the market price reacted to “revert” back to the ADL predicted price levels. We believe these types of events are price level exceptions that occur with some regularity in the markets and can be traded to our advantage for some incredible gains. Pay attention to the DASHED baby blue lines from the ADL modeling system that shows the predicted price levels.
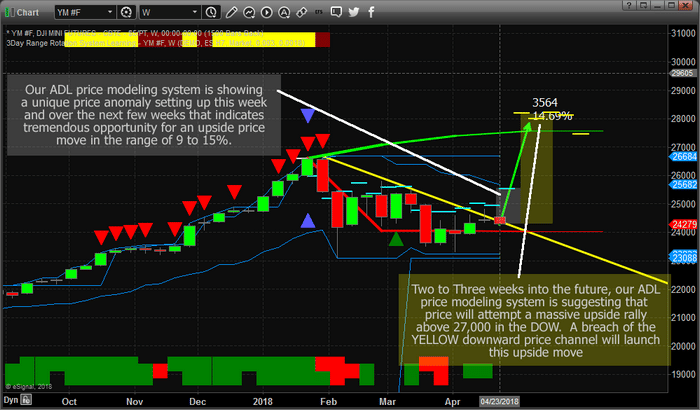
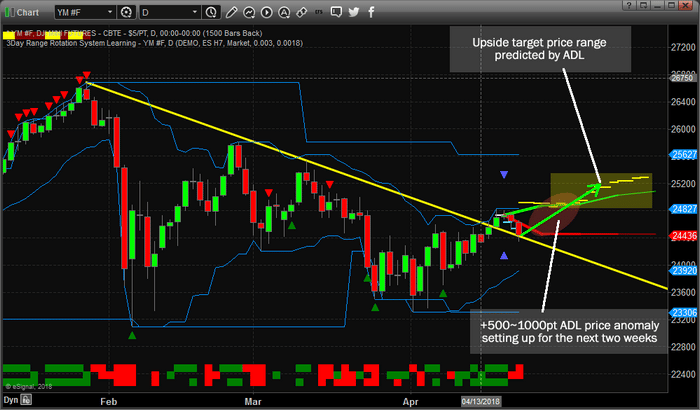
Now, lets take a look at a current Weekly YM chart to see how the current price anomaly is setting up. Almost similar to the first price anomaly in the upper example, yet in the opposite direction, the current price anomaly is indicating an incredible 10~14%+ upside price potential within the next 2 to 5 weeks. We believe this upside potential is being ignored by much of the market because of the recent downside price pressures that have kept a lid on the upside breakout. We do believe that once that downward sloping YELLOW price channel line is breached, the upside price move will begin and likely be a VERY FAST move up.
Lastly, you might be asking yourself how we reconcile various ADL predictive price levels that could present various or conflicting predictive pricing? First, please understand that the ADL price modeling system is just one of the tools that we use in our analysis. Secondly, the data you are not seeing which is only shown to the researchers and analysts is the “predictive probability” of each predicted price level.
We know which levels have a higher degree of probability than others – thus we can use this knowledge to determine which outcome is more likely. Also, more recent analysis from the ADL pricing model with high degrees of price correlation and probability are, in our opinion, more relevant to the future price levels than older price analysis. With our ADL predictive modeling system, we can see many days, weeks or months into the future – the trick is to understand how to use it properly.
In closing, with all the fear and emotions running at high levels, we wanted to settle our readers minds a bit with this analysis and these charts. If you take a look at the predictive price level for this next week, the YM should attempt to move back to near 25,540. The following week, the YM should be attempting a more aggressive upside move to near 27,500 or higher. We are just waiting to see that YELLOW price channel line be broken before this price move initiates.
If you want to learn more about our analysis or maybe you just want winning trade alerts, take a look at our Wealth Building Newsletter service and see how we can assist you in finding and executing great trades every month. We have members from 87 countries that following our daily technical analysis video and trade alerts each week. Visit www.TheTechnicalTraders.com
https://thegoldandoilguy.com/wp-content/uploads/2018/04/Chart_18-04-29_YM_Weekly_ADL.png410700adminhttp://www.thegoldandoilguy.com/wp-content/uploads/2014/11/tgaoglogo.pngadmin2018-04-30 13:44:362018-04-30 13:44:36US Dow & Majors Setting Up For A Massive Move
In this article, we are going to explain and show you an interesting pattern that has been slowly forming over the past year in the precious metals sector. This pattern along with our analysis point to a significant rally to start in the next 4 months for gold, silver, platinum, palladium, and miners.
Before we get into the details, below, it is important for every trader to step back and look at the bigger picture. It’s way too easy to get sucked into the markets movements, become an emotional trader, start losing a few trades, and second-guessing your open positions.
We receive hundreds of emails every week from followers, and to be honest, this is one of the most powerful indicators available for letting us know when the majority of people are frustrated and have become emotional traders. Based on recent emails, their tone of the message, and market outlooks we can tell everyone is emotional and not seeing the market from a normal unemotional perspective.
There is no doubt it is easy to get caught-up in the market and become an emotional trader if you don’t have a proven trading strategy for each type of market condition, advanced trading analysis, or trading guidance from a proven trading newsletter.
These past 30 trading days have been really tough to trade because the market is chopping around with huge one day moves back to back. Sometimes, its best to sit, watch and wait for some dust to settle before getting overly involved with new trades which is what we have done. Recently we traded YANG for a quick 8% profit, then we closed out two trades in TNA to profit 10.1%, then another 17.7% this month. Other than that, that’s about it. Now, with that said, things are about to get really exciting for us traders and we are getting ready for some new trades, both short-term and longer-term, looking forward many weeks and where the market should be headed.
Enough about all that emotional stuff, let’s jump right into the charts so you can see what we are excited about in this post!
Weekly Custom Precious Metals Weekly Chart
The chart below shows several interesting data points and it’s fairly easy to see and understand.
Starting at the bottom of the chart you will see the purple line which is the Relative Strength Index (RSI). If we look back 4 years you can see a similar pattern unfolding which leads to a massive rally for precious metals back in 2016.
Knowing human behavior patterns don’t change, but rather repeat, it is likely we see another upside breakout and rally later this year. That does not mean, the price will go straight up, it simply means on average over time we should expect higher prices.
Before any new rally can take place, the precious metals sector must breakout above the pink falling trend line, just as it did in 2016.
If you didn’t notice already, we have posted our weekly cycle analysis for the precious metals complex. Over the next 6 – 8 weeks the sector should start to rally and try to break out. Again, this does not mean everything in the precious metals sector will rise. In fact, there are a couple areas you will want to stay away from. We share the best trade setups and alerts with our subscribers as they occur.
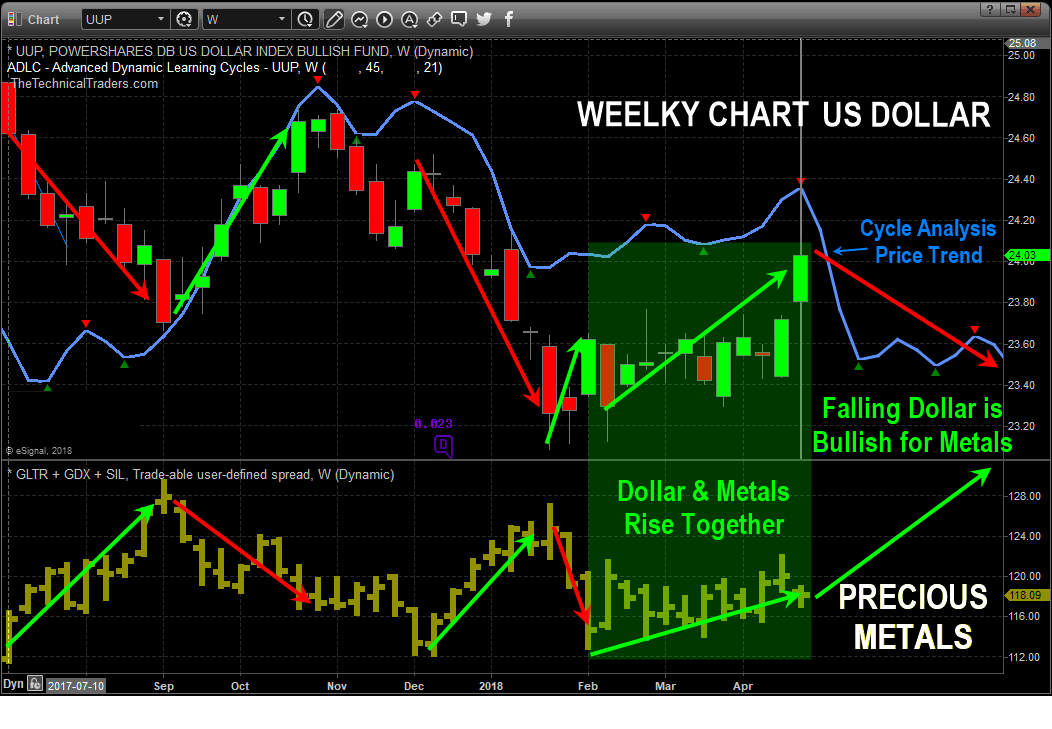
Weekly US Dollar and Precious Metals Comparison Chart
Here we show you on the chart the basic concept of how a falling dollar will push the price of gold higher, and how a rising dollar pulls metals lower on average. But this is not always the case. In fact, recent price action shows the dollar moving sharply higher while the precious metals sector moved sideways and higher. This looks like bullish divergence from their normal correlation and is likely caused by different global market dynamics injecting some new level of a fear that is funneling money into gold as a global safe haven.
Concluding Thoughts:
In short, we at www.TheTechnicalTraders.com have been talking about the new bull market slowly setting up for precious metals since late 2017. As an investor and trader its always nice to be able to look forward knowing with a high probability what asset classes should be moving in and out of favor so we can position our capital accordingly.
If our analysis is correct once again, then over the next couple months this sector should be testing critical resistance to breakout and rally above the pink trend line. If you want to stay ahead of the markets and profit from our technical analysis then join the Wealth Building Newsletter now and get ready for this week!
53 years experience in researching and trading makes analyzing the complex and ever-changing financial markets a natural process. We have a simple and highly effective way to provide our customers with the most convenient, accurate, and timely market forecasts available today. Our stock and ETF trading alerts are readily available through our exclusive membership service via email and SMS text. Our newsletter, Technical Trading Mastery book, and 3 Hour Trading Video Courseare designed for both traders and investors. Also, some of our strategies have been fully automated for the ultimate trading experience.
Chris Vermeulen.
https://thegoldandoilguy.com/wp-content/uploads/2018/04/1.jpg7661051adminhttp://www.thegoldandoilguy.com/wp-content/uploads/2014/11/tgaoglogo.pngadmin2018-04-29 13:21:462018-04-29 13:21:46Precious Metals and Mining Stock Chart Paint A Clear Picture
One very important component of the continued research we, www.TheTechnicalTraders.com, conduct into price, price patterns and price rotation is the study and application of Fibonacci price modeling. As you have seen with some of our other charting and modeling tools, we have invested a great deal of time and energy to create useful price modeling tools to assist us in our daily research and analysis.
Our Fibonacci price modeling tool is another adaptive learning model that is capable of adapting to price rotation by learning from past and current price variances as well as repeated price pattern formations. This tool is a one of a kind type of project that we covet with a great deal of respect.
Today, we are going to illustrate how this modeling system assists us and how we attempt to use it to identify trading opportunities and longer-term potentials for success. As of April 24, the markets closed dramatically lower – by almost -2% on average. This move lower pushed many of the current prices into a unique price pattern that may be very temporary. We will start by attempting to illustrate the NQ chart with our Fibonacci price modeling system and we want to make one thing very clear….
Today’s downside price rotation, excluding the ES chart, setup a new potential for future bearish trending if the current price is unable to recovery back above the key Fibonacci Bullish Price Level.
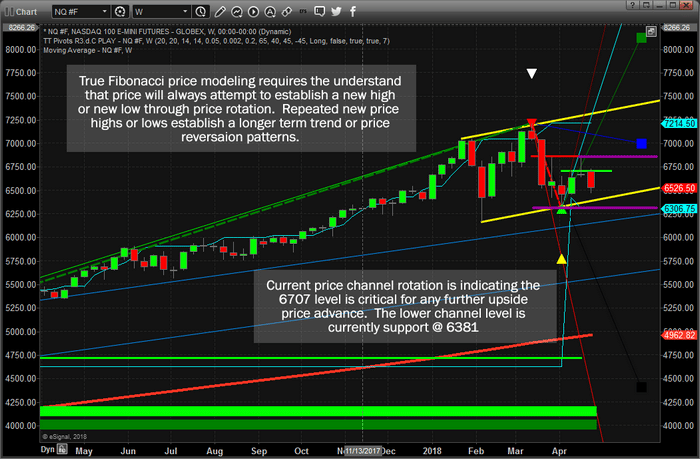
Let’s get started with the NQ chart. The first things we want you to concentrate onto are the YELLOW price channel and the PURPLE price high/low ranges established by price rotation. It is critical that you understand how price rotation, pure price, sets up all of the analysis that this modeling system completes. Nothing else is used other than price and time. The most recent price high and low levels (in most cases) establish the Fibonacci price range. This is what we use to make trending decisions.
This current NQ chart has rotated lower and is currently telling us that we should expect further downside price activity as long as price stays below the Fibonacci Bullish Price Level. Although, our ADL price modeling system is warning that the markets will enter a strong upside rally within days. Thus, it is our opinion that this recent move is a “wash-out” low price rotation that is attempting to fade the longs. The NQ Fibonacci price high is at 6867 and the Fibonacci price low is at 6307 – watch for these levels to be breached before trend accelerates.
The ES chart is set in a similar price formation to the NQ chart. Highlighted on this chart are three primary components of our Fibonacci price modeling system; the projected price levels, the Bullish & Bearish Fibonacci key price levels and the key market price rotation markers (tops and bottoms/price rotation points). Understanding our modeling system is key to your better understanding the research that we provide to you. On the right side of this chart, we’ve highlighted two key projected price levels with lines drawn in CYAN (light blue). We want you to pay special attention to those projected price levels because they became key support and resistance just a few weeks ago. If you understand the significance of this example, you’ll begin to see how past price rotations attempt to predict future price turning points using advanced Fibonacci concepts and theory.
IMPORTANT NOTE: If all of this is a little to advanced to understand, that’s ok too. Maybe you don’t want to understand or learn, and just want nothing but our best trade setups and alerts? Well, members can have our SMS trade alerts so they get only our Buy, Stop, and Profit Taking alerts. Meaning you have trade like a pro and only spend 10-30 minutes a weak to adjust a position or enter a new one as you receive an alert!
This ES chart is showing a similar analysis to that of the NQ – expect continued bearish price action unless the current Bullish Fibonacci price level is breached @ 2718.50. Again, we believe this current downside price move is a “wash-out” low price rotation within a bullish trend. One of the reasons we believe this to be the case is clear if you understand price rotation. Look at the entirety of the move recent price rotation. After establishing the key low price bottom, price has failed to attempt to take out that low.
Remember, price must always attempt to establish new highs or new lows through price rotation within Fibonacci theory. Therefore, until that low is breached, and as long as new higher low has been created, price is failing to commit to new lower lows. Thus, it must be attempting to commit to higher highs. The ES Fibonacci price high is at 2718.50 and the Fibonacci price low is at 2552.00.
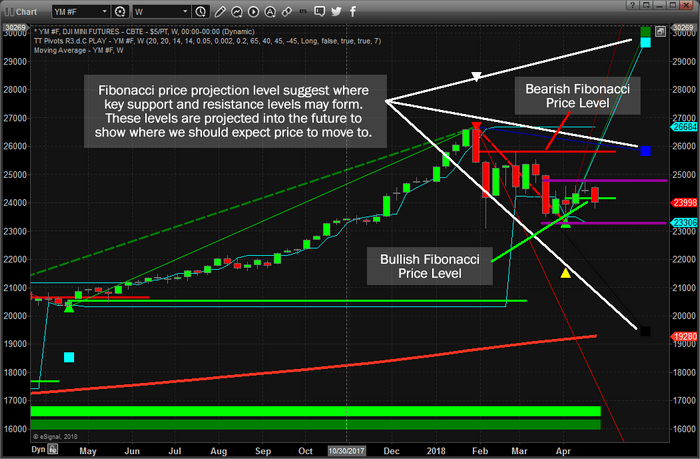
The YM chart below provides the clearest picture, in our opinion, of the detailed Fibonacci price rotation process. Very similar setups in price are still in place between all three charts. Yet, the price rotation on the YM chart provided clear confirmation that price was attempting to advance rather than collapse recently. The Bullish Fibonacci Price Level on the right side of the chart was breached and confirmed three weeks ago with a close above 24135. The NQ and ES did not achieve this key price element in Fibonacci theory.
Additionally, the BLUE downside price projection point was very shallow compared to the recent peak high. This is typically a sign that any price rotation may be shallow as well and short lived. As of the recent closing, the current close is below the Bullish Fibonacci Price Level, thus we are expecting some potential weakness in price until it advanced back above this level. Yet, our believe that this “wash-out low” is a process of targeting near priced longs is still valid. If, at the end of this week, price is back above the Bullish Fibonacci Price Level, we will have further confirmation that this downside move was just a “wash-out low”. The YM Fibonacci price high is at 24827 and the Fibonacci price low is at 23306.
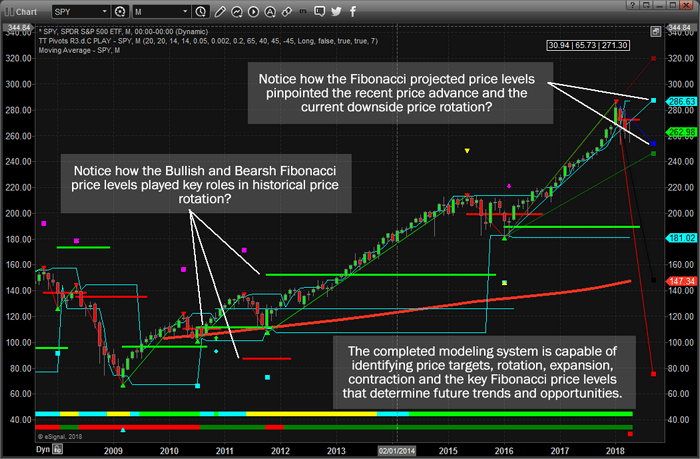
Lastly, we are going to show you a much longer term Monthly SPY chart running our Fibonacci price modeling system for comparison.
When you look at this chart below and compare the price action you see to the previous chart, remember this Monthly chart is really the key to the longer term price potential. As of right now, the current price is below the Bearish Fibonacci Price Level, which indicates a reason to be concerned with potentially further downside price activity. Yet, the projected Fibonacci price levels have clearly defined support and resistance at, or very near to, the current price rotational high and low. This would indicate that the current price rotation is within expected ranges and until a new closing price low is established below the 253.70 level. Any downward price move will find support near 246.30 (the GREEN projected price level).
Price MUST advance +4% from current levels to abate any downside pressure resulting from this recent move. In other words, we need to see a solid price advance over the next 5+ trading days, before the end of April, to technically qualify any further advance higher based on this Monthly Fibonacci modeling system. Of course, the Daily and Weekly models will tell us a much faster and more detailed shorter-term Fibonacci price model for this same price rotation.
We’ve received hundreds of comments regarding our Adaptive Predictive Learning (ADL) price modeling system and we love to hear how all of your are enjoying our research. This Fibonacci price modeling system, once you understand it as well as we do, is a very powerful price modeling tool that helps us identify unique opportunities in the markets for our clients. Each of these tools provide unique benefits and understanding as to what to expect in the future. We try to condense all of this into easy to understand daily updates for all of our valued members so you don’t have to spend decades trying to learn and understand all of this.
Currently, our ADL price modeling system is telling us the markets will attempt to rocket higher within 3~5+ weeks. You’ve probably seen that research or can view it on our web site or from our free email newsletter. Our Fibonacci price modeling system, is warning us that price could fall below support if it does not rally back above the Bullish Fibonacci Price Levels as our ADL model is predicting. Thus, we are suggesting this current downside price rotation is likely a “wash-out” price low that may become somewhat meaningless in the near future.
Follow our Daily video forecasts and our future research to learn more about how we help our clients find profits in these moves. We are already positions for what we believe will be the best opportunities for success with our members. Join us and learn how we can help you find greater success – visit www.TheTechnicalTraders.com today.
https://thegoldandoilguy.com/wp-content/uploads/2018/04/fib.jpg10932048adminhttp://www.thegoldandoilguy.com/wp-content/uploads/2014/11/tgaoglogo.pngadmin2018-04-26 16:53:242018-04-26 16:53:24How to Trade Indexes with Fibonacci
Natural gas making a quick, unexpected setup and move.
Equities finally show fear and panic today for a pivot low to be in place.
The dollar continues to climb while all other currencies fall.
https://thegoldandoilguy.com/wp-content/uploads/2018/04/howest-video-interview-Copy.png372594adminhttp://www.thegoldandoilguy.com/wp-content/uploads/2014/11/tgaoglogo.pngadmin2018-04-25 21:26:502018-04-25 21:26:50US Dollar Soaring With Eagles, What Does it Mean?
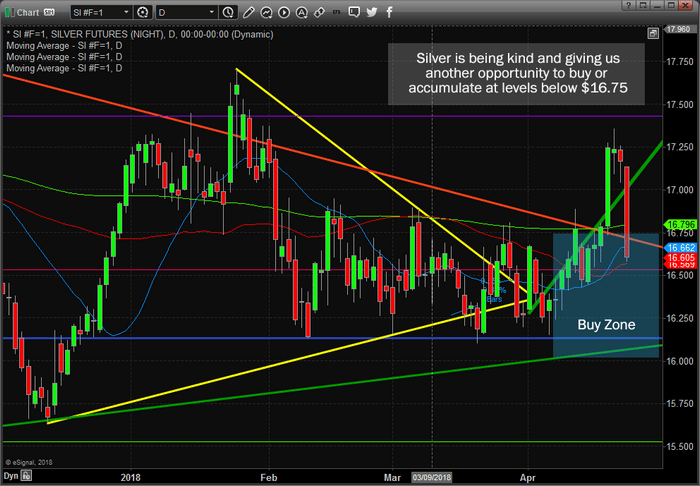
Our recent silver analysis could not have been more accurate. Please take a minute to read it before you continue reading the rest of this post if you have not already done so. The Silver price breakout, to near $17.20, last week was incredible. It established a new Fibonacci price trend, established a downward channel price breakout, coincided with a Pennant/Flag price formation breakout and the wave count of this Pennant Flag breakout was perfect.
Our research indicated that after this $17.20 price breakout happened last week, any retracement below $16.75 while price held above support near $16.00 would constitute a “BUY ZONE” where traders could begin accumulating physical metal or equity shares. The move lower today in Silver, which is related to the US Dollar and Bond yields move today, may be an absolute gift for metals traders. We mean this could be a “fire sale” type of gift if prices continue to stagnate below $16.50 for a few days.
As much as I would like to tell you that Silver is rocketing higher as we predicted, we have to learn to play these price rotations to our advantage – especially when the markets are handing you opportunities like this. Again, $16.00 is our support level currently. Anything below $16.75 and above $16.00 is our BUY ZONE. We are waiting to see how the market this week before we make a decision on accumulation, but this looks like an excellent opportunity to consider adding to our existing positions/physical holdings if one has the opportunity. Remember, the upside potential of this move could be as much as 25~70%.
If you want to know how to take advantage of these moves and stay ahead of the markets, then visit our website to learn how we help our valued subscribers find and execute success every month. These types of tools are only one component of what we offer our members – we also offer Daily video analysis of the market, advanced research posts, Daily updates and more. We know we are the only research team that can offer you these types of advanced predictive modeling systems. If you have ever wanted to know what the markets are going to do with relative certainty, join us today.
Our articles, Technical Trading Mastery book, and 3 Hour Trading Video Course are designed for both traders and investors to explore the tools and techniques that discretionary and algorithmic traders need to profit in today’s competitive markets. Created with the serious trader and investor in mind – whether beginner or professional – our approach will put you on the path to win with our stock and ETF trading signals. Understanding market structure, trend identification, cycle analysis, volatility, volume, when and when to trade, position management, and how to put it all together so that you have a winning edge. Visit: www.TheTechnicalTraders.com
https://thegoldandoilguy.com/wp-content/uploads/2018/04/1-1.png486700adminhttp://www.thegoldandoilguy.com/wp-content/uploads/2014/11/tgaoglogo.pngadmin2018-04-24 19:21:462018-04-24 19:21:46Silver gives us another chance to accumulate and buy
Pay attention to the price movement of the transportation sector for a clearer picture of the future rally
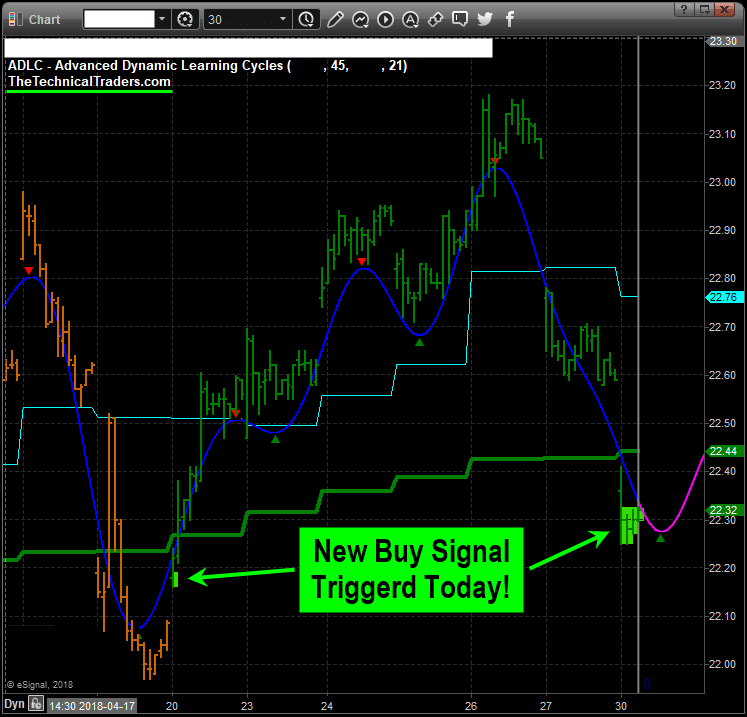
If you have been reading and following are posts this year then you’ve seen the power of our Advanced Dynamic Learning price modeling system and how well we are able to find key market moves. On Monday, the markets stalled, providing further evidence of the future breakout move. The Banking Index was up 0.43%. The $INDU was off by 0.06% while the ES, NQ and YM were mixed. The Transportation Index was up 0.40% while the US Dollar is about to break above the $91.00 level on an attempt to move higher. These moves are telling us that the US economy is about to break higher in an attempt to retest recent highs – just as our ADL predictive price modeling system has been warning.
This chart of the Transportation Index clearly shows the Weekly price cycle rotations and the recent cycle bottom that occurred on April 2, 2018 – about three weeks ago. This cycle bottom also coincided with the major market bottom formation and early stage price rally that we’ve been experiencing for the past few weeks. Support is currently at 9800 in the TRANS and we believe this cycle pattern will drive the US major market and TRAN higher till near early July 2018.
We believe this move could be explosive to the upside as our ADL price modeling system shows that anytime a price anomaly setup occurs, price usually attempts to re-balance itself with the predictive modeling behavior in a quick and sometimes violent price move. Be prepared for a potentially explosive upside move here folks.
If you want to know how to take advantage of these moves and stay ahead of the markets, then visit www.TheTechnicalTraders.com to learn how we help our valued subscribers find and execute success every week. These types of tools are only one component of what we offer our members – we also offer Daily video analysis of the market, advanced research posts, Daily updates and more. We know we are the only research team that can offer you these types of advanced predictive modeling systems and you can see the value we can offer you. If you have ever wanted to know what the markets are going to do with relative certainty, then you owe it to yourself to see how we can help you see opportunities more clearly.
53 years experience in researching and trading makes analyzing the complex and ever-changing financial markets a natural process. We have a simple and highly effective way to provide our customers with the most convenient, accurate, and timely market forecasts available today. Our stock and ETF trading alerts are readily available through our exclusive membership service via email and SMS text. Our newsletter, Technical Trading Mastery book, and 3 Hour Trading Video Courseare designed for both traders and investors. Also, some of our strategies have been fully automated for the ultimate trading experience.
https://thegoldandoilguy.com/wp-content/uploads/2018/04/Chart_18-04-23_TRANSRally.png486700adminhttp://www.thegoldandoilguy.com/wp-content/uploads/2014/11/tgaoglogo.pngadmin2018-04-23 22:04:042018-04-23 22:04:04Transportation Stocks Are Not Moving and What It Means
We are constantly amazed that our Advanced Dynamic Learning (ADL) price modeling system has been incredibly accurate over the past 7+ months. Our researchers, at www.TheTechnicalTraders.com, called the early 2018 rally weeks in advance. We called the resistance levels and top in late January. We called a February 21~27 market top formation, called the market bottom on March 28, and last week called the market top to the hour and locked in 17.7% trading a simple 3x index ETF. Today, we are going to further illustrate the power and capabilities of the ADL price modeling system and what we are expecting over the next 7~10+ trading days.
Part of the power of the ADL price modeling system is the ability to see what the future may include as far as price targets and potential setups. When price mirrors the targets relatively closely, we assume the ADL predictions were accurate and that price is tracking the ADL predicted targets well enough to not expect many anomalies. But when price diverges from the ADL predicted targets by a wide range, we experience a “price anomaly” that indicates a very unique opportunity for profits. Think of these price anomalies as unusual price support or pressure causing price to deviate from the ADL predicted price targets for a short while. Price should, assuming that the ADL predicted price targets are like future price anchor points, attempt to move towards these future ADL price targets and may move towards them in an aggressive manner. When the anomaly sets up and the price range is substantial, it usually means that we have a fantastic opportunity for profits setting up as long as price attempts to recover towards the ADL price targets.
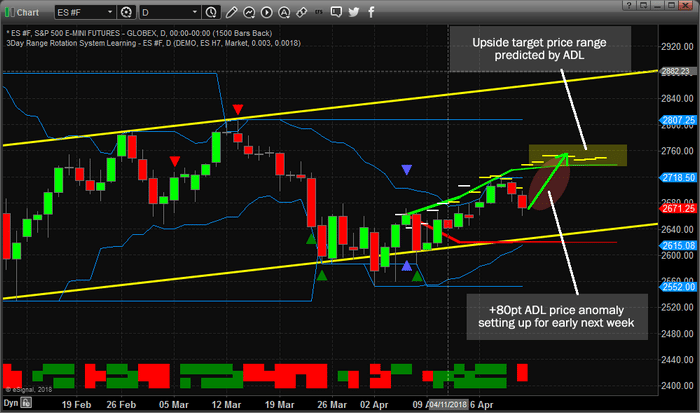
Here is our first example, the ES Daily chart. We’ve highlighted the price anomaly window with a dark red eclipse shape and you should be able to clearly see the +80 pt price gap that is setting up as of the close on Friday, April 20. If you follow the DASHed ADL predictive price targets on this chart, you will see that prices have been below most of these ADL price targets over the past two weeks and the most recent price levels were expected to drop a bit, but not as deep as the pullback extended today. This type of setup creates the anomaly pattern we look for as opportunity for a future upside, in this case, move. Our theory is that price will attempt to re-balance, or track back, to the ADL predicted price targets. This means we are setting up for a +80 to +100 pt upside move in the ES.
Additionally, the YM chart is showing a similar pattern with a similar ADL anomaly range. This chart should seem oddly similar to the ES chart. The ADL price modeling system is showing similar types of future price targets, yet the YM targets are slightly varied from the ES targets. The ES is expected to rocket higher over the next 2~5+ days where the YM appears to track an immediate +400~500 pt upside move, then stall for a few days, then continue higher for an additional +400~500 pts. You should be able to see this setup by tracking the YELLOW DASHed ADL predictive price targets on this chart.
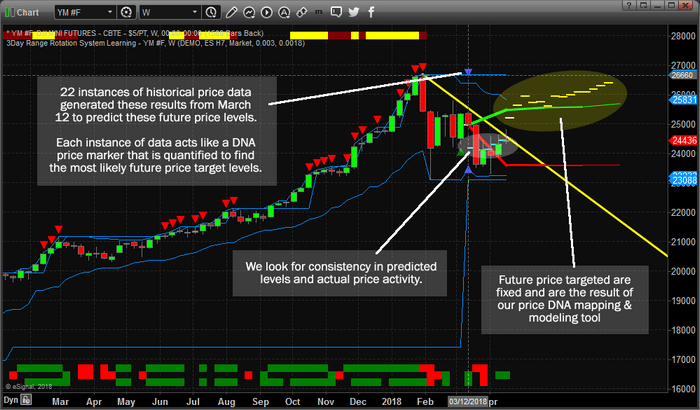
We’ll close our this research with a YM Weekly chart to more clearly illustrate what the ADL price modeling system is suggesting for the extended future. Remember, these ADL predicted price targets go all the way forward to the end of July, 2018 – nearly 3 months into the future. Yes, we can attempt to see well into the future with the ADL price modeling system and as long as we continue to refresh our analysis for newer, more recent ADL events, we should be able to accurately map out the future of almost any market.
Yet, what is interesting about this Weekly YM chart is that the ADL predictive analysis modeling system took data from 22 historically similar instances of price/technical data, which we call Price DNA mapping, and attempted to predicted the future price targets based on all of this data that tracked quite well over the past 5~6 weeks. If you study the DASHed levels on this chart, you’ll see that prices tracked these predictive levels almost perfectly over the past 5+ weeks and that the future predicted price targets are all substantially higher than the current price level. In this case, on this Weekly YM chart, it appears the upside ADL price target levels are +1000~1800 pts higher than the current price. That would be a fantastic move for LONGs if this move happens.
Yes, the same Daily YM ADL price anomaly is setting up with a +1000 Daily price target, yet the Weekly ADL modeling chart shows us that this upside move may actually be far greater than we expected from the Daily chart. What should a trader do with this type of information?
That’s right, traders should understand this is an opportunity for a potentially immediate upside move beginning early next week in the US majors. We believe many traders did not want to hold positions over the weekend after the Syria events last weekend. We believe last weeks selling was a “washout low” psychological event that is not related to fundamental price dynamics. We believe in our ADL system because it has proven to be extremely accurate over the past 7+ months and we believe this move will execute just as we have described in this research post.
With that said, these broad based market predictions are not nearly as easy to trade and profit from as you think. The fact is, the market has a way to shake you out of positions just before the move you expect to happen takes place. The market manipulates and takes advantage of emotional traders to the extreme.
If you want to know how to take advantage of these moves and profit consistently from the markets, then visit www.TheTechnicalTraders.com to learn how we help our valued subscribers find and execute success every week. These types of tools are only one component of what we offer our members – we also offer Daily video analysis of the market, advanced research posts, Daily updates and more. We know we are the only research team that can offer you these types of advanced predictive modeling systems and you can see the value we can offer you. If you have ever wanted to know what the markets are going to do with relative certainty, then you owe it to yourself to see how we can help you see opportunities more clearly. Visit www.TheTechnicalTraders.com today.
ABOUT TECHNICAL TRADERS LTD:
53 years experience in researching and trading makes analyzing the complex and ever-changing financial markets a natural process. We have a simple and highly effective way to provide our customers with the most convenient, accurate, and timely market forecasts available today. Our stock and ETF trading alerts are readily available through our exclusive membership service via email and SMS text. Our newsletter, Technical Trading Mastery book, and 3 Hour Trading Video Course are designed for both traders and investors. Also, some of our strategies have been fully automated for the ultimate trading experience.
https://thegoldandoilguy.com/wp-content/uploads/2018/04/Chart_18-04-20_YM_ADL_W.png410700adminhttp://www.thegoldandoilguy.com/wp-content/uploads/2014/11/tgaoglogo.pngadmin2018-04-22 09:45:362018-04-22 09:45:36Predictive Modeling Is Calling For A Continued Rally
Everyone is talking about the incredible price move in silver on April 18, 2018. For years we have been talking about the setup in the metals markets and alerting our members to opportunities as they arise. Recently, we alerted our members to an incredible opportunity in Silver and we caught this move before it skyrocketed higher. Now, everyone wants to know what’s next. Here is our take on the Silver trade and what you need to know.
All the technical and price valuation indicators regarding the relationship of Gold to Silver have been set for many months telling traders that Silver is the clear leader in any price advance in metals.
Current open positions show that a relatively strong short bias has been in place in Silver for a few months. This adds to the potential of a massive short squeeze rally playing out over the next few weeks/months. Additionally, as greater fear enters the markets, Gold and Silver will likely advance quite substantially.
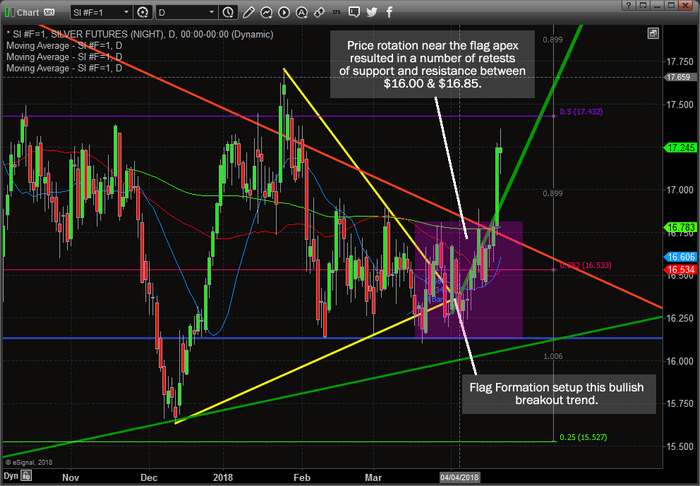
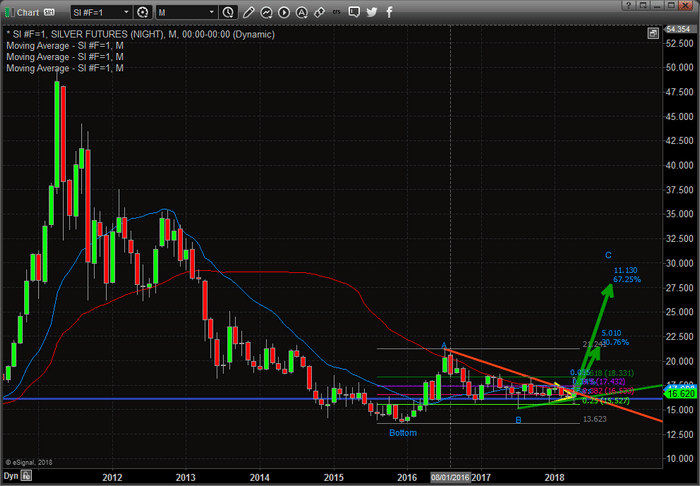
Technically, Silver has entered a new phase of trend on April 11, 2018 with a new price high that broke previous high price levels. This indicated that Silver may attempt a price breakout with a new bullish trend. Additionally, a convoluted FLAG formation completed near that same date and price began to oscillate between $16.00 & $16.65 – retesting support and resistance levels before the breakout new high on April 11. Our longer-term analysis, which we’ll illustrate in the last chart of this series, was clearly showing us this recent price rotation was the setup of a Wave 3 price advance and we just needed to be prepared for it.
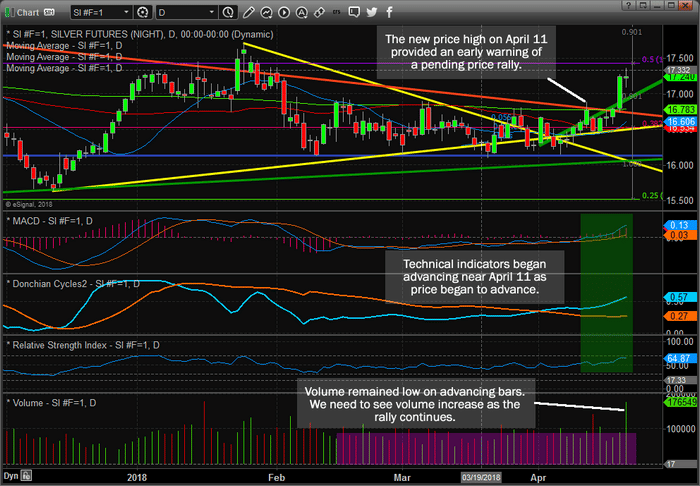
This, more detailed technical chart below, illustrates the April 11 new price high breakout as well as the rotation of the primary technical indicators near this April 11th date. Even though we didn’t have any clear closing price advance above technical resistance (near $16.80), we began to see upside pressure building that convinced us the time for the breakout was nearing.
Another key factor to keep in mind is that we had yet to see any real price advance with higher volume – a key element of any sustained price advance. Even as of today, we are seeing the first larger volume day with a moderate price advance. We do not consider this “technical confirmation of any sustained upside move” yet and we are still waiting for a high volume day with an accelerated upside price advance.
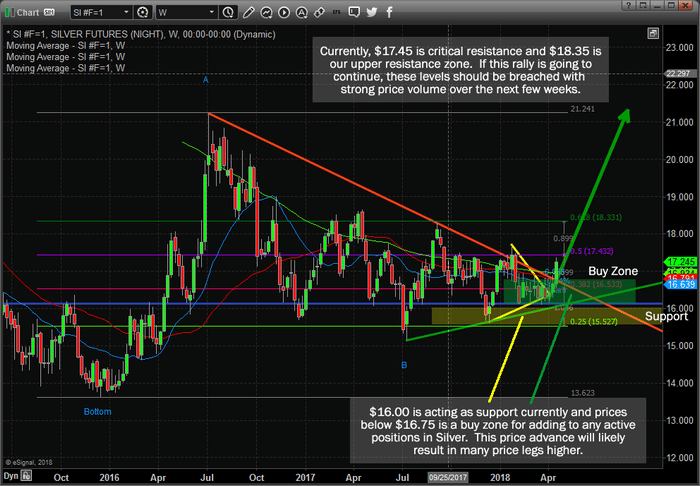
This, final, Weekly Silver chart below shows a clearer picture of what we are expecting to play out over the next few weeks and months. The $17.20 closing price on April 18th was technically a “confirmed price breakout” and established a new bullish trend in Silver. Right now, $17.45 is critical resistance and any closing price advance above this level will confirm an advance to near $18.35 (which will likely be very quick). $18.35 is the current upper resistance zone that price MUST breach in order to advance higher.
All this analysis is based on Fibonacci price rotation theory which indicates that price will always attempt to establish new higher highs or lower lows. Thus, given the new bullish price trend, these upper resistance zones become targets for the future price advance in Silver.
We would like to add that any price rotation where price drops near $16.75 or lower, yet stays above $16.00, should be considered a “Buy Zone”. This range is currently acting as price support and any retest of this range will likely result in a solid “buy entry opportunity”. $16.00 is currently our hard support level, think of it like the water level in the pool. This means any price rotation below $16.00 would cause us to become much more cautious of any future price rally. The ultimate recent low, near $15.65 would have to be breached before we would consider this new bullish trend ENDED or OVER.
Assuming we get additional higher volume price advanced in the near future and the upper resistance targets are hit and breached, our immediate upside objective is $21.25 and further upside targets can be identified as we do more detailed research. The upside potential of this Silver trade is immense and could last many months or well into 2019 or longer.
If you want to know what we are telling our members about this silver trade, then please consider joining Wealth Building Newsletter for more detailed Daily videos and analysis. You won’t want to miss this move in the metals, folks. We’ve been calling ETF trades for months with incredible accuracy.
We know most of you who follow our analysis know we’ve been calling these markets almost perfectly since well before the start of 2018. Visit our website to read more of our recent research reports and to learn how we can assist you in staying well ahead of these market moves. Our most recent trade for our members pulled +17.7% in just a few days. We can’t stress the importance of having quality research partners to assist you in knowing what to expect in the markets and having a team of traders to assist you in finding great trades. We can help you find greater success and stay our of trouble in the markets.
https://thegoldandoilguy.com/wp-content/uploads/2018/04/Chart_18-04-19_SI_D_Tech.png486700adminhttp://www.thegoldandoilguy.com/wp-content/uploads/2014/11/tgaoglogo.pngadmin2018-04-19 23:06:432018-04-19 23:06:43The Incredible Silver Trade – what you need to know


 We’ll close our this research with a YM Weekly chart to more clearly illustrate what the ADL price modeling system is suggesting for the extended future. Remember, these ADL predicted price targets go all the way forward to the end of July, 2018 – nearly 3 months into the future. Yes, we can attempt to see well into the future with the ADL price modeling system and as long as we continue to refresh our analysis for newer, more recent ADL events, we should be able to accurately map out the future of almost any market.