
Archive for year: 2017
One of the most pressing and urgent questions in most investors minds is “how and when will this move end?”. Many analysts and researchers have postulated the end of this move and we’ve event attempted to time it to some degree. Picking tops and bottoms is always a risky process. It is rarely an exact science and often leaves many variables unanswered.
Today’s ActivetradingPartners.com article is based on the “Wonderland” concept of debt driven US Fed and Central Bank policies as well as recent news items. The biggest being that China shocked the world with slower growth recently and that GE’s earnings announcement opened up a “shadow accountability” issues with many. Additionally, recent news has mentioned that the US markets are outperforming nearly all other markets by multiple metrics.
A few months back, we discussed Capital as being a living and breathing entity that continually sources the best environments for growth and opportunity (ROI). We strongly believe the US market, in addition to a few others like Canada and Australia, may have been a euphoric, central bank fueled, goofy and hallucinogenic world of debt driven capital advancement over the past 8+ years. The concerted efforts to “save the world” from capital contagion has allowed central banks and governments to inject nearly $20+ Trillion USD into the global markets and has resulted in asset growth metrics that far exceed anything we have ever seen in the most recent 60+ years. Is this a wonderland of limitless central bank debt and an endless bull-run where consumers will continue to gobble up anything and everything at any price?
Evidence of this Wonderland can be found from many sources. This, the CAPE/VIX Ratio chart, clearly shows the extended levels of asset valuations in relation to previous bubble economies. The expansion of this ration from the 2009 lows is massive.

Additionally, this expansion correlates directly with the US Fed’s QE and easing activities. We can see that a majority of this move has been backed by Fed policies to drive economic and asset valuation levels higher resulting in what could possibly be one of the biggest bubble economies ever created.

The most interesting component of this last chart is the move higher after the US Elections. This move was made without a Fed based QE effort and we believe it was the optimism of a “change” that created this economic “relief rally”. By comparing this recent move to the previous chart, you will see the increase in the CAPE/VIX Ratio also shot higher after the US elections.
In other words, we don’t expect anything massive to disrupt this rally currently, but we are cautious and urge all investors to remain cautious. When something massive, be it the consumers, corporations, global economic events or other massive events (like war) happen, all bets are off. This market appears to be in a EUPHORIC “wonderland” moment driven by the fact that the global central banks have created a waterfall event of cheap money that is driving all of this asset valuation recovery. And, as capital is continually searching for the best environment for ROI, it is consolidating into the best areas of the global economy for survival purposes.

What does this mean for investors and global markets? In our opinion, it means that optimism is outpacing actual production on a global basis and when reality hits, we may be in for a bumpy ride. Until then, we should continue to be very cautiously bullish and try to ride this out as long as it continues. We can’t stand in front of a freight train and expect to stop it. This move may continue for another few weeks or months, but at some point it will “pop” when realty does not match expectations – hence the “Wonderland” reference.
Lastly, this graph of the CPI Mean Rate shows that the entire economic recovery has, for the length of the recovery, failed to result in mean CPI levels reaching above 2%. In previous economic advancements, the mean CPI levels have continued to rotate to levels above 2% while recessions have shown dramatic and extended drops in the CPI ratio. Yet, the current recovery, briefly, rose above 2% after bottoming and has rotated below 2% for the last 6+ years. Even though global Central Banks and the US Fed has injected trillions of dollars of capital in an attempt to create inflation, the markets are simply not responding. The only things that are responding to this effort is the creation of debt (student loans, auto loans, residential and commercial RE loans and corporate financing debt). The actual consumer economy has been on life support for nearly 8+ years.

The Wonderland economy we are witnessing may be the biggest shell game since the South Sea Company collapse near 1720. I would suggest all investors do a little research into this event and the processes that were in place to all it to happen (bribery, collusion, criminal activities and governmental cooperation). Interesting facts in history are often relived at some points in the future.
In short, as long as the capital continues to flow into the strongest and most dynamic economies, those economies will likely continue to see growth and rallies related to this capital activity. Still, stay cautious because when the markets turn, it could be very quick and violent. Additionally, as we’ve shown with these charts and graphs today, we are entering a frothy period in the markets and I would urge all investors to be critically aware of the risks involved in being blind to these facets of the current bubble.
ActiveTradingPartners.com is dedicated to assisting traders in understanding and profiting from market moves. We provide detailed trading signals, timely and accurate market research, daily market updates and more. We focus on attempting to keep our members aware of key market events and attempting to identify accurate and successful trading signals for them each week and month. If you like this type of research, then visit www.ActiveTradingPartners.com to learn how you can benefit from our services.
Chris Vermeulen
SUBSCRIBE NOW AND PROFIT – CLICK HERE
It has been proven repeatedly by various market experts that stock market cycles exist. Whether you believe in them or not that is up to you, but as a technical trader myself I see price action repeat on virtually all time frames from the intraday charts, to daily, weekly, monthly, quarterly, yearly, and beyond.
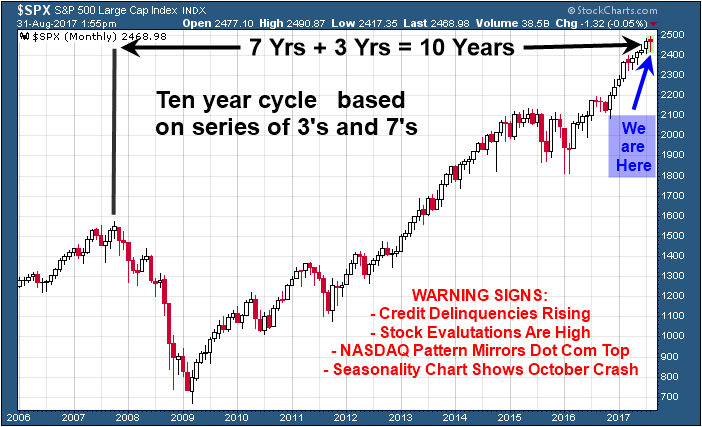
In fact, cycles tend to move in series of 3’s, 7’s and 10’s, and multiples of these as well. So, 3 bars, 7 bars, 10 bars no matter the time frame, though I find the 10min, daily, weekly, and monthly charts work best.
Knowing these cycles lengths, let’s review briefly where the markets are situated in terms of a seasonality, volatility, and the 3, 7 and 10 cycle periods. What I am about to show you is very intriguing.
I will let the charts do all the talking as they show the picture clearly.
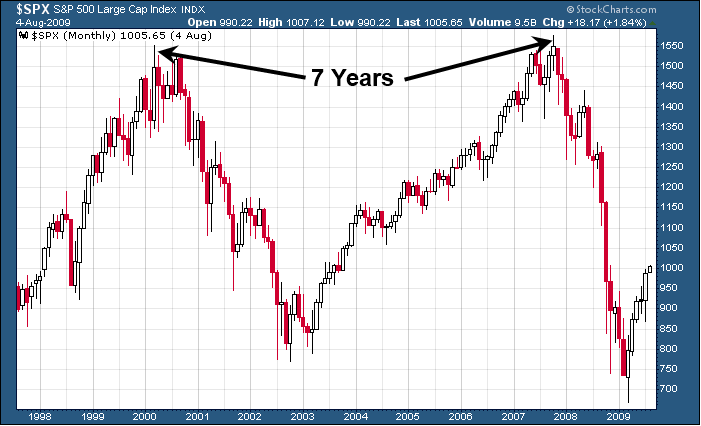
Example of Last 7 Year Stock Market Cycle
Potential 10 Year Cycle Top Forming
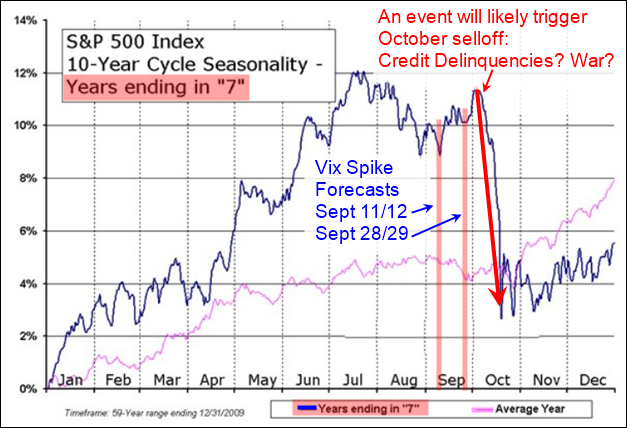
Seasonality of Monthly Price Action for Years Ending in 7
Concluding Thoughts:
In short, this is just a quick snap shot of some angles in which I look at the stock market. There are a lot different things happening (cycles, technical analysis patterns, and fundamentals) which have been painting a bearish picture for the stock market.
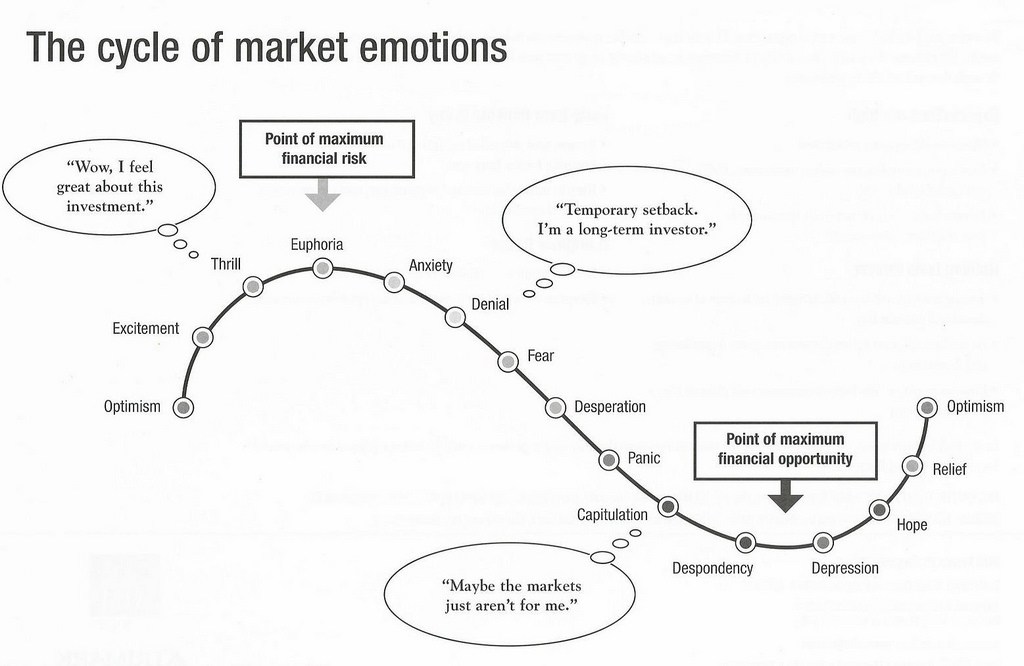
In fact, last year the US equities market were only a couple down days way from trigging a full-blown bear market. But Trump was elected and that triggered a massive rally which I see as being a final exhaustion move (euphoria) just before a major market top.
I have been watching and waiting for what I feel will be the next major market top for just over a year now. Why? Because once a market top looks to be in place we must adjust all our long-term portfolio holdings into different asset classes with CASH being a huge portion of it.
Stock prices typically fall 7 times faster than they rise so just imagine being properly positioned for a bear market with a portion of your position knowing you could make 7 years of slow painful growth in only 8-12 months when the bear market starts. I recently did a seminar talking about his and how one can use inverse ETF’s and short selling to profit from the next financial down turn which will eventually happen.
If you want to stay in the loop and be positioned for this massive move over the next two years Bear Market, then back into a Bull Market be sure to join my 2 Year Trading & Investing newsletter plan at http://www.thegoldandoilguy.com/etf-trading-newsletter/
Chris Vermeulen
Our recent analysis suggests we may be setting up to repeat history in an odd and dangerous manner. As market technicians, part of our job is to work with numbers, find patterns and attempt to predict future price moves in US and Global markets. As you can imagine, it is not always easy to accurately predict the future. Still, we take on the challenge and truly enjoy being able to find and share trading strategy concepts with our ActiveTradingPartners newsletter. As such, we are sharing this recent technical research data with your today.
Recently, the ActiveTradingPartners research team identified a unique pattern in the VIX that allowed us to accurately predict the June 29 VIX Spike nearly 3 weeks in advance. Also, on July 30th, we predicted a big decline in the NASDAQ during August. It also allowed us to know that VIX Spikes were possible on other future dates – such as the most recent date near August 4th. Even though the current VIX Spike did not hit exactly on the August 4th cycle date, the actual VIX Spike move happened only two trading days after our predicted date and the VIX has rallied over 90% from recent lows. Sometimes, analysis like this allows us to know months in advance that a cycle or critical event may have a higher probability of happening. This allows us to plan and profit from our research.
Today’s research correlates to the recent price moves in the XCI index (Computer Technology), NASDAQ and US Majors. The premise of this research is that the past 4+ years have resulted in a global investment in Technology firms as a result of lower ROI in most other sectors. This focus on technology investing is uniquely similar to the XCI Index DOT COM rally from the late 1990s and early 2000s. We are attempting to verify our presumptions and analysis by using core technical analysis techniques as well as fundamental price analysis.
We’ll start by looking at the price activity leading up to the 2000 DOT COM bubble burst. Initially, our analysis focused on the similarities in price action setting up this price move. The Accumulation, Exuberation/Pause, Hype and eventual CRASH phase. In 1995, the Accumulation phase initiated after a nearly 95% rally from 13+ months earlier (1994 – 462 days total). Currently, the Accumulation phase initiated after a 100%+ rally from 13+ months earlier (2009 – 427 days total). Subsequently, the Accumulation phase lasted 1057 days resulting in a 238%+ advance in 1998. The current Accumulation phase lasted 1456 days resulting in a 77%+ advance in 2014. Interestingly, the 1998 advance totaled 472.50 pts while the 2014 advance totaled 594.00 pts – resulting in a 125% advance size increase.
The Exuberation/Pause phase in 1999 lasted 252 days and resulted in a 207.19 pt move (+31.51%). The Exuberation/Payse phase in 2016 lasted 889 days and resulted in a 288.26 pt move (+21.15%). The more recent phase took 3.5x longer (time) to result in 139% greater price advance (which was actually a reduced percentage move of only 67% of the 1999 advance.
I advanced the term WEEKS where is should have been days.
Many analysts may be quietly stating, “all of this can be attributed to relationships of percentage values vs higher price valuations”, which is of course true. Our attempt at dissecting these moves is to try to understand the propensity and strength of any future moves.
Lastly, the HYPE phase lasted 39 weeks in 2000 ending with an advance of 895.23 pts (+97.94%) from the PAUSE/FLAG breakout in 1999. The current HYPE phase lasted 53 weeks ending with an advance of 674.54 pts (+40.26%) from the PAUSE/FLAG breakout in 2016. The resulting current HYPE price advance is 25% lesser than the 2000 move and results in a nearly 60% decrease related to the total percent swings.
2000 DOT COM – XCI Index Chart

2017 DOT COM – XCI Index Chart

The 2000 total phase advance lasted 220 weeks and resulted in a price advance of +1607.53 pts (+802.39%). The 2017 total phase advance lasted 436 weeks and resulted in a price advance of +1878.21 (+402.97%). The percent values of each move represent vastly different results, yet the total price moves differ by only 17%. We are certain some of these values and percentage representations are sparking interest in some of you as you may understand Fibonacci, Gann and other price analysis techniques.
The key to understanding these similarities is to understand the price sometimes moves in similar, not exact, setups and that we should never discount the possibility that markets are setting up for another massive move. Considering these price and relationship values, it is our perception that any global event, liquidity collapse or massive terrorist event could present a scenario that may result in a repeat of the 2000 DOT COM market collapse. Our premise is that the US has been an investment safe harbor for many and that Technology (FANGs and others) have benefited greatly from the global market weakness over the past 7+ years. It is our opinion that the capital that has been allocated into these global technology giants has, as in the past, setup a potential for history to repeat itself (given the right type of events/circumstances).
COMBINED DOT COM – XCI Index Charts

Our recent VIX Spike analysis shows we should expect future VIX Spikes on Aug 23rd, Sept 11th or 12th and finally Sept 28th or 29th. Assuming the relationship between the current price setup and the past setup is relative to the types of relationships we’ve studied so far, we can predict the following :
The initial swing low after the ultimate high (2000) resulted in a 572.02 pt move (a 31.62% correction over 10 weeks). Any current correction could result in an 8~15.5% price correction over 7~15 weeks. This would put our estimates of a price low near 2152~1980 on or near Sept 25th or Oct 23rd. This price low would be followed by 4~12 weeks of price advance setting up a right shoulder near 2150~2256 (possibly). Following that, we would see the low price rotation broken by extreme selling pressure and ultimate low target near 770~581 (resulting in a 63~69% correction from the highs).
Do we know this WILL happen? NO. Can we estimate the probability of it happening as we predicted? NO. How can we tell if this will play out as we are predicting? If the market continues to break down and begins to form the right shoulder, then we would consider, at least this first phase, to be technically accurate. If it fails to move lower to establish this move, then we would consider this a technical breach of our research and attempt to reevaluate our theories.
Thus, what we can do at this point is alert you to the potential that a massive Head-n-Shoulders formation may be setting up in the global/US markets related to a potential Tech Bubble. The proof will come with confirmation of our analysis or the failure of our analysis as price plays out over the next few weeks.
Still, the correlation of the VIX SPIKE dates, Aug 23rd, Sept 11th or 12th and finally Sept 28th or 29th, are interesting because our initial analysis of any price low indicates a potential low price date range near September 25th. Should this become true, an 8~15% correction in the XCI would clearly result in a 4~9%+ correction in the NQ and would correlate with our VIX Spike analysis almost perfectly.
The only thing we can do is be aware of these relationships and price patterns that are setting up and plan our trades properly. Every trade includes risk, attempting to manage that risk is the objective of most traders. At this point, Aug 23rd, Sept 11th or 12th and finally Sept 28th or 29th are critical dates to keep in mind as the future plays out before us. Watching for these moves and being aware that they could be setting up for a massive price swing lower are important factors to consider and being able to protect open LONG positions would not be a bad idea over the next few months.
The only way one can tell if predictions of the future are going to be accurate or not is to wait for the future to get here and see how well these predictions worked out. So, we wait with the understanding that we are watching for confirmation or failure of our analysis with each week.
If you like our research and analysis and want to learn more about our forecasting and trade alert services, to see what we can offer you. We provide daily market updates, clear and concise trading triggers/signals, advanced research and analysis of the US and global markets and more.
Chris Vermeulen
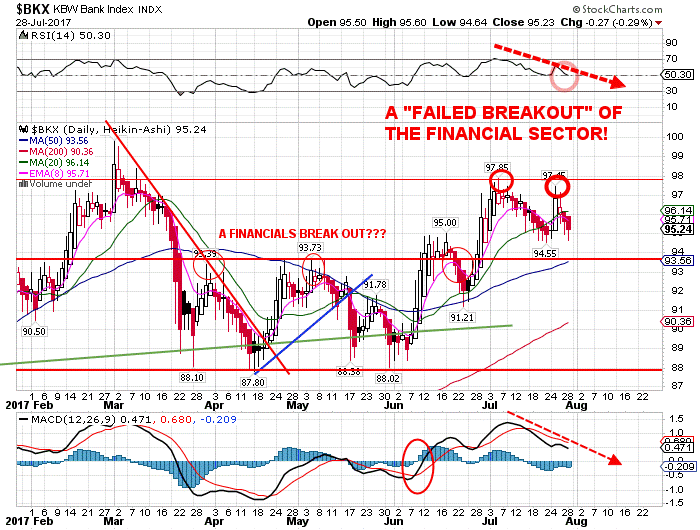
The loss, of the leadership of the banking and financial sector, BKX ETF, is now a major warning signal which is what is required in order to move the SPX much HIGHER, at this time!
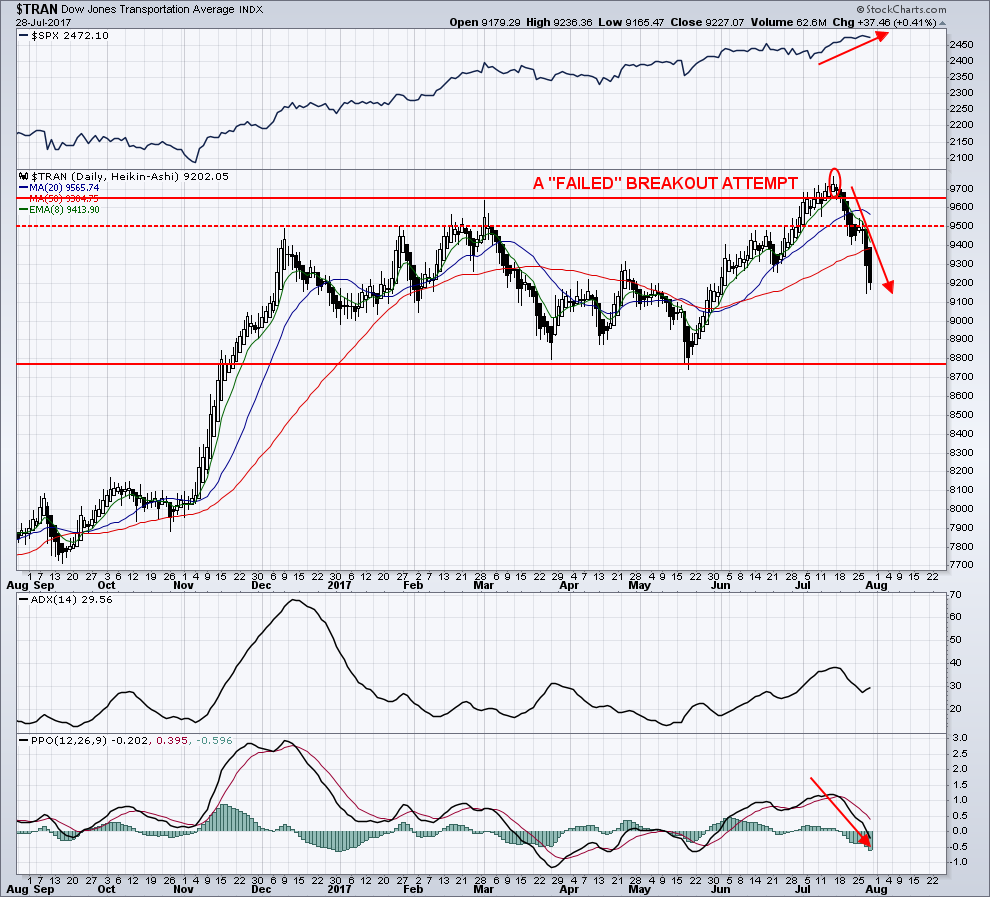
The divergence which is currently being seen between the Dow Industrials and Dow Transportation indexes will be coming into play in the upcoming weeks.
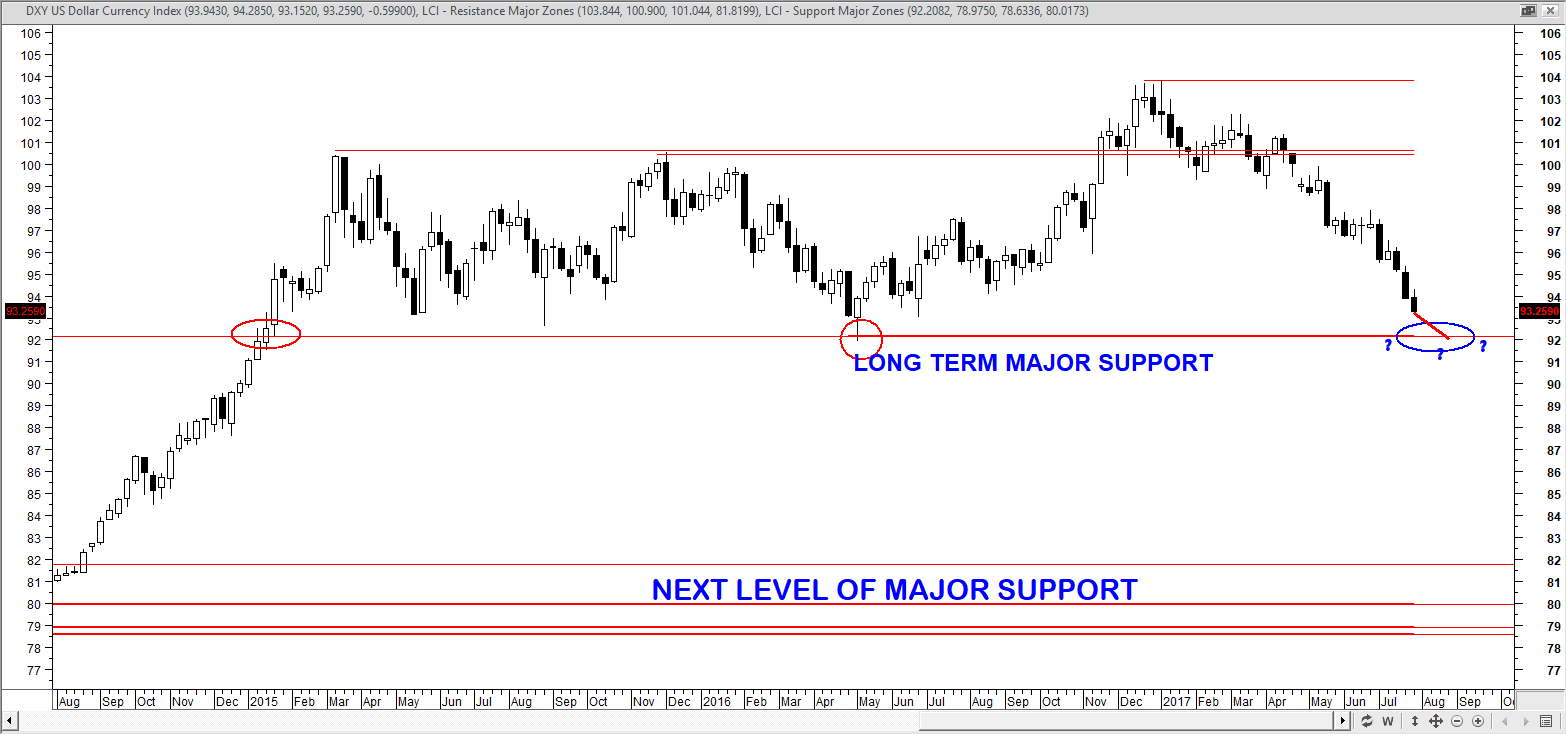
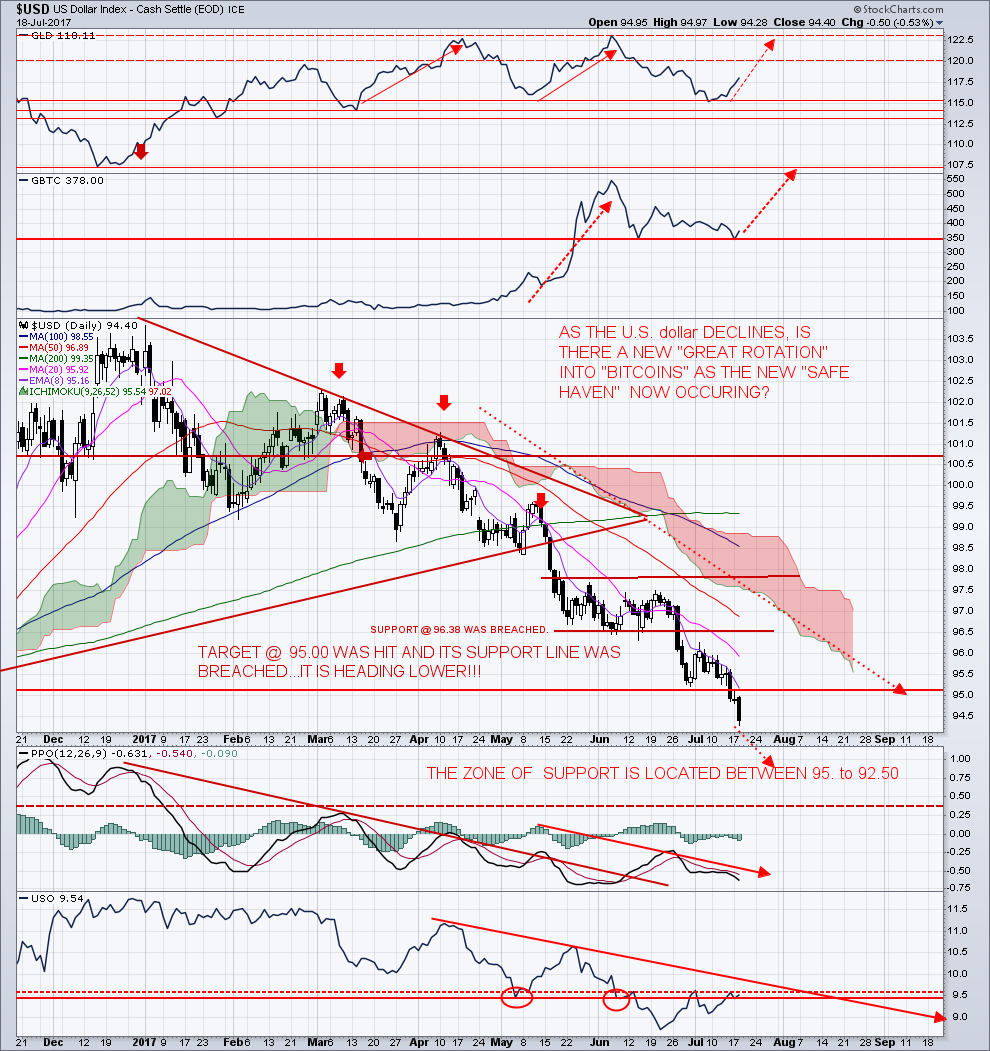
The U.S. dollar has declined to a 52-week low. When stocks have been at a high and the dollar at a low, historically, the SPX showed a positive return within six months to one year, almost without exception. I see support in the 92.50 area.
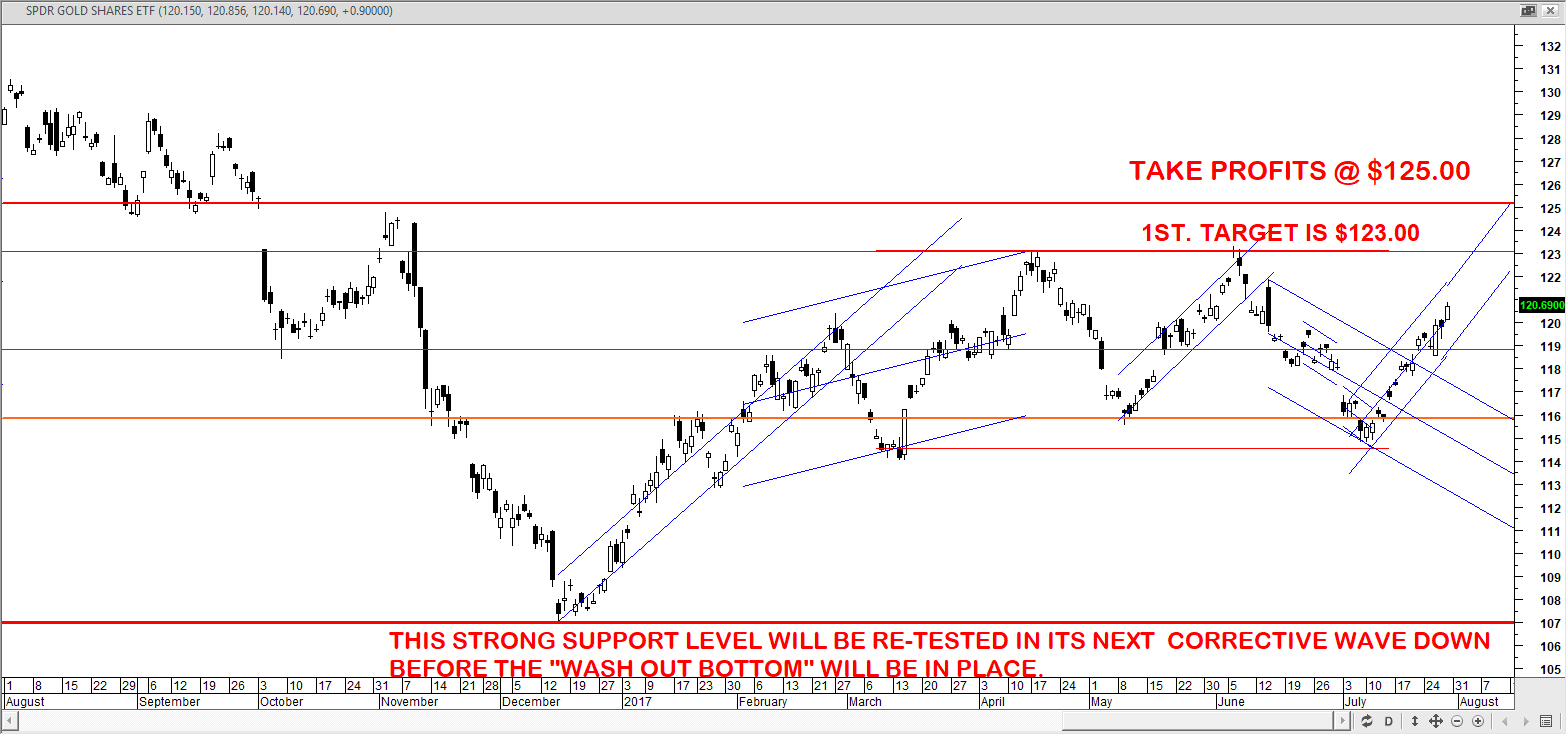
I would expect to see a very quick “oversold” bounce in GLD, then a correction to the 105 to 107 areas as the final “washout bottom” is put into place.
My approach to the markets is to be flexible enough to handle the possibilities of much stronger and weaker sustained trends than what we have seen in our investment lifetimes.
Our portfolio has outperformed the SPY by over 114% this year. Quite a feat when you consider the SPY is up nearly 9% this year and has almost gone straight up since January 2017.
We like to ask our clients and viewers this question, “isn’t it time you invested in your future?”. We would really like to help you achieve greater success and find greater opportunities in the markets, but you have to subscribe for this to happen.
Conclusion:
In short, active traders should be defensive over the next few days as we could have one more bout of selling in stocks and a spike in the vix. I feel the best plays right now will be short metals, short oil, long dollar.
Stay tuned for more updates, and be sure to join our stock picks newsletter, or our ETF trading newsletter for real-time trading signals.
Technically speaking, this week could be very important for the major U.S. equity markets. There is an appearance of a “TOPPING PATTERN” forming. I am now awaiting confirmation by the actions of the equity markets, this week. Expect downward pressure beginning this month of August of 2017.
The Only Chart You Need To See!
There is currently limited upside potential in the SPX relative to potential downside for the months of August, September and the early part of October 2017. There are signs for the short, intermediate and longer-term trends returning for the best six months of trading officially inaugurated in November of 2017! This is the timing framework when ‘The Next Runaway Leg Up In The Stock Market Will Resume.’
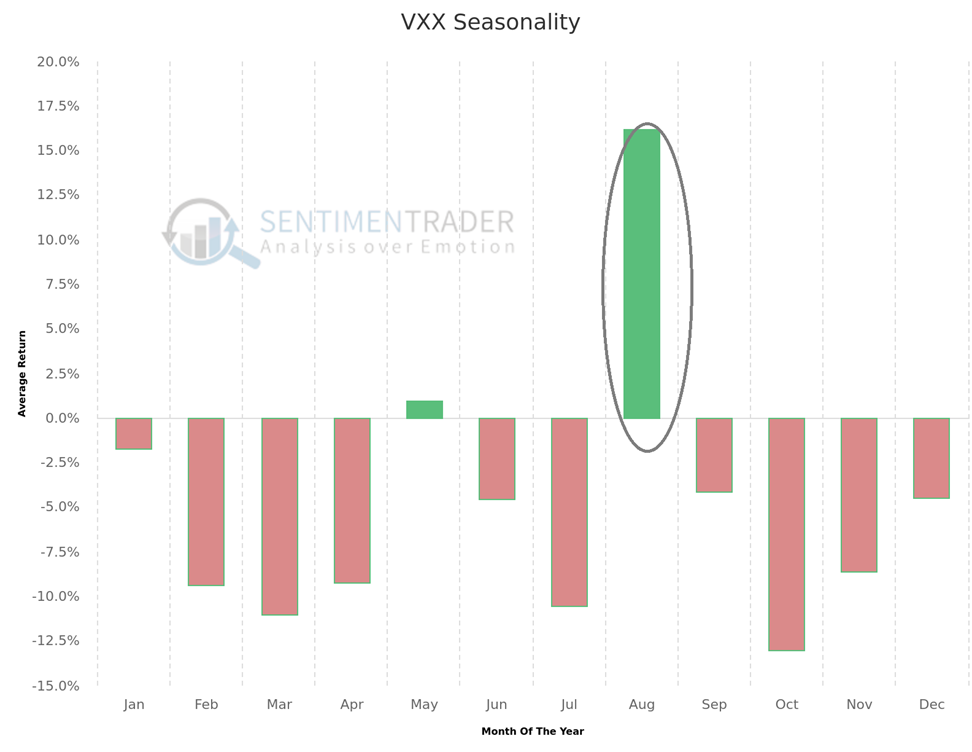
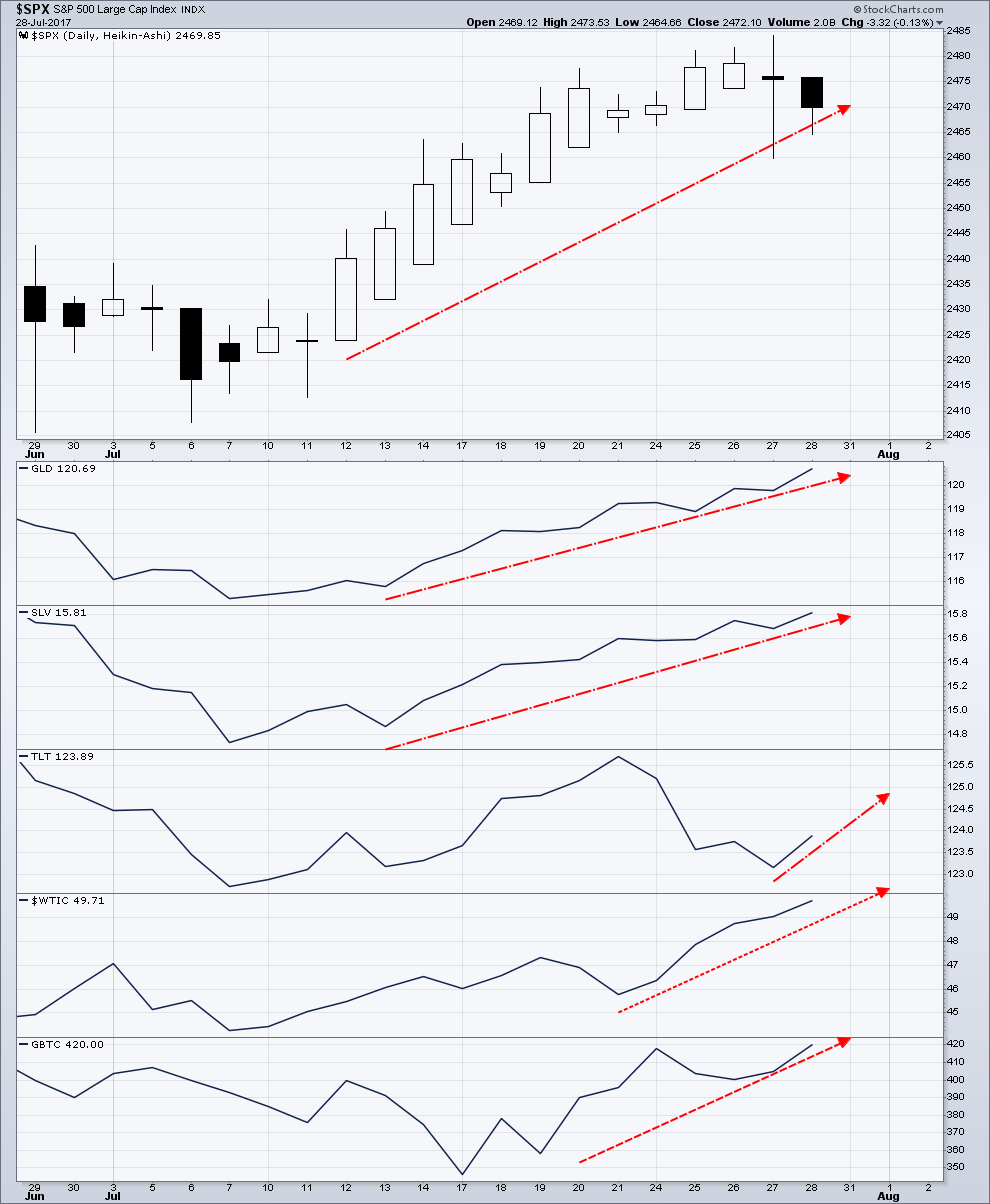
In last weeks’ market action as the profit taking rotation out of the high-tech sector rotated into the Dow Industrials, it reflected a more defensive approach while being invested in “Blue Chips” during which time it achieved a new high. Sector rotation increased especially noticeable in the transports and technology sectors that were leading the markets higher. If they continue lower, more sectors will join the decline. I am expecting a coming pop in the VIX on Aug 4, Aug 23, Sept 11 or 12 and finally Sept 28 or 29. 2017. There was a flight to safety in the Yen as well as a strengthening of the price of Gold, Silver, Bitcoin and WTI Crude Oil.
People are starting to park their money in digital currencies, like Bitcoin and Ethereum, rather than parking them in fiat currencies – I buy and hold my currencies in this crypto wallet CoinBase.
An Unusual Anomaly:
Over the past couple of weeks, there was this unusual Anomaly which occurred, as you can see in the chart below. It now makes me more cautious about our long understanding of “risk inter-connectivity”.
How can the equity, gold, silver, crude oil and bitcoin markets ALL go HIGHER together?
Tune in every morning for my video analysis and market forecasts at TheGoldAndOilGuy.com to now where the main ‘asset classes’ are headed tomorrow, this week, and next month.
In short, the major equities trend remains to the upside but its likely to take shape in a slow grinding process with downward pressure starting in August fora couple months.
Be sure to follow my daily pre-market video forecasts and ETF trades at www.TheGoldAndOilGuy.com
Chris Vermeulen
The dollar has been taken beating on ‘false promises’ of any major fiscal reform from the Trump administration.
On July 18th, 2017, President Trump lacked the support of the U.S. Senate to pass any new measures on healthcare bill, in the U.S. At least, three Republicans along with the Democrat lawmakers have expressed opposition for any changes to the current “Obamacare”.
All investors have their doubts that the Trump Administration might not be able to implement tax reform. This was the key component of their infrastructure spending proposals which should have been implemented within this year or early 2018.
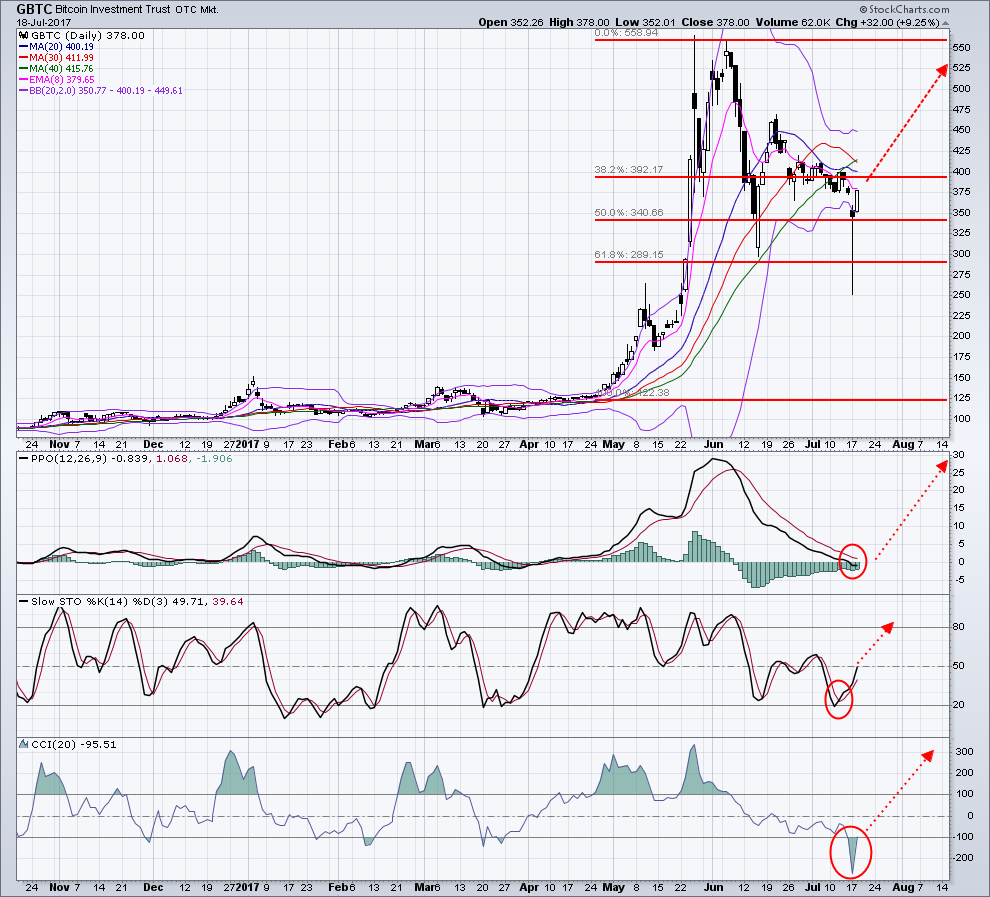
Bitcoin prices has been able to benefit from the “return in risk aversion” in the markets on fresh catalysts. Bitcoin prices, http://www.marketwatch.com/story/cybersecurity-legend-bets-his-manhood-that-bitcoin-reaches-500000-mark-with-three-years-2017-07-18?mod=MW_story_top_stories, plunged more than 25% over the last weekend of July 17th, 2017. Bitcoin, lost $10 billion, in market cap due to the crash. On Monday morning, July 17th, 2017, the markets recovered 30-40%. There is grave concern about the potential transition on the Bitcoin block chain platform. On August 1st, 2017, Bitcoin improvement, proposal, 148 (BIP148), is intended to allow the Bitcoin network to scale more efficiently is scheduled to be activated. The majority of developers do not agree on this new proposal. Currently, 43% of bitcoin’s mining power is seeking a new paradigm!
It is possible that Bitcoin could split into two or more separate cryptocurrencies. Miners are reporting progress in solving ‘hard fork issues’ which is shoring up confidence in the industry, in total.
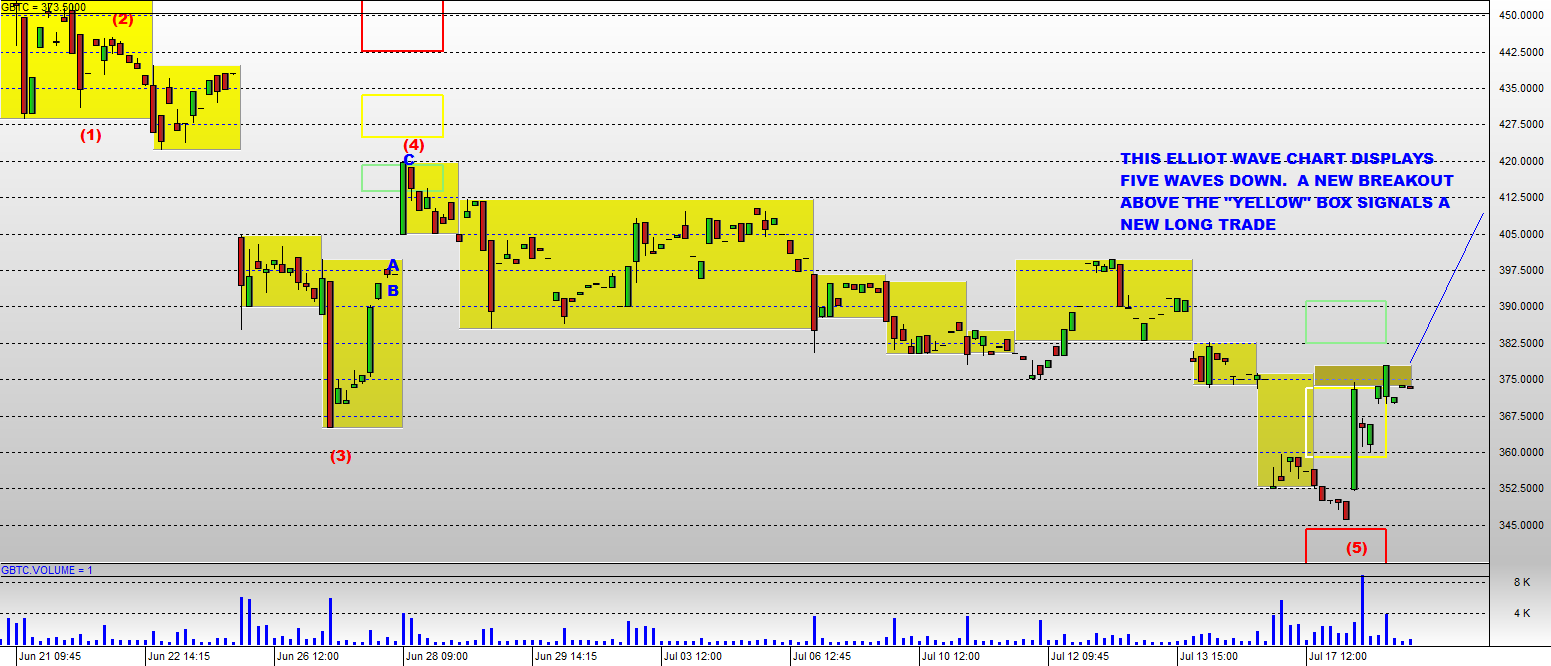
The Bitcoin Investment Trust Fund, GBTC is the instrument that is very active and tradable. I have put together three charts showing that it is currently at Fibonacci retracement level at 50% reflecting its’ next potential support area.
I has been involved in the cryptocurrency area since the very beginning and will now start covering new trade setups similar to last years long-term buy signal in Bitcoin I shared last July which, bit coin rallied over 350% since then. There is a great deal of BUZZ now emerging on Main Street and I will make you money in this ‘new asset class’ as well as keeping you regularly informed.
People are starting to park their money in digital currencies, like Bitcoin and Ethereum, rather than parking them in fiat currencies – I buy and hold my currencies in this crypto wallet CoinBase.
Know where the markets are headed and trade my signals at www.TheGoldAndOilGuy.com
Chris Vermeulen