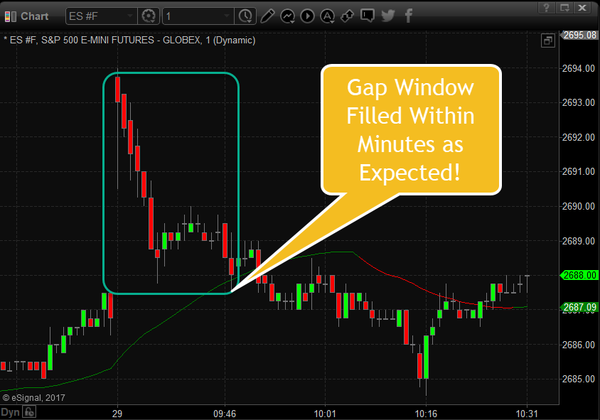
See chart below for a visual of the gap fill we expected to take place this morning based on price analysis and intraday cycles. Keep in mind, a 6 point move may not seem like much, but if you are a futures traders as I am 6 points is $300 profit per contract in 18 minutes…
Remember nearly 100% gap windows get filled within a couple days… these are steady income trades…
If you want to know what the market are going to do today, this week, and next month be sure to subscribe to our new and improved market trend forecast and trading newsletter: http://www.thetechnicaltraders.com/
https://thegoldandoilguy.com/wp-content/uploads/2017/12/quick-gap.png591844adminhttp://www.thegoldandoilguy.com/wp-content/uploads/2014/11/tgaoglogo.pngadmin2017-12-29 11:30:012017-12-29 11:30:01Another $300+ Gap Fill In 18 Minutes Today. Next…
As 2017 draws to a close, our analysis shows the first Quarter of 2018 should start off with a solid rally. Our researchers use our proprietary modeling and technical analysis systems to assist our members with detailed market analysis and timing triggers from expected intraday price action to a multi-month outlook. These tools help us to keep our members informed of market trends, reversals, and big moves. Today, we are going to share some of our predictive modelings with you to show you why we believe the first three months of 2018 should continue higher.
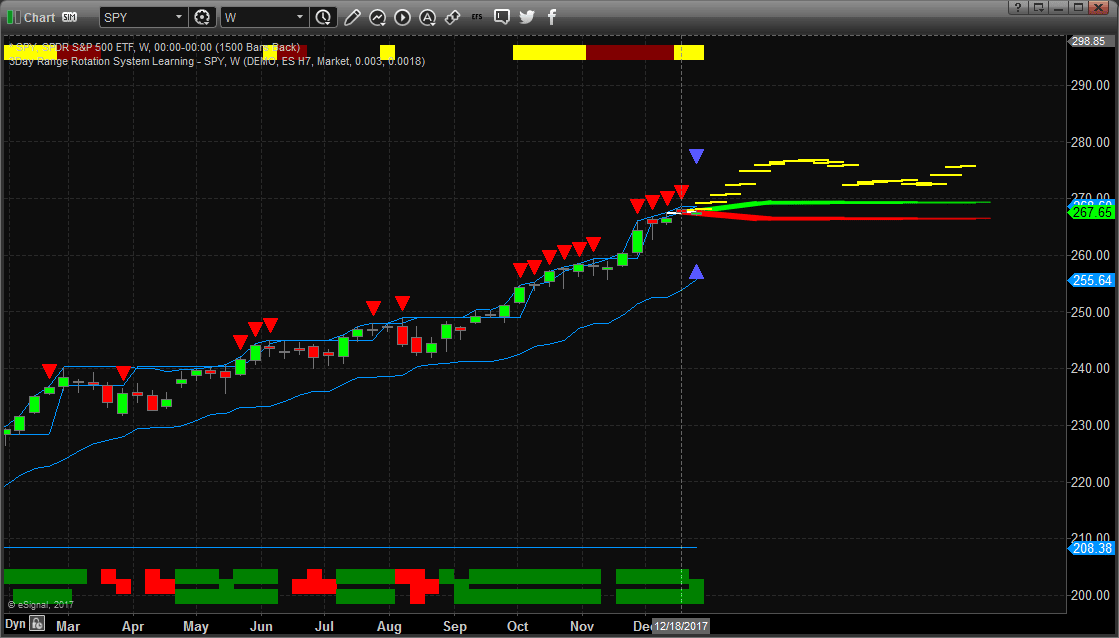
One of our most impressive and predictive modeling systems is the Adaptive Dynamic Learning system. This system allows us to ask the market what will be the highest possible outcome of recent trading activity projected into the future. It accomplishes this by identifying Genetic Price/Pattern markers in the past and recording them into a Genome Map of price activity and probable outcomes. This way, when we ask it to show us what it thinks will be the highest probable outcome for the future, it looks into this Genome Map, finds the closest relative Genetic Price/Pattern marker and then shows us what this Genome marker predicts as the more likely outcome.
This current Weekly chart of the SPY is showing us that the next few Weeks and Months of price activity should produce a minimum of a $5 – $7 rally. This means that we could see a continued 2~5% rally in US Equities early in 2018.
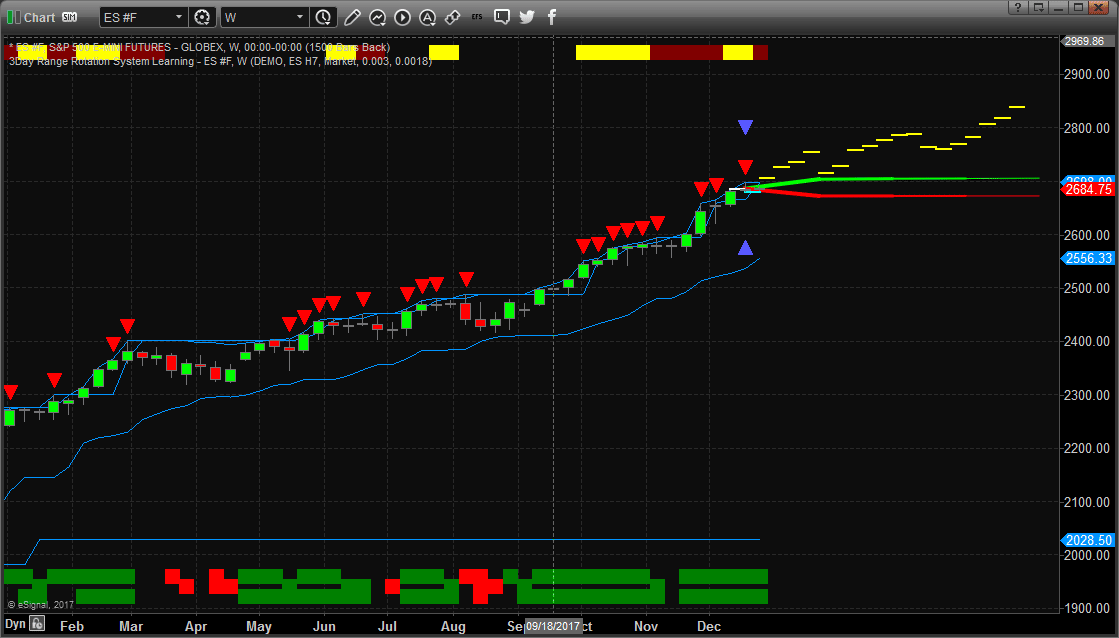
Additionally, the ES (S&P E-mini futures) is confirming this move in early 2018 with its own predictive analysis. The ADL modeling system is showing us that the ES is likely to move +100 pts from current levels before the end of the first Quarter 2018 equating to a +3.5% move (or higher). We can see from this analysis that a period of congestion or consolidation is expected near the end of January or early February 2018 – which would be a great entry opportunity.
The trends for both of these charts is strongly Bullish and the current ADL price predictions allow investors to understand the opportunities and expectations for the first three months of 2018. Imagine being able to know or understand that a predictive modeling system can assist you in making decisions regarding the next two to three months as well as assist you in planning and protecting your investments? How powerful would that technology be to you?
Our job at Technical Traders Ltd. is to assist our members in finding and executing profitable trades and to assist them in understanding market trends, reversals, and key movers. We offer a variety of analysis types within our service to support any level of a trader from novice to expert, and short-term to long-term investors.
Our specialized modeling systems allow us to provide one-of-a-kind research and details that are not available anywhere else. Our team of researchers and traders are dedicated to helping us all find great success with our trading.
So, now that you know what to expect from the SPY and ES for the next few months, do you want to know what is going to happen in Gold, Silver, Bonds, FANGs, the US Dollar, Bitcoin, and more? Joining www.TheTechnicalTraders.com to gain this insight and knowledge today.
Chris Vermeulen
https://thegoldandoilguy.com/wp-content/uploads/2017/12/Chart_17-12-28_SPY_W_ADL.png6381119adminhttp://www.thegoldandoilguy.com/wp-content/uploads/2014/11/tgaoglogo.pngadmin2017-12-28 20:16:592017-12-28 20:16:592018 First Quarter Technical Analysis Price Forecast
People are starting to park their money in digital currencies, like Bitcoin and Ethereum, rather than parking them in fiat currencies.
The institutional investors are recognizing this outcome, hence, they are the largest group of Bitcoin buyers.
If you are looking for an easy way to buy and sell bitcoin I use this simple crypto wallet called coin CoinBase. While Bitcoin is not now, it won’t be forever and I talk about it in this interview I recorded on Tuesday.
https://thegoldandoilguy.com/wp-content/uploads/2016/07/bitmoney.jpg16822500adminhttp://www.thegoldandoilguy.com/wp-content/uploads/2014/11/tgaoglogo.pngadmin2017-12-19 21:01:562017-12-19 21:11:30Sure, you’re into Bitcoin…but do you know how to get out?
Recently, we have been asked by a number of clients about the precious metals and what our advice would be with regards to buying, selling or holding physical or trading positions in the metals. There are really only a few short and simple answers to this question and they revolve around the concept of providing a hedge against risk, capital preservation and opportunity for returns. Let’s explore the details a bit further.
First, Gold, historically, has been and will continue to be the basis of physical wealth for the foreseeable future. Currently, Gold and Silver are relatively low cost compared to other assets offering similar protection. As of right now, Gold and Silver are nearing the lowest price ratio levels, historically, that have existed since 1990. This means, the relationship of the price ratio for Gold and Silver are comparatively low in relationship to how Gold and Silver are priced in peak levels. So, right now is the time to be acquiring Gold and Silver as a low price hedge against another global crisis event or market meltdown.
People are starting to park their money in digital currencies, like Bitcoin and Ethereum, rather than parking them in fiat currencies – I buy and hold my currencies in this crypto wallet CoinBase. This is primarily due to the Negative Interest Rate Policy as well as Zero Interest Rate Policy of the Central Banks, which explains the sharp rise in the price of Bitcoin, this year.
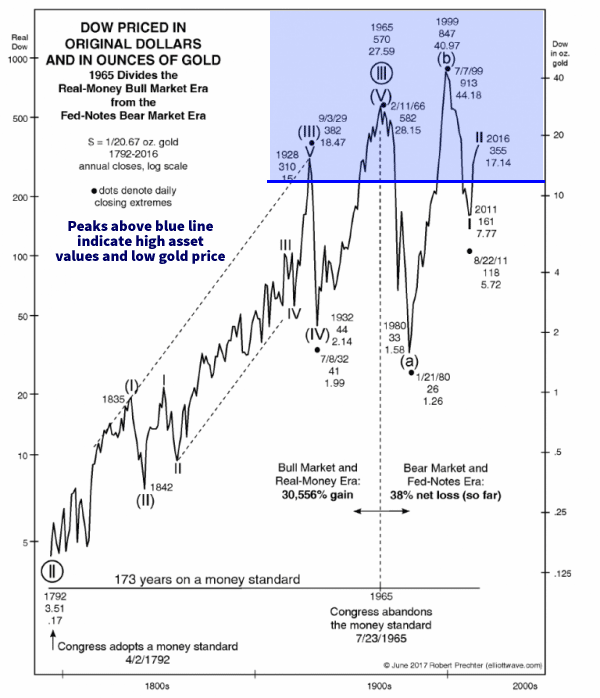
Taking a look at this chart of the DOW Index shown in relative Gold Ounce price levels, we can see that every peak in this ratio above 15 or so has resulted in a dramatic ratio level reversion (decline). This reversion means that asset prices (the DOW price level) declined while the price of Gold rose or stayed relatively stable. The current level is well above 17 and any peak in this level should start the next rally in precious metals while global equities contract.
Second, the fact that the Gold and Silver price ratio is historically very low (meaning they provide a very good hedging opportunity at historically very low price ratio levels) also means that cash can be traded for physical gold with very limited risk and provide an excellent hedge for inflation, global market crisis events and as long-term investments. Taking advantage of the current market conditions, one has to be aware that crisis events do exist and present a clear risk to future equity investments. One could decide to risk further capital hedging with options or short positions as risk becomes more evident, but these are inherently more risky than a physical Gold or Silver investment. Physical Gold or Silver, especially rare coins which include greater intrinsic value, can provide real capital, real gains, real hedging of risk and real return – whereas the short positions or options are only valuable if the trade is executed to profit.
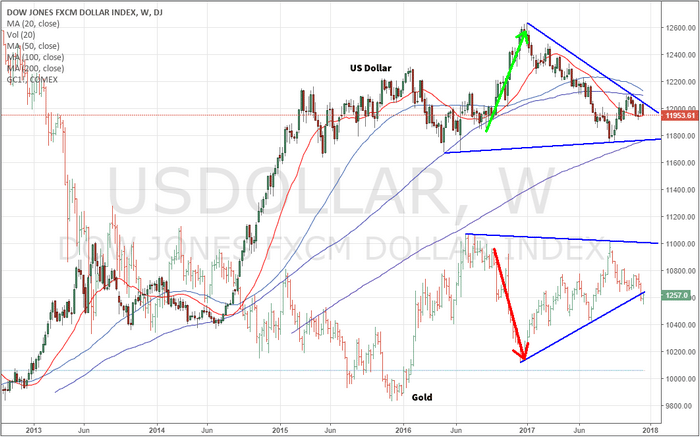
The relationship of the US Dollar to Gold is key to understanding precious metals valuations. As the US Dollar increases in value, this puts pressure on the price of Gold because most of the world operates in US Dollars and Gold is typically a hedge against risk and inflation. Therefore, as the US Dollar increases in value, there is a perceived view that risks and inflation are less of a threat to the global economy.
As this chart, below, shows, the US Dollar is currently settling within a FLAG formation that could result in downside price action – below recent support. When we consider the first chart, showing the price of Gold being historically very cheap and the ratio being above 17, we must assume that any downside price activity in Gold is a blessing right now because these levels have not been seen since 1999, 1965 or 1929. In other words, this is potentially a once-in-a-lifetime opportunity for investors.
Lastly, Gold and Silver are very limited in supply on this planet and, unless society decides that Gold or Silver is absolutely worthless as a substance, will likely continue to increase in value. News that China and Russia are acquiring hundreds of tons of gold each year in preparation for a gold-based currency is another set of reasons that you should consider starting your own physical hoard of precious metals. The most important thing for you to understand about owning physical Gold and Silver is that it is a protective investment that can be liquidated or resold at almost any time in the future. It can be traded, held, secured and transported easily. You can physically take possession of your Gold and Silver and be assured that through any banking crisis, global market crisis or major global event, you have enough physical precious metal to operate in a crisis mode and likely attain great wealth/gains in the process.
Think of physical Gold and Silver like an “emergency kit”. You hope you never need it, but when you do need it, you had better be prepared and have set aside some physical holdings before the crisis event happened. Out here in California, we keep “Earthquake Kits” with emergency supplies, water, lanterns, food and other essentials. Well, guess what is included in my Earthquake Kit? Yup – Gold and Silver in proper quantities that I could barter and trade for items that are essential.
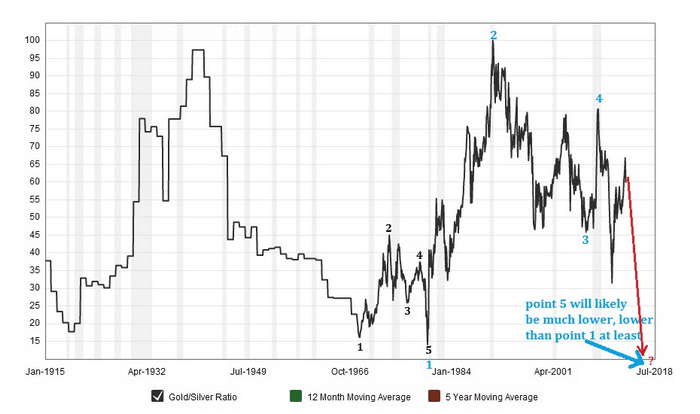
This final chart is the Gold to Silver ratio and is used to identify when price disparity between the two most common precious metals is opportunistic for one metal over the other. When the price of Gold is high compared to the price of Silver, this ratio will climb. When the price of Silver increases, because of perceived market risks, this ratio will decline. Currently, one can see that we are nearing a peak in this ratio chart – meaning that Silver is much cheaper, in relative terms, than gold. Because of this, investors should consider Silver and Gold as viable wealth protection.
Should another market crisis event unfold, both Silver and Gold will likely rally. This chart is telling us that Silver will likely rally by a larger percentage value than Gold to result in a decline in this ratio and resulting in closer “parity” between the valuations of these two precious metals. Again, currently, this is very close to a once-in-a-lifetime opportunity for investors.
The point of my post is that I can think of no reasons why anyone would not want to attain some physical Gold and Silver at today’s prices to protect against known risks, provide a hedge against inflation and crisis events and to protect wealth from what we all know will happen in a crisis event – the banks will close or limit cash availability (think of Greece). So, it is really up to you to determine if and how you want to prepare for what could happen in the future. Will you have your “emergency kit” and be prepared or not?
Now is the time to consider building your “emergency kit” and to prepare for the next market crisis event. Our research team is ready to assist you and to keep you updated with Daily and Weekly update for all the major markets.
Over the past many years, we have been highlighting one concept that many people fail to understand and utilize – the longer term Generational Cycle. This is important because of two reasons; first, it has been in place and accurate for over 400 years and, second, it identifies events, opportunities and Archetypes that we should be aware of. Are you ready to learn about these massive cycles and how they relate to the markets and how they create massive opportunities?
Where are we currently in this cycle process? What can we learn from the past and what can we do to prepare for the future?
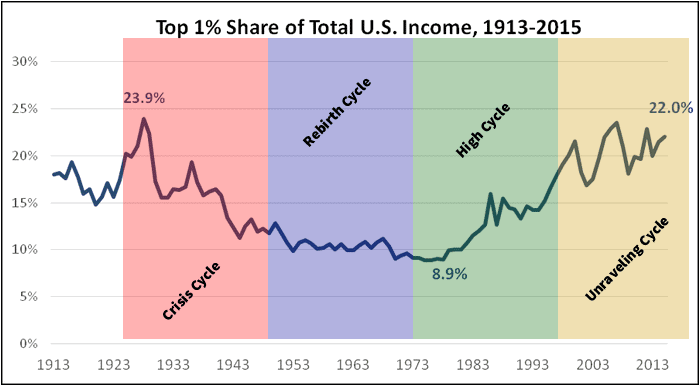
This chart below shows the share of total US income represented by the Top 1% of all earners. As you can see, current levels (as of 2015) are near 22% and are near the highest levels over the past 80+ years. When the Top 1% earn more than 16~17% of all income, there is a disparity in income opportunity across all levels of income and, as history has shown, an economic or social even may be eminent to restore some opportunity to the lower income levels.
The general principle of the Generational Cycle is that 50 to 85 years after a major social, economic or geopolitical event, society (meaning the general populous) has forgotten the lessons learned from that event and is somewhat destined to repeat it (in some form). The last massive social, economic and geopolitical event on record, which is also the last known “Crisis Cycle” was the 1926 to 1949 span that included the end of the Roaring 20s, the Great Depression, Pearl Harbor, World War II, A US Banking Crisis, Atomic Weapons, NATO created. This cycle event is known for the upheaval that is created by a destruction of fundamental pillars of society and economic success found within the previous 50+ years.
The next cycle event that follows the Crisis Cycle is the “Rebirthing Cycle”. Historically, this cycle executed from 1950 to 1972 and was a time where society pulled together from the previous cycle event, developed new foundations and developed opportunities from technology, infrastructure and strengths that were fostered from the Crisis Cycle. As you can probably imagine, the events of the Crisis Cycle had a lasting result for generations to come. The Rebirthing Cycle was a result of the chaos and uncertainty of the previous cycle and the people alive at the time were cautious and calculated in their planning.
The next cycle event is the High Cycle. Historically, this cycle executed from 1972 to 1995 and was a time of accelerated success, prosperity and excess. The High Cycle is when nearly every aspect of the Rebirthing Cycle is firing on all cylinders – the economy is good, housing is good, there is plenty of excess for everyone. Governments feel they can do no wrong and spending is through the roof.. What could go wrong – right? This cycle is like a perpetual high that creates wealth and prosperity while creating massive debt loads for some.
Then comes the Unraveling Cycle. By our estimates, we’ve just completed the Unraveling Cycle between 1996 to 2017~18. The Unraveling Cycle is when the structures, foundations and pillars that society built after the last Crisis Cycle begin to crumble. Financial systems start to collapse with debt (pensions, state and local governments, entitlements, global governments). Unique sectors of the global markets start to appear fragile, debt-laden and mismanaged. Remember, the previous cycle event, the High Cycle, was a period of time when everything was super, one could do not wrong and growth would continue forever…. but now, things seem different.. not so super.. and maybe not keep growing forever. I equate the Unraveling Cycle to your car’s engine starting to fall apart. As long as you keep gassing it (QE and bailouts) with Ether, you can probably keep it running for a while longer – but eventually it will completely die and require a complete rebuild or replacement.
So, now that you have been briefed regarding the massive Generational Cycles, how do you profit from these future events? That answer is simple, prepare yourself and your investments for the potential that we could be entering a time of great upheaval and repositioning. Find partners, like TheTechnicalTraders.com, that can assist you in identifying key market rotations, opportunities and help you stay out of trouble. Remember, just like in the 30s and 40s, the markets continue to move, there are still opportunities to invest and there are still opportunities to profit. One just has to be aware of where the opportunities will be presented and what to watch out for while navigating these tricky waters.
While we are watching the global markets for signs of weakness and further signs of any potential correction, we want you to understand that Technical Traders Ltd., and all of our resources, are here to assist you and help you navigate this once in a lifetime opportunity. We urge you to consider joining www.TheMarketTrendForecast.com or www.ActiveTradingPartners.com as two unique sources that will keep you aware of these cycle events, find opportunities for you and help you understand the markets, trends and provide detailed forecasts of future trends.
Remember, these cycle events are opportunities for you to prepare, plan and execute for success. IN many cases, these are once in a lifetime event that can provide nearly unlimited opportunities for success. Make sure you have the right partners to assist you in executing for profits.
https://thegoldandoilguy.com/wp-content/uploads/2017/12/CycleMarkers.png386700adminhttp://www.thegoldandoilguy.com/wp-content/uploads/2014/11/tgaoglogo.pngadmin2017-12-10 15:27:412017-12-10 15:27:41Could Generational Cycles Play A Major Role In Our Immediate Future?
https://thegoldandoilguy.com/wp-content/uploads/2015/05/cvinterview.png151210adminhttp://www.thegoldandoilguy.com/wp-content/uploads/2014/11/tgaoglogo.pngadmin2017-12-07 10:43:032017-12-07 10:43:03Big Bites Being Taken out of the FAANGS
In this post we want to share two interesting sets of data that we find are interesting and add to the case of a stock market top is highly likely to take place in 2018. Be sure to read Part I “How to Know When A Bull Market Is About to End”.
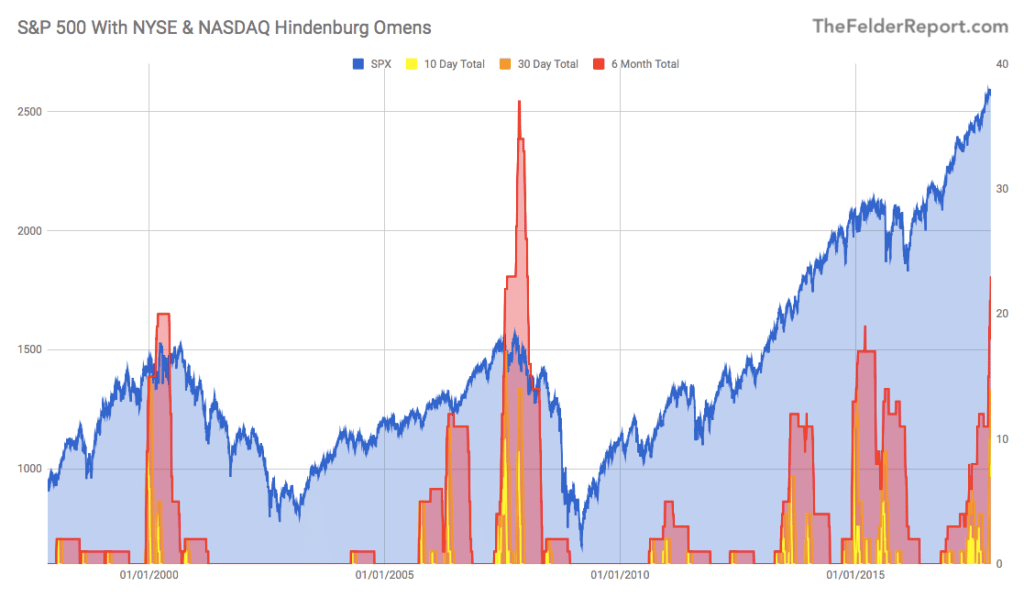
First, let’s take a look at the “Hindenburg Omen” which was developed by Jim Miekka as an early warning of a stock market correction. While it’s not super effective in terms of timing market turns it can be very useful in assessing the overall strength of an uptrend.
The current indicator shows a number of these omens triggered on both the NYSE and the NASDAQ. While the indexes and many of their components have been reaching new highs, an equally large number of components have been making new lows, as well. This suggests that the market is indecisive and probably at a turning point ( the hallmark of a major market peak). Of course, a similar scenario can occur during a falling market when new lows are numerous but new highs begin to rise rapidly. The latter condition would suggest that such market indecision could be an early buy signal in a falling market.
HINDENBURG OMENS CHART
This chart shows a running total of these omens on the S&P 500 index chart. It is fairly clear that when these flames start rising to levels like they are now, it’s time to start worrying about a correction in the stock market. This indicator does tell us that a bear market is starting by any means, it simply warns us that we should see a decent pulling in price to cleanse/resent the market internals, and investors sentiment.
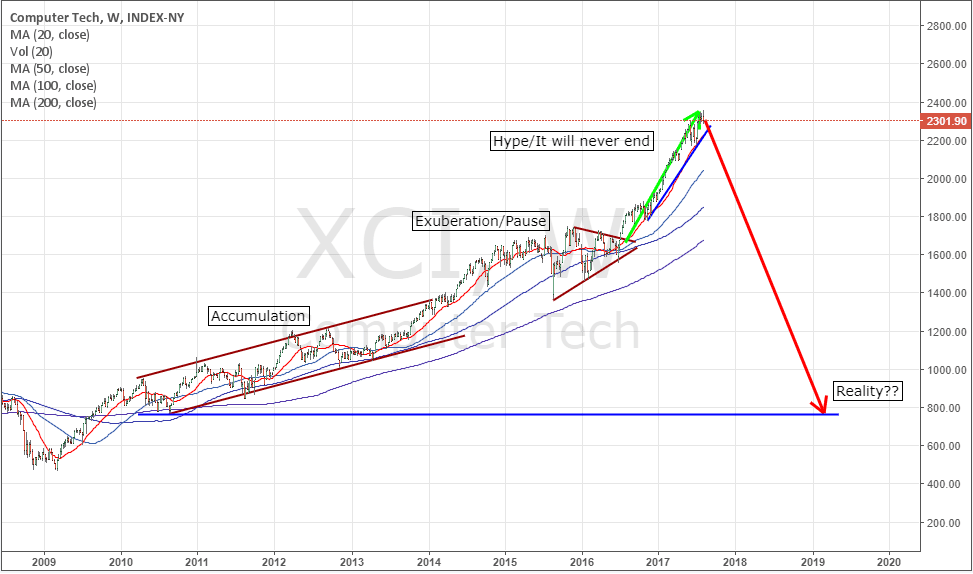
Our second data set we find interesting as it suggests the stock market may be setting up to repeat history in an odd and dangerous manner. As market technicians, part of our job is to work with numbers, find patterns and attempt to predict future price moves in US and Global markets. As you can imagine, it is not always easy to accurately predict the future.
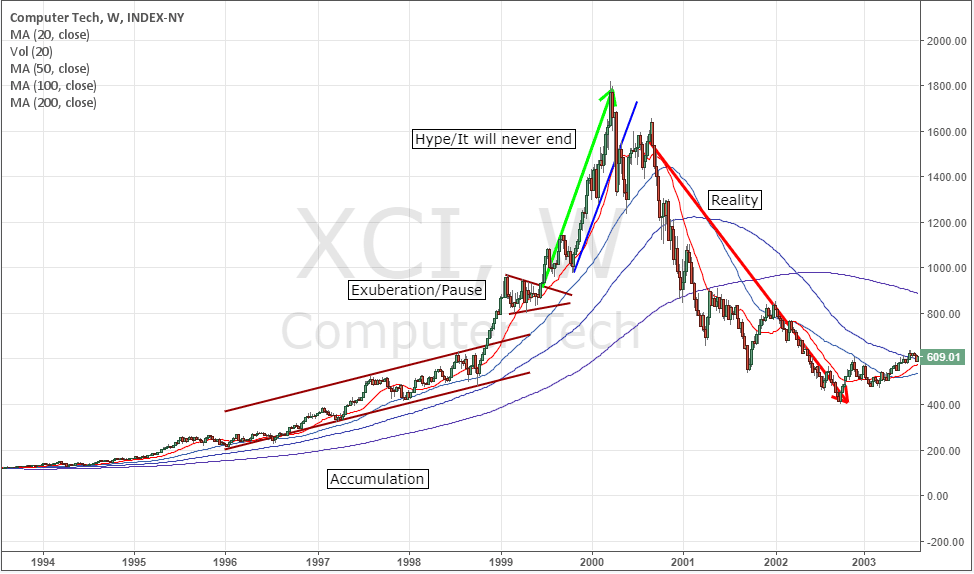
We’ll start by looking at the price activity leading up to the 2000 DOT COM bubble burst. Our analysis focuses on the similarities in price action setting up this price move.
We will let the charts do all the talking as they show the picture clearly.
2000 DOT COM – XCI INDEX CHART
2017 DOT COM – XCI INDEX CHART
We have been watching for sings and patiently waiting for the next major market top for over a year. Why? Because once a market top looks to have formed, we must adjust all our long-term portfolio holdings into different asset classes with cash holdings being a huge position.
Stock prices typically fall 7 times faster than they rise so just imagine being properly positioned for a bear market with a portion of your position knowing you could make 7 years of slow painful growth in only 8-14 months when the bear market starts. I recently did a seminar talking about his and how one can use inverse ETF’s and short selling to profit from the next financial downturn, which will eventually happen, and we will be ready for it.
In fact, Bank of America said: “End of bull market coming in 2018”
Bank of America sees a scary good news-bad news scenario unfolding in 2018 with a strong rally higher in the first half of the year followed by all sorts of potential trouble after.
The S&P 500 may top around 2,850 assuming three things: the “last vestiges” of stimulus from the Fed and other central banks, the passage of tax reform in Congress, and “full investor capitulation into risk assets” on better than expected corporate earnings.
After that, things get considerably sketchy as the second-longest bull market in history starts to run into trouble.
“We believe the air in risk assets is getting thinner and thinner, but the Big Top in price is still ahead of us,” Michael Hartnett – Bank of America
CONCLUSION:
In short, investors continue to pile into equities and buying into every little dip I price that takes place. Its just a matter of time now before the majority of investors have placed all their extra capital into the stock market, and once the level is reached, is when the market will put in a top and hurt the greatest number of investors possible, just like it has done with every other bull and bear market cycle in history.
There will be several great trading opportunities for both short-term traders and long-term investors, which we will share with our subscribers as the market evolves and new strategies must be implemented.
Take advantage of 53+ years of combined trading experience and follow our trades and investment portfolios today!
https://thegoldandoilguy.com/wp-content/uploads/2017/12/chart1.png5981024adminhttp://www.thegoldandoilguy.com/wp-content/uploads/2014/11/tgaoglogo.pngadmin2017-12-02 11:46:042017-12-02 11:46:04Signs That This Bull Market Is On Its Last Leg – Part II
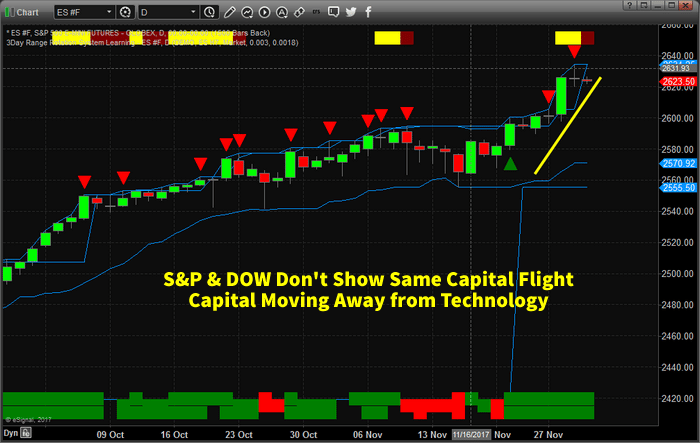
Recent moves in the FANG stocks shows that capital is starting to reposition within the global market. As the end of the year approaches, expect more of this type of capital control to drive greater volatility within the markets. At this time of year, especially after such a fantastic bullish run, it is not uncommon to see capital move out of high flying equities and into cash or other investments.
The recent move lower in the NQ has taken many by surprise, but the bullish run in the FANG stocks has been tremendous. Facebook was higher +59% for 2017 (600% 2016 levels). Amazon was up +61% for 2017 (550% 2016 levels). Netflix was up +64.75% for 2017 (600% 2016 levels) and Google was higher by +37% for 2017 (1000% 2016 levels). These are huge increases in capital valuation.
In early 2017, we authored an article about how capital works and always seeks out the best returns in any environment. It was obvious from the moves this year that capital rushed into the US markets with the President Trump’s win and is now concerned that the end of the year may be cause to pull away from the current environment.
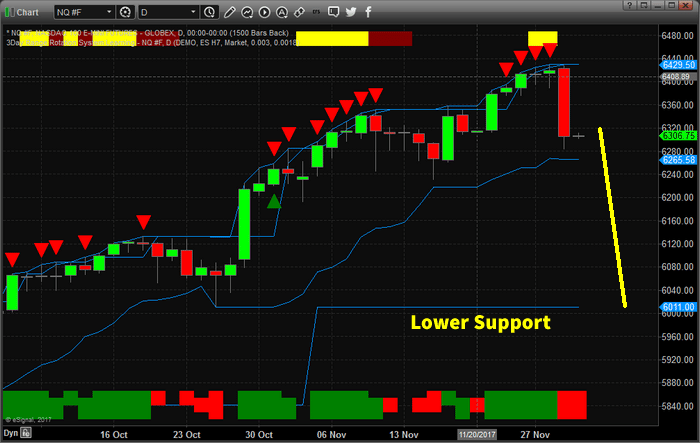
The current decline in the NQ, -2.25% so far, is not a huge decline in price yet. Lower price support is found near the $6000 level. Should this “Price Flight” continue in the NASDAQ, we could be looking at a 6~8% decline, or greater, going into the end of this year.
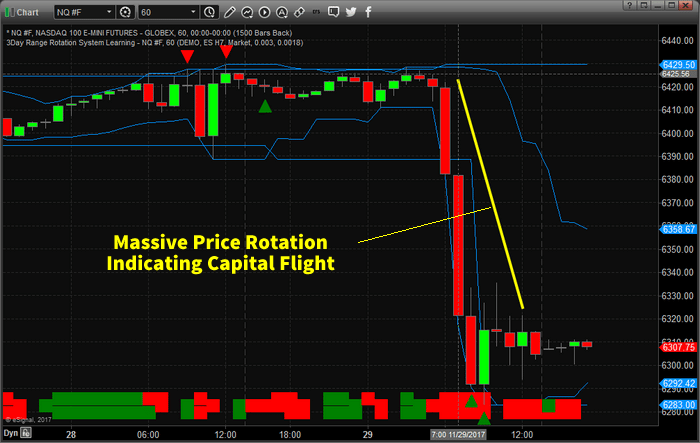
The price swing, this week, was very fast and aggressive. In terms of capital, this was a massive price rotation away from Technology. While the S&P and DOW Industrials continue higher, this presents a cause for concern with regards to the end of year expectations.
Will capital continue to rush into the US markets and specifically Technology stocks? Or will capital rush out of these equities and into other sources of “safety” as technology melts down into the end of 2017? Has the 40~60%+ price rally of 2017 been enough for investors to take their profits and run?
It is quite possible that capital will move to the sidelines through the end of this year and reenter the markets early next year as investors find a better footing for the markets. The facts are, currently, that financials and transportation seem to be doing much better than the FANG stocks. If this continues, we could be looking at a broader shift in the global markets – almost like a second technology bubble burst.
If you want to learn more about how we can assist you with your investment needs, visit www.TheTechnicalTraders.com to learn more. Our researchers are dedicated to assisting you and in helping you learn to profit from these moves. 2018 is certain to be a dynamic trading year – so don’t miss out.
https://thegoldandoilguy.com/wp-content/uploads/2015/05/cvinterview.png151210adminhttp://www.thegoldandoilguy.com/wp-content/uploads/2014/11/tgaoglogo.pngadmin2017-11-22 12:14:542017-11-22 12:16:46Even Junior Stocks Caught Up in Market Mania