It has been proven repeatedly by various market experts that stock market cycles exist. Whether you believe in them or not that is up to you, but as a technical trader myself I see price action repeat on virtually all time frames from the intraday charts, to daily, weekly, monthly, quarterly, yearly, and beyond.
In fact, cycles tend to move in series of 3’s, 7’s and 10’s, and multiples of these as well. So, 3 bars, 7 bars, 10 bars no matter the time frame, though I find the 10min, daily, weekly, and monthly charts work best.
Knowing these cycles lengths, let’s review briefly where the markets are situated in terms of a seasonality, volatility, and the 3, 7 and 10 cycle periods. What I am about to show you is very intriguing.
I will let the charts do all the talking as they show the picture clearly.
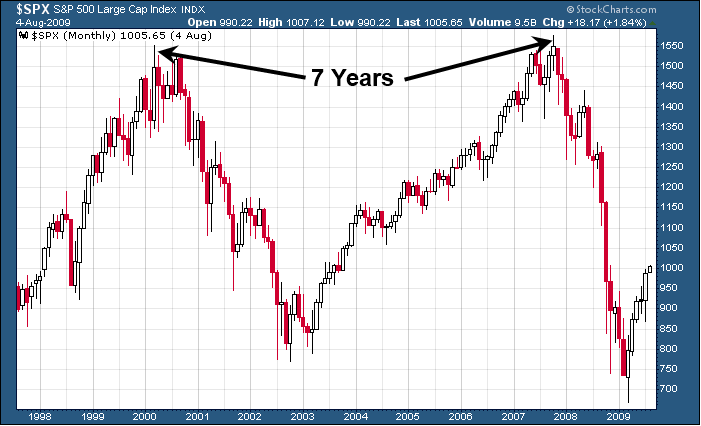
Example of Last 7 Year Stock Market Cycle
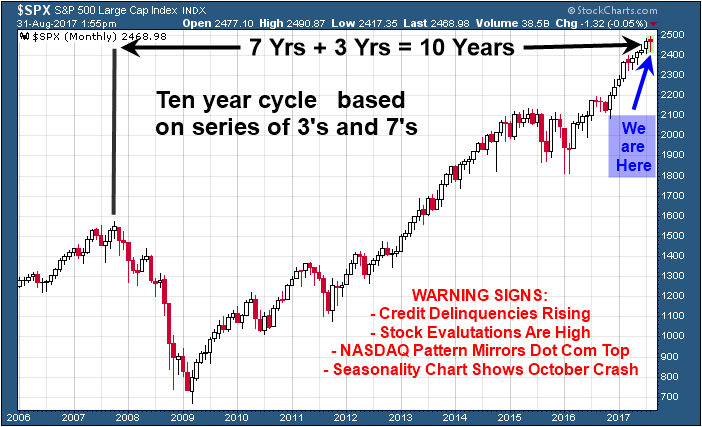
Potential 10 Year Cycle Top Forming
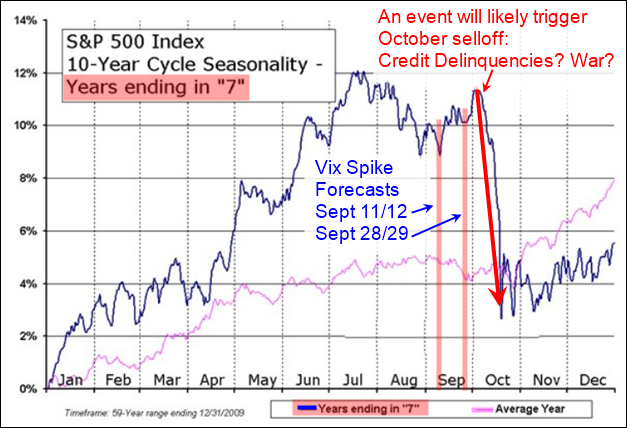
Seasonality of Monthly Price Action for Years Ending in 7
Concluding Thoughts:
In short, this is just a quick snap shot of some angles in which I look at the stock market. There are a lot different things happening (cycles, technical analysis patterns, and fundamentals) which have been painting a bearish picture for the stock market.
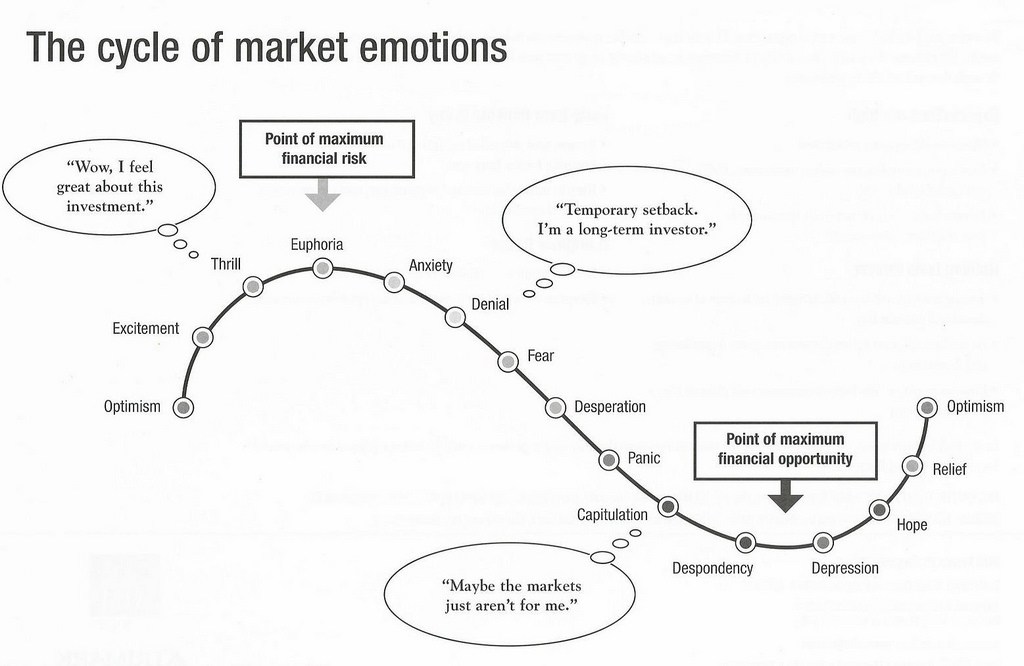
In fact, last year the US equities market were only a couple down days way from trigging a full-blown bear market. But Trump was elected and that triggered a massive rally which I see as being a final exhaustion move (euphoria) just before a major market top.
I have been watching and waiting for what I feel will be the next major market top for just over a year now. Why? Because once a market top looks to be in place we must adjust all our long-term portfolio holdings into different asset classes with CASH being a huge portion of it.
Stock prices typically fall 7 times faster than they rise so just imagine being properly positioned for a bear market with a portion of your position knowing you could make 7 years of slow painful growth in only 8-12 months when the bear market starts. I recently did a seminar talking about his and how one can use inverse ETF’s and short selling to profit from the next financial down turn which will eventually happen.
If you want to stay in the loop and be positioned for this massive move over the next two years Bear Market, then back into a Bull Market be sure to join my 2 Year Trading & Investing newsletter plan at http://www.thegoldandoilguy.com/etf-trading-newsletter/
Chris Vermeulen
https://thegoldandoilguy.com/wp-content/uploads/2017/08/7-seasonal.png428627adminhttp://www.thegoldandoilguy.com/wp-content/uploads/2014/11/tgaoglogo.pngadmin2017-08-31 14:51:492017-08-31 15:18:20Years Ending in 7 Stocks do this in October…
Our recent analysis suggests we may be setting up to repeat history in an odd and dangerous manner. As market technicians, part of our job is to work with numbers, find patterns and attempt to predict future price moves in US and Global markets. As you can imagine, it is not always easy to accurately predict the future. Still, we take on the challenge and truly enjoy being able to find and share trading strategy concepts with our ActiveTradingPartners newsletter. As such, we are sharing this recent technical research data with your today.
Recently, the ActiveTradingPartners research team identified a unique pattern in the VIX that allowed us to accurately predict the June 29 VIX Spike nearly 3 weeks in advance. Also, on July 30th, we predicted a big decline in the NASDAQ during August. It also allowed us to know that VIX Spikes were possible on other future dates – such as the most recent date near August 4th. Even though the current VIX Spike did not hit exactly on the August 4th cycle date, the actual VIX Spike move happened only two trading days after our predicted date and the VIX has rallied over 90% from recent lows. Sometimes, analysis like this allows us to know months in advance that a cycle or critical event may have a higher probability of happening. This allows us to plan and profit from our research.
Today’s research correlates to the recent price moves in the XCI index (Computer Technology), NASDAQ and US Majors. The premise of this research is that the past 4+ years have resulted in a global investment in Technology firms as a result of lower ROI in most other sectors. This focus on technology investing is uniquely similar to the XCI Index DOT COM rally from the late 1990s and early 2000s. We are attempting to verify our presumptions and analysis by using core technical analysis techniques as well as fundamental price analysis.
We’ll start by looking at the price activity leading up to the 2000 DOT COM bubble burst. Initially, our analysis focused on the similarities in price action setting up this price move. The Accumulation, Exuberation/Pause, Hype and eventual CRASH phase. In 1995, the Accumulation phase initiated after a nearly 95% rally from 13+ months earlier (1994 – 462 days total). Currently, the Accumulation phase initiated after a 100%+ rally from 13+ months earlier (2009 – 427 days total). Subsequently, the Accumulation phase lasted 1057 days resulting in a 238%+ advance in 1998. The current Accumulation phase lasted 1456 days resulting in a 77%+ advance in 2014. Interestingly, the 1998 advance totaled 472.50 pts while the 2014 advance totaled 594.00 pts – resulting in a 125% advance size increase.
The Exuberation/Pause phase in 1999 lasted 252 days and resulted in a 207.19 pt move (+31.51%). The Exuberation/Payse phase in 2016 lasted 889 days and resulted in a 288.26 pt move (+21.15%). The more recent phase took 3.5x longer (time) to result in 139% greater price advance (which was actually a reduced percentage move of only 67% of the 1999 advance.
I advanced the term WEEKS where is should have been days.
Many analysts may be quietly stating, “all of this can be attributed to relationships of percentage values vs higher price valuations”, which is of course true. Our attempt at dissecting these moves is to try to understand the propensity and strength of any future moves.
Lastly, the HYPE phase lasted 39 weeks in 2000 ending with an advance of 895.23 pts (+97.94%) from the PAUSE/FLAG breakout in 1999. The current HYPE phase lasted 53 weeks ending with an advance of 674.54 pts (+40.26%) from the PAUSE/FLAG breakout in 2016. The resulting current HYPE price advance is 25% lesser than the 2000 move and results in a nearly 60% decrease related to the total percent swings.
2000 DOT COM – XCI Index Chart
2017 DOT COM – XCI Index Chart
The 2000 total phase advance lasted 220 weeks and resulted in a price advance of +1607.53 pts (+802.39%). The 2017 total phase advance lasted 436 weeks and resulted in a price advance of +1878.21 (+402.97%). The percent values of each move represent vastly different results, yet the total price moves differ by only 17%. We are certain some of these values and percentage representations are sparking interest in some of you as you may understand Fibonacci, Gann and other price analysis techniques.
The key to understanding these similarities is to understand the price sometimes moves in similar, not exact, setups and that we should never discount the possibility that markets are setting up for another massive move. Considering these price and relationship values, it is our perception that any global event, liquidity collapse or massive terrorist event could present a scenario that may result in a repeat of the 2000 DOT COM market collapse. Our premise is that the US has been an investment safe harbor for many and that Technology (FANGs and others) have benefited greatly from the global market weakness over the past 7+ years. It is our opinion that the capital that has been allocated into these global technology giants has, as in the past, setup a potential for history to repeat itself (given the right type of events/circumstances).
COMBINED DOT COM – XCI Index Charts
Our recent VIX Spike analysis shows we should expect future VIX Spikes on Aug 23rd, Sept 11th or 12th and finally Sept 28th or 29th. Assuming the relationship between the current price setup and the past setup is relative to the types of relationships we’ve studied so far, we can predict the following :
The initial swing low after the ultimate high (2000) resulted in a 572.02 pt move (a 31.62% correction over 10 weeks). Any current correction could result in an 8~15.5% price correction over 7~15 weeks. This would put our estimates of a price low near 2152~1980 on or near Sept 25th or Oct 23rd. This price low would be followed by 4~12 weeks of price advance setting up a right shoulder near 2150~2256 (possibly). Following that, we would see the low price rotation broken by extreme selling pressure and ultimate low target near 770~581 (resulting in a 63~69% correction from the highs).
Do we know this WILL happen? NO. Can we estimate the probability of it happening as we predicted? NO. How can we tell if this will play out as we are predicting? If the market continues to break down and begins to form the right shoulder, then we would consider, at least this first phase, to be technically accurate. If it fails to move lower to establish this move, then we would consider this a technical breach of our research and attempt to reevaluate our theories.
Thus, what we can do at this point is alert you to the potential that a massive Head-n-Shoulders formation may be setting up in the global/US markets related to a potential Tech Bubble. The proof will come with confirmation of our analysis or the failure of our analysis as price plays out over the next few weeks.
Still, the correlation of the VIX SPIKE dates, Aug 23rd, Sept 11th or 12th and finally Sept 28th or 29th, are interesting because our initial analysis of any price low indicates a potential low price date range near September 25th. Should this become true, an 8~15% correction in the XCI would clearly result in a 4~9%+ correction in the NQ and would correlate with our VIX Spike analysis almost perfectly.
The only thing we can do is be aware of these relationships and price patterns that are setting up and plan our trades properly. Every trade includes risk, attempting to manage that risk is the objective of most traders. At this point, Aug 23rd, Sept 11th or 12th and finally Sept 28th or 29th are critical dates to keep in mind as the future plays out before us. Watching for these moves and being aware that they could be setting up for a massive price swing lower are important factors to consider and being able to protect open LONG positions would not be a bad idea over the next few months.
The only way one can tell if predictions of the future are going to be accurate or not is to wait for the future to get here and see how well these predictions worked out. So, we wait with the understanding that we are watching for confirmation or failure of our analysis with each week.
If you like our research and analysis and want to learn more about our forecasting and trade alert services, to see what we can offer you. We provide daily market updates, clear and concise trading triggers/signals, advanced research and analysis of the US and global markets and more.
Chris Vermeulen
https://thegoldandoilguy.com/wp-content/uploads/2017/08/setup.png574974adminhttp://www.thegoldandoilguy.com/wp-content/uploads/2014/11/tgaoglogo.pngadmin2017-08-13 22:26:432017-11-10 14:56:35DOT COM Bubble Do-Over?
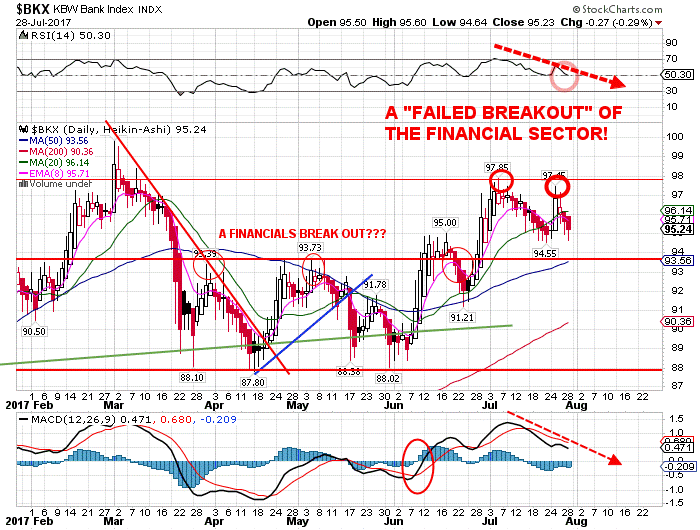
The loss, of the leadership of the banking and financial sector, BKX ETF, is now a major warning signal which is what is required in order to move the SPX much HIGHER, at this time!
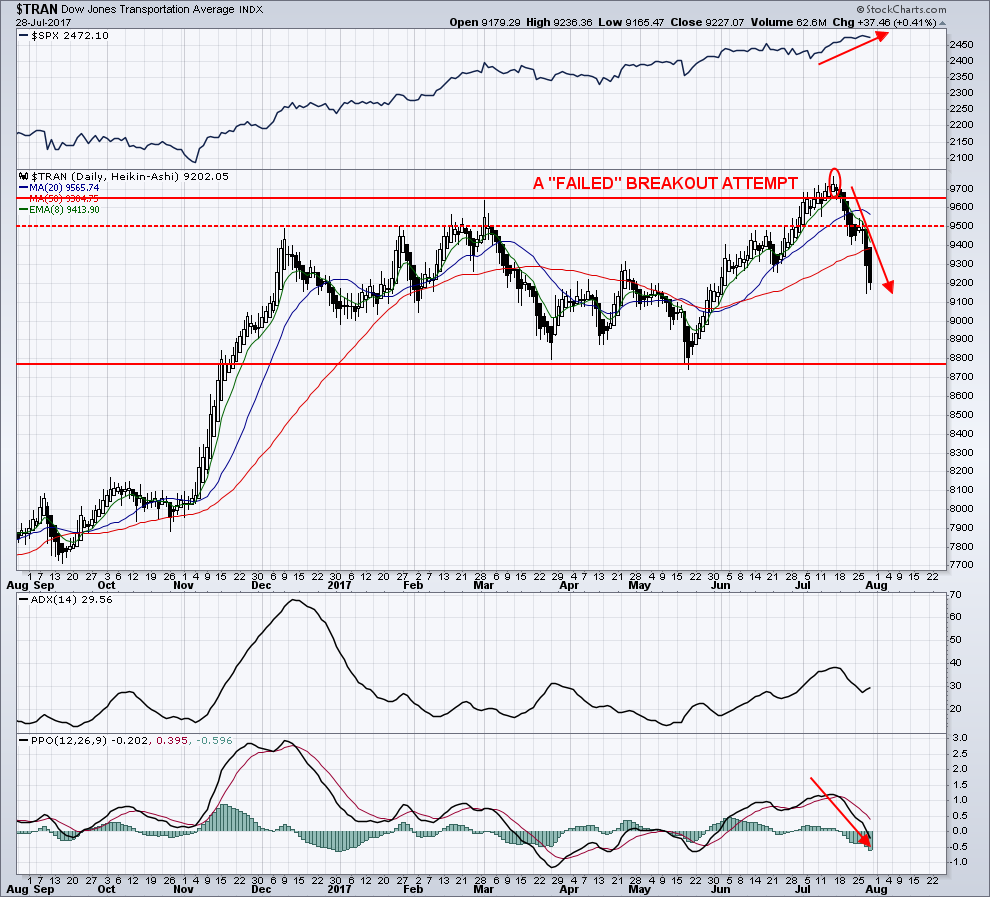
The divergence which is currently being seen between the Dow Industrials and Dow Transportation indexes will be coming into play in the upcoming weeks.
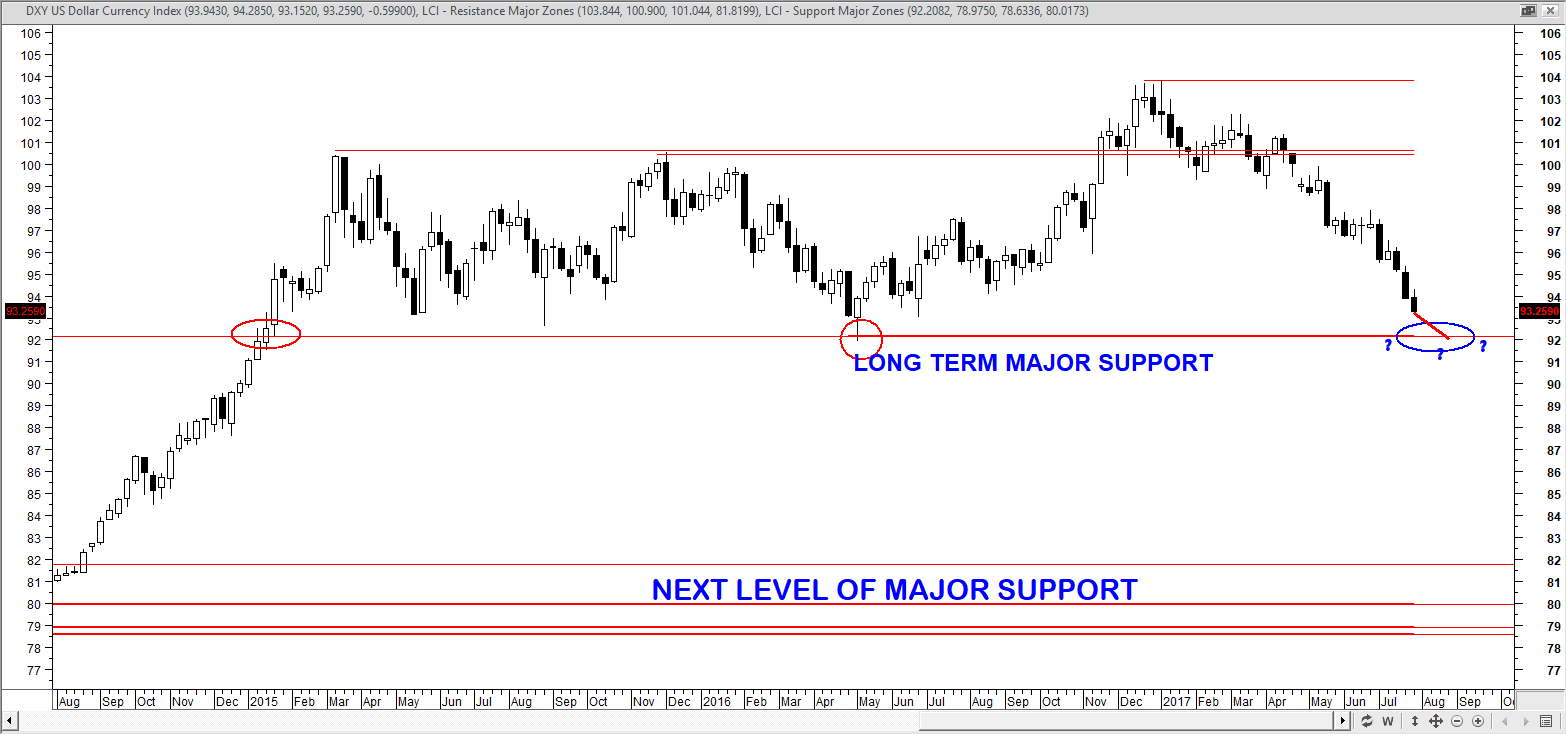
The U.S. dollar has declined to a 52-week low. When stocks have been at a high and the dollar at a low, historically, the SPX showed a positive return within six months to one year, almost without exception. I see support in the 92.50 area.
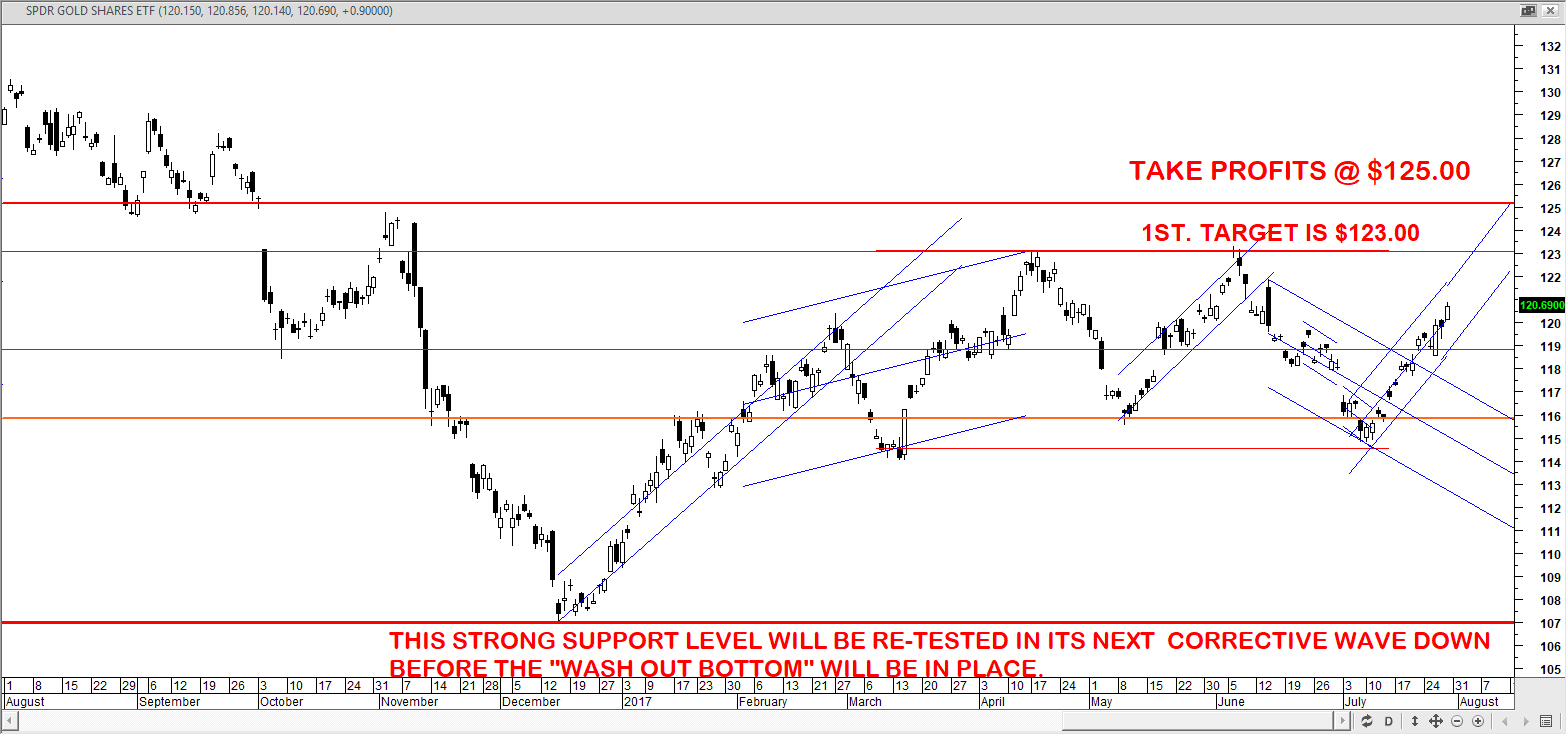
I would expect to see a very quick “oversold” bounce in GLD, then a correction to the 105 to 107 areas as the final “washout bottom” is put into place.
My approach to the markets is to be flexible enough to handle the possibilities of much stronger and weaker sustained trends than what we have seen in our investment lifetimes.
Our portfolio has outperformed the SPY by over 114% this year. Quite a feat when you consider the SPY is up nearly 9% this year and has almost gone straight up since January 2017.
We like to ask our clients and viewers this question, “isn’t it time you invested in your future?”. We would really like to help you achieve greater success and find greater opportunities in the markets, but you have to subscribe for this to happen.
Conclusion:
In short, active traders should be defensive over the next few days as we could have one more bout of selling in stocks and a spike in the vix. I feel the best plays right now will be short metals, short oil, long dollar.
https://thegoldandoilguy.com/wp-content/uploads/2017/08/bank1.png530700adminhttp://www.thegoldandoilguy.com/wp-content/uploads/2014/11/tgaoglogo.pngadmin2017-08-08 09:43:062017-08-08 09:43:06The Divergences Are Now Appearing!
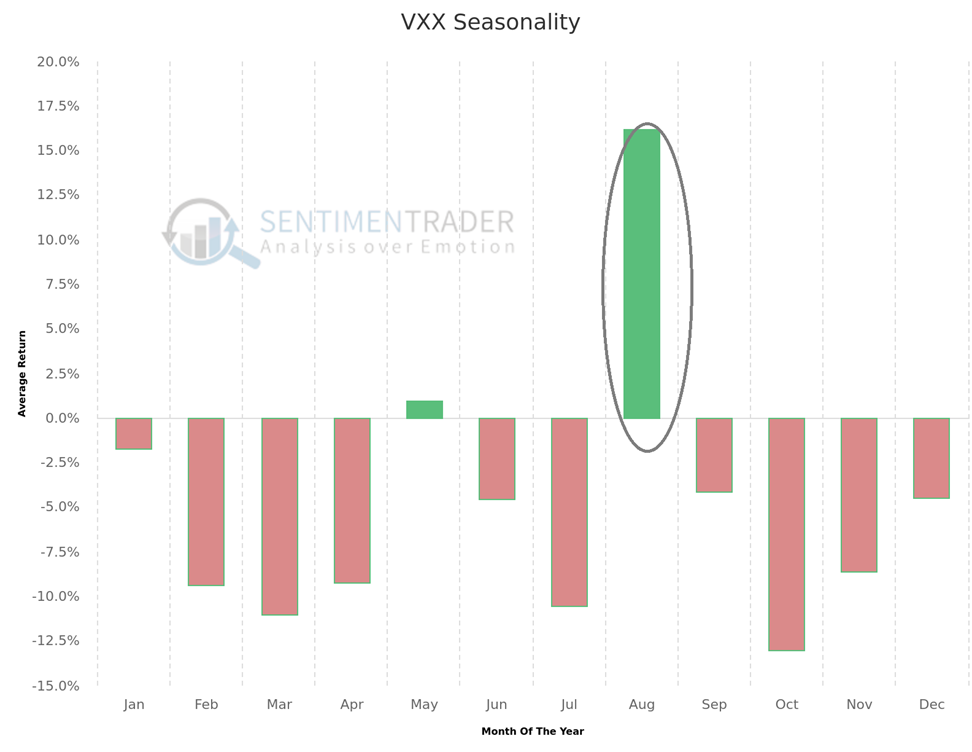
Technically speaking, this week could be very important for the major U.S. equity markets. There is an appearance of a “TOPPING PATTERN” forming. I am now awaiting confirmation by the actions of the equity markets, this week. Expect downward pressure beginning this month of August of 2017.
The Only Chart You Need To See!
There is currently limited upside potential in the SPX relative to potential downside for the months of August, September and the early part of October 2017. There are signs for the short, intermediate and longer-term trends returning for the best six months of trading officially inaugurated in November of 2017! This is the timing framework when ‘The Next Runaway Leg Up In The Stock Market Will Resume.’
In last weeks’ market action as the profit taking rotation out of the high-tech sector rotated into the Dow Industrials, it reflected a more defensive approach while being invested in “Blue Chips” during which time it achieved a new high. Sector rotation increased especially noticeable in the transports and technology sectors that were leading the markets higher. If they continue lower, more sectors will join the decline. I am expecting a coming pop in the VIX on Aug 4, Aug 23, Sept 11 or 12 and finally Sept 28 or 29. 2017. There was a flight to safety in the Yen as well as a strengthening of the price of Gold, Silver, Bitcoin and WTI Crude Oil.
People are starting to park their money in digital currencies, like Bitcoin and Ethereum, rather than parking them in fiat currencies – I buy and hold my currencies in this crypto wallet CoinBase.
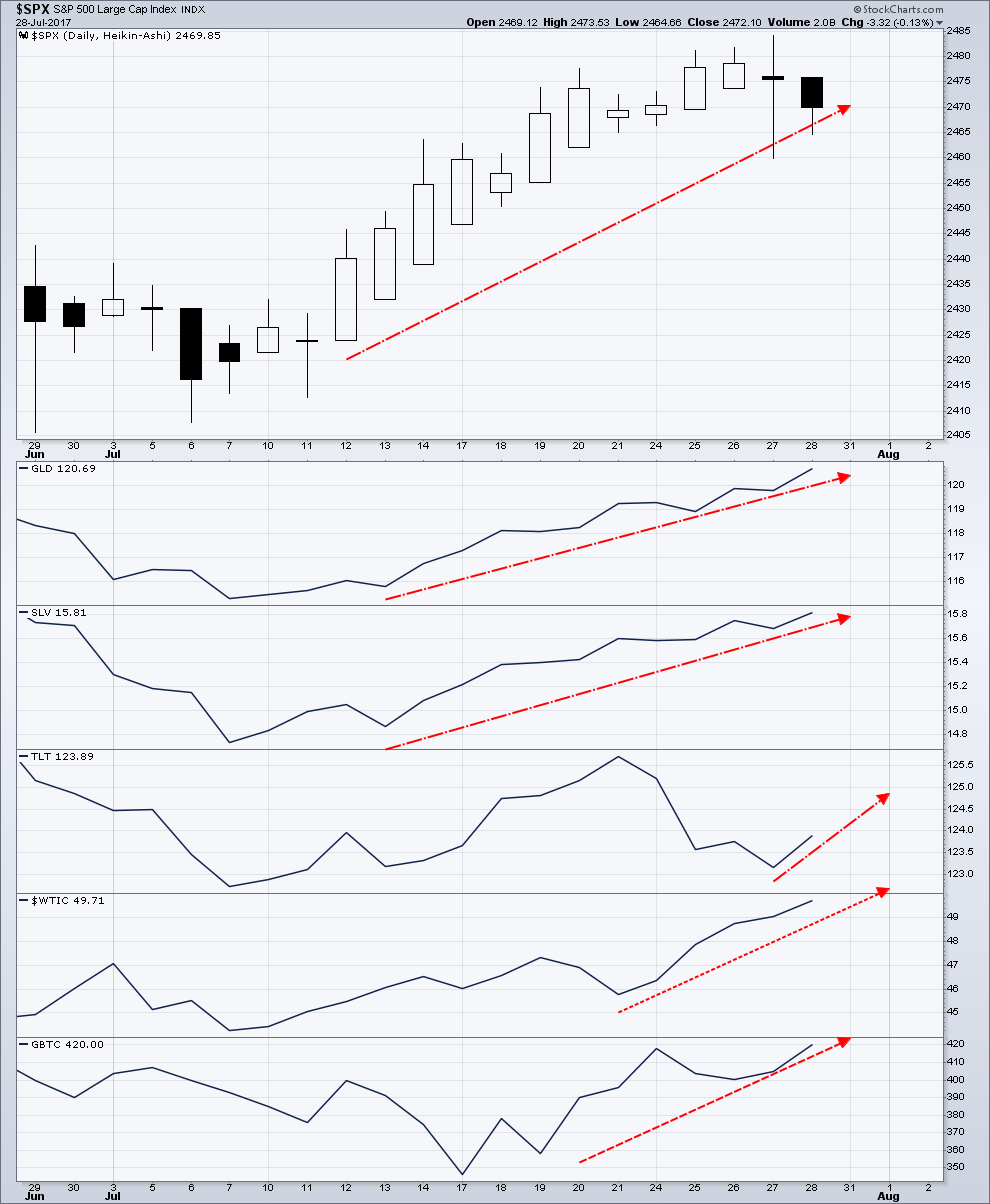
An Unusual Anomaly:
Over the past couple of weeks, there was this unusual Anomaly which occurred, as you can see in the chart below. It now makes me more cautious about our long understanding of “risk inter-connectivity”.
How can the equity, gold, silver, crude oil and bitcoin markets ALL go HIGHER together?
Tune in every morning for my video analysis and market forecasts at TheGoldAndOilGuy.com to now where the main ‘asset classes’ are headed tomorrow, this week, and next month.
In short, the major equities trend remains to the upside but its likely to take shape in a slow grinding process with downward pressure starting in August fora couple months.
Be sure to follow my daily pre-market video forecasts and ETF trades at www.TheGoldAndOilGuy.com
Chris Vermeulen
https://thegoldandoilguy.com/wp-content/uploads/2017/08/vxx.png752972adminhttp://www.thegoldandoilguy.com/wp-content/uploads/2014/11/tgaoglogo.pngadmin2017-08-01 12:05:422017-08-02 21:07:50A Reversal Coming To U.S. Major Indexes?