
Archive for month: March, 2017
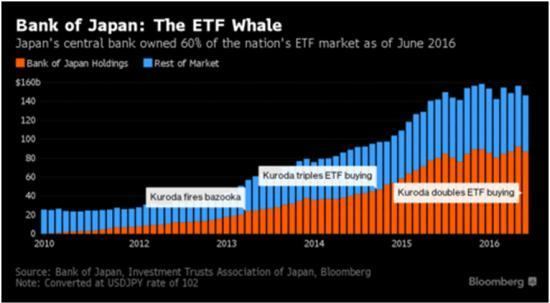
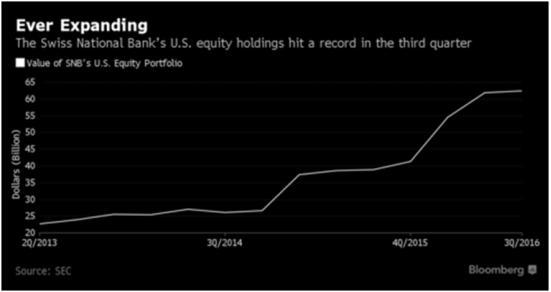
The Japanese and Swiss Central Banks have turned themselves into one of its market’s biggest “investors”. The Swiss National Bank is a huge holder of U.S. blue chip stocks like Apple and Microsoft. The FED has been “elevating” the U.S. stock market, indirectly, by buying bonds!
If the stock market crashes, the FED will bail out investors like Japan and Switzerland in the next market downturn? – http://libertystreeteconomics.newyorkfed.org/2012/07/the-puzzling-pre-fomc-announcement-drift.html.
The FED could lift large cap stocks possibly pushing prices to levels that history would consider totally insane!
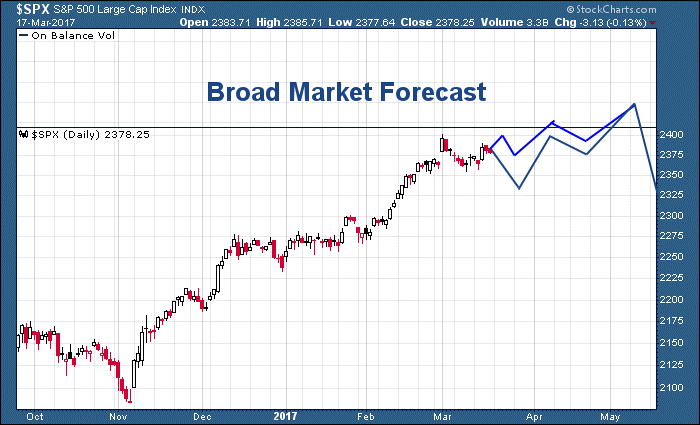
Currently the SPX is experiencing a period of consolidation. Do NOT short this market! The momentum oscillators are now RESETTING for the next move up!
These oscillators are extremely helpful in trending markets. According to Traders Almanac, the month of April is the best month for the Dow Jones with an average gain of 1.9% since 1950, p. 38.
Market bubbles are rarer than you think and very hard to recognize until it is too late. Many economists have long debated whether bubbles can be identified and then stopped, before they burst and cause widespread damage like the crisis of 2007-2008.
Investors are always questioning if it possible to avoid being pulled into a bubble at the top. All investors can avoid declines like the 80% drop experienced by the NASDAQ 100 index of technology stocks between March 2000 and August 2002 just by viewing my daily morning video reports, for by following the direction of the momentum stock trades over at ATP.
The latest Sentiment Surveys disclosed:
Small investors tend to trade on emotions rather than logic or expertise which is why they are considered the dumb money. Finally succumbing to the lure of apparently easy money and pouring their savings into the stock market. This dumb money flowed into exchange traded funds (ETFs) which offers exposure to all sectors and broad market indexes. BlackRock Inc. reports Investors poured $62.9 billion into exchange-traded funds in February of 2017: (https://www.wsj.com/articles/etfs-race-to-fastest-yearly-start-ever-based-on-inflows-blackrock-data-show-1488499476).
The NAAIM survey, (http://www.naaim.org/programs/naaim-exposure-index/), of active investment managers, is showing the least exposure to stocks in months. Active Managers, which is considered the smart money have been stepping cutting back their exposure from “Risk On”
The four other times they pulled back after spending months heavily exposed to stocks, the SPX took off to the upside. They did maintain high exposure to stocks since November of 2016, which was the right move. Now, they have started to reduce their positions and are below 80% net exposure for the first time in months. Investment manager exposure is dipping after months of being extremely exposed.
The stock market tends to swing from one extreme to the opposite extreme as human emotions swing from greed to fear and back again! The CNN Money Fear & Greed Index indicates FEAR at 30 on Friday March 24th, 2017, signaling its lowest level of investor confidence since November of 2016 before the election:(http://money.cnn.com/data/fear-and-greed/). Our metrics are reflecting that optimism is declining after recording extreme optimism, but has reached neutral territory.
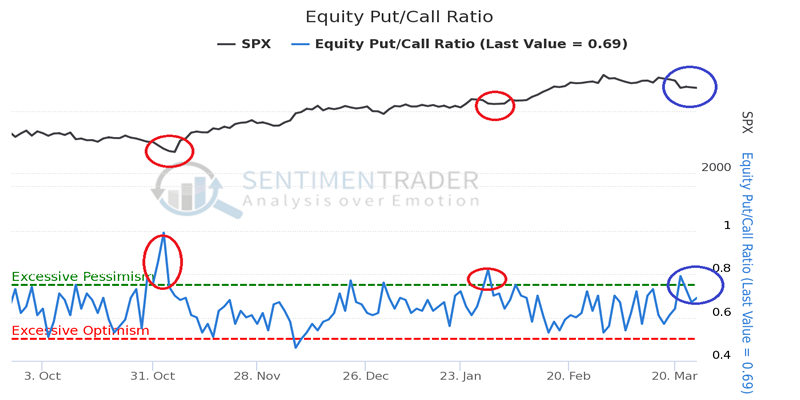
The total put/call ratio is the volume of puts divided by the volume of calls traded on individual equities on the Chicago Board Options Exchange. The chart below indicates that the “sweet spots” to BUY is when this indicator reaches EXCESSIVE PESSIMISM which are marketed by the red circles.
Individual investors feel comfortable with the rate hike by the FEDS as positive. The speed and the extent of the post-election rally and the prevailing level of valuations remain a point of concern The potential impact that President Trump could have on the domestic and global economy continues to cause uncertainty among some investors, while encouraging the majority.
How to Play Wall Street for Profits
We use a combination of traditional technical analysis tools, Elliot Wave Counts and investor sentiment! This makes for Killer Trades with oversized Profits!
There are ways to take advantage of these fast-moving markets to earn a steady income or grow your trading account. That is through our Momentum Reversal Method (MRM). The key tenants of my trading are waiting for the right trigger/event and getting in early. We find this is one of the most difficult aspects for traders to understand and master, and why we do best and share with followers of our trade alerts.
Recent Trading Results Include:
UGAZ 74%
ERX 7.7%
NUGT 112%
URA 2.7%
Our most current active trades are in FOLD and CARB which both are ready to soar with the next market upswing!
Get Trade Alerts in Real-Time at: www.ActiveTradingPartners.com
John Winston & Chris Vermeulen
Our research is showing critical Fibonacci extensions are in place for US Major Markets that may be foretelling of a massive market correction. Part of our research is to search for and study events and resources that are a bit abstract. One component of this research is to identify critical price levels and early warning triggers from abstract price data. The major US indexes and most individual all showing price advanced over the past years and many are showing extended price rallies since the US Presidential election on November 8, 2017. Yet, none are as foretelling as our “US Custom Index”.
The INDU is showing a price advance equal to a 1.8765 Fibonacci expansion.
The SPX500 is showing a price advance equal to a 1.9165% Fibonacci expansion.
What is the relevance of these expansions? Many Fibonacci retracements and expansions fail near a n.875 ~ n.9231. Now, you may be asking, “why should I be concerned about failure at these levels?”. The answer is simple, one of the most important components of Fibonacci analysis is an abstract theory regarding “Failure to Succeed or Failure to Fail”. Another very important component of Fibonacci theory is that “price is always attempting to establish new highs or lows”. How this relates to our understand of what to expect in the future depends on expectations that are presented by understanding Fibonacci ratios, price projections and simple key components of the Fibonacci theory.
Without going into too much detail, “Failure to Succeed” is the failure to match or meet expected price objectives or actions. “Failure to Fail” is the ability of price/trends to exceed expectations or objectives and extend beyond expected target levels. Again, price is always attempting to establish new highs or lows within Fibonacci theory. Therefore, success or failure at critical levels means price should attempt to either reverse or extend.
As you are probably well aware, we have been expecting an increase in the VIX to coincide with extensive major market volatility between March 15th and April 24th. So far, the VIX has jumped form the March 15th low over 41%. You can read more about this by reviewing THE VIX ARTICLE. Our analysis, originated in late January, and warns of an extreme potential for massive price movements across the globe. This all depends of a number of factors correlating to prompt these expected swings, but so far, everything we predicted is starting to happen.
VIX Chart

This next chart of the NAS100 Index shows a number of key components at play. First, the 2.618% Fibonacci expansion level is currently providing strong resistance. Additionally, it shows a series of price cycle bottoms that originate from 2014 & 2015 price lows. Lastly, it shows current price highs are also lining up on a 1.50% Fibonacci Expansion from the recent price rotation illustrated by the last red rectangle on the chart. One should pay attention that the two red rectangles are copies of one another and illustrate that price rotation has been in nearly identical volatility ranges since the end of 2014. Only after the US Presidential election was price able to breakout of these ranges and extend to current levels.
Further, the arcing analysis on the chart represents Fibonacci vibrational price analysis. It is designed to show us where and when price may break out of or into new trends/channels. As you can see, the arcs align relatively well with price activity and price has recently extended beyond the most recent arc level on the right edge of the chart.
Combine all of this analysis into a simple message, one would likely resolve the following : Current Fibonacci price extensions are providing clear resistance. Price cycles state we should establish a new price low near April 24th and price has recently extended beyond a vibrational cycle that coincides with Fibonacci resistance. Historical price ranges show us that June 5th, 2017 may begin a new price trend cycle
NAS100 Chart

The “key” in terms of our analysis and understanding of the current market setup is seen on our US Custom Index. This custom index is made up of key components of the US Economy (US Retail, Real Estate, Consumer Finance, Consumer Discretionary and the SPY). The reason we have selected these for our index is we believe they relate a broad scope of “early movers” as related to the overall health of the US economy. In other words, this custom index should relate early strength or weakness in the relation to general US economic activities rather well.
This chart is showing a number of key components, but most important is the YELLOW line near the top which represents a near EXACT 1.272% expansion of price from recent highs set in 2007 (2.272 % expansions from the lows in 2009). The n.272 Fibonacci expansion levels, like most other Fibonacci expansion levels prompt one of two possible outcomes; a. Price congestion followed by further advance, or b. a moderately deep price retracement (often greater than 25% of the recent move).
This chart, as we stated earlier, is the “key to understand the potential of and expectations of all of this analysis. With the VIX expected to “spike” between now and April 24th, the NAS100 chart showing massive expansion (2.618) that is correlating with recent 1.50% resistance and key vibrational resistance and, this Custom Index, pivoting off of critical 1.272% Fib Expansion, near the beginning of our expected VIX expansion, near Fibonacci Vibrational levels on April 10th and near the lower range of a multi-year historical Standard Deviation channel, we are preparing for an immediate potential price rotation (correlating with a spike in the VIX) that may drive equity prices down to near 2016 lows (a drop of potentially 15~20%).
Custom Index Chart

Our analysis is showing that many key elements of cross market analysis are aligning to warn that we may see a moderate term end to the “Trump rally” and a relatively deep retracement that could shake the markets. We are not predicting a 2009 style crash. We are, although, expecting healthy market rotation that will setup additional opportunities for traders to identify profitable trades.
At this point in time, we wanted all of our readers to be aware of the multiple correlations that support our analysis and the fact that volatility is set to start rising. Keeping this in mind, we are positioning ourselves and our clients to take advantage of these expected moves and we will continue to monitor the markets price action to take advantage of opportunities as they form. If you want know more of our unique Momentum Reversal Method (MRM) and our trade setups, please visit www.ActiveTradingPartners.com to learn more.
Back in early February 2017, we posted an article to all our members about how our analysis showed a very strong potential for larger price swings with the potential for a massive explosion in the VIX indicator based on a price cycle pattern we had been studying. Many of you may remember this article, if not Click Here to review the original.
As of right now, only 10 days into our proposed “VIX Spike Window” (from March 12th to April 15th), we thought it would be a good idea to review some of our analysis before we enter the heart of the VIX expansion window (March 25th to April 8th).
Vix Spike Calendar

As you may recall, we expect a, roughly, five month cycle of expanding VIX volatility to continue within the time-frames mentioned above. The peak of this volatility will likely happen between March 25th and April 8th – what we are calling the “heart of the window”. This will likely be a very tumultuous and volatile period where massive rotations in price could occur. Additionally, new or reversal trends would also be key components of this type of expanded volatility. This means active traders have an opportunity to generate some fantastic returns from these moves.
Based on my original analysis from early February, lets summarize how things are expected to play out over the next few weeks for a few key symbols.

As you review our earlier analysis, pay attention to the details we laid out for each symbol. We expected “key top” levels to be reached at the time of the original article followed by price rotation/retracements, followed by more price trending. Pay special attention to the details we discussed for each of these symbols in the first article.
DIA pulled back near 6% (Min Volatility target reached) from recent highs and we are expecting more volatility before any future moves
QQQ pulled back 2.6% and we are expecting a deeper pullback as the volatility explodes in the near future.
XOI has fallen an additional 4.33% and we are expecting this move to continue to near $1075 (an additional -$81.50) before attempting to find a bottom.
GOLD retraced just over 5% from near $1265 and is currently in a solid uptrend. Our current projection is for a move above $1310, followed by a pullback below $1280 (where we want to try to buy), followed by further upside moves to above $1350.
SILVER has retraced nearly 9% (Min Volatility Target Reached) from recent highs and is setting up potential move back above $18.00 or higher.
DIA Chart 
Gold Chart 
Silver Chart 
At this point, we should be very cautious to consider only highly probable trading signals because the expected volatility in the global markets should become more violent and unpredictable. This makes for great short term Momentum Reversal trades though.
Our recent Momentum Reversal Trades have shown fantastic results like UGAZ 74% and NUGT 112%. The possibility of seeing exploding volatility over the next few weeks in combination with massive potential rotation in prices will allow us to find some incredible opportunities for followers of our work and trades.
Remember, the Heart of the volatility window should be from March 25, 2017 to April 8, 2017. You can take advantage of this by follow us at: www.ActiveTradingPartners.com
Chris Vermeulen
Mr. Burkhard Varnholt, Deputy Chief Investment Officer of Credit Suisse, said:
“Whenever. . .”

Last weeks move in Crude Oil, down over 8.8% was triggered by new “Record High” US inventory data and news that OPEC production cuts are near 85% compliance have prompted a breakdown. We have been expecting a breakout move for a few weeks and suspected production would outpace demand, as it has been for many months.
Below is the chart of oil we sent to followers of TheMarketTrendForecast service last week.

Price of oil after the breakdown which we traded SCO inverse fund

With the weekly EIA inventory report stated a huge 8.2 million barrel inventory increase while production levels are, overall, decreasing. This prompted a continued bearish price slide for Oil and Gas related equities. These moves will setup a number of superior opportunities in the future days and weeks for many traders. Initially, we want to be cautious of the impulse price moves and look to establish strategic trades when the opportunity is perfect.
COP Chart

APC Chart

As these price moves play out over the next few days, we urge all traders to be cautious as we are expecting a dramatic increase in global market volatility to begin with just a few days. Our earlier analysis shows a very strong potential for dramatic volatility increases beginning near March 17th. This means these early moves may be “price traps” that catch inexperienced traders.
Most traders will attempt to follow this move and chase it lower. Even though there may be some validity to this method, we’ve found that the optimal entry is based on “Momentum Reversal Strategies”. In other words, waiting for the ideal timing and entry when the markets show signs that a major reversal is about to happen – we call it the Momentum Reversal Method (MRM).
This move in oil is an early warning that traders need to pay attention to. It will likely setup numerous MRM trade setup/entry opportunities over the next few days/weeks. These are the types of price anomalies that allow my MRM trading strategy to hone into finding great trades.
My Momentum Reversal Method (MRM) trading system allows me to follow these moves and take advantage of the most strategic entry positions for quick gains. Most trades last 3~25 days in length and equate to 7%~35% or more in profits. You can even stay up to date with my analysis and trading triggers with my SMS/Text Messaging alerts sent directly to your mobile device.
In closing, don’t chase this move in oil quite yet. Be aware that we are setting up for a much bigger move with much greater opportunities for traders. If you want to stay aware of these opportunities, then visit our web site to learn more, www.ActiveTradingPartners.com
By: John Winston
And Chris Vermeulen