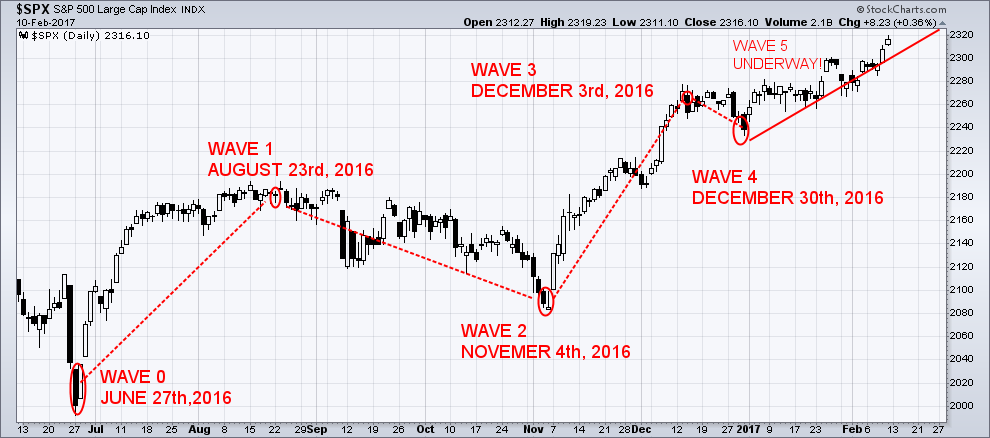
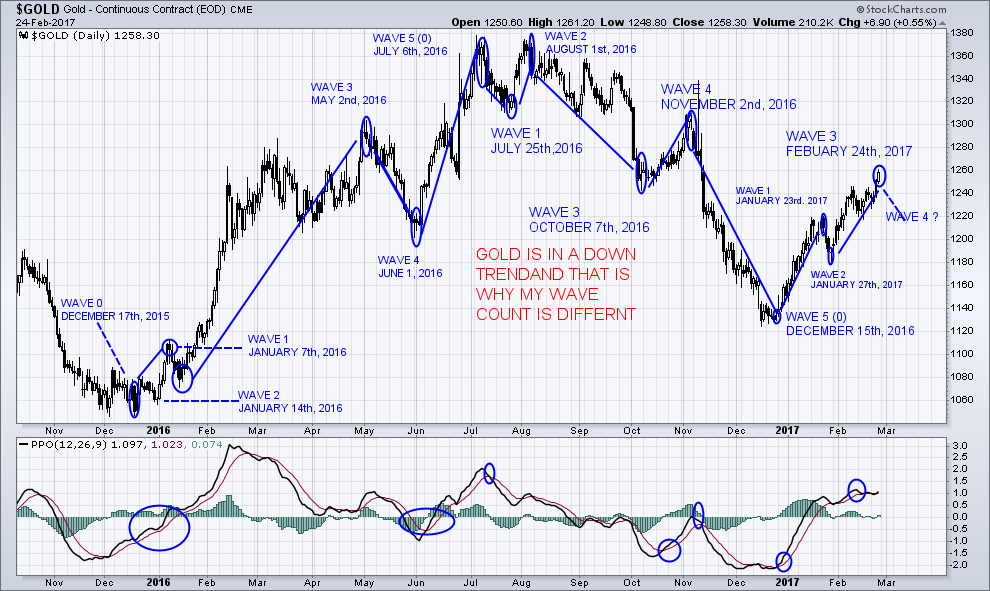
Elliott’s theory is based on the Dow theory in that stock prices move in waves. Because of the “fractal” nature of markets, I have broken them down so that you can trade a daily complete wave count. Fractals are mathematical structures, which on an ever-smaller scale infinitely repeat themselves. Elliott discovered stock-trading patterns were structured in the same way.

This week will be very interesting in the markets. You need to understand what the markets are telling you. The markets are at anextreme”. I trade the most profitable waves, which are impulsive waves 1,3 and 5. It takes time to develop these great trades, but it is worth the wait as you observe the profits rolling in. Do not get caught up on the wrong side of the trade. Timing the waves correctly is a critical factor for creating these profitable
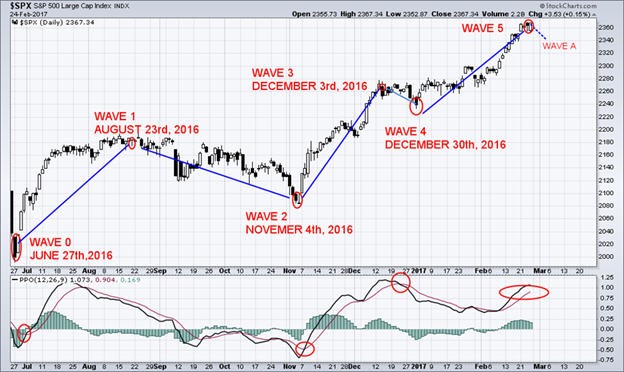
 1trades.

The Corrective Waves are not as easy to identify as the Impulse Waves because the Corrective Waves have more variations as compared to the Impulse Waves. Corrective Waves of any trading pattern are broadly termed as the “ABC Corrections”. Corrective Waves are always the three wave patterns that unfold in the direction opposite of the larger trend.

“ABC Corrections” is the broad name given to the Corrective Waves. The corrective patterns formed by the Corrective Waves are against the direction of the trend. Wave 1 is corrected by the Wave 2 and Wave 3 is corrected by the Wave 4. After wave 5, the wave pattern finishes and the entire move which will be corrected. This correction will occur a multiple wave move. ABC” numbered waves are also the Corrective Waves.

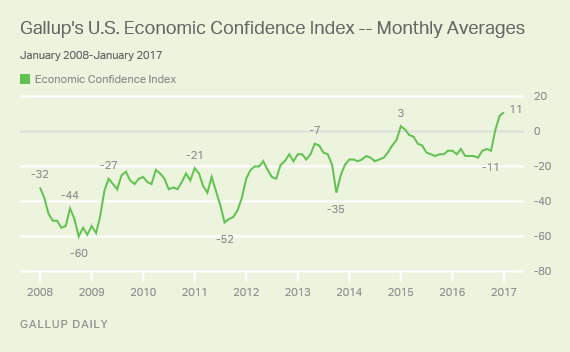
Based on research that I have just completed, when the January and February months are both bullish, the equity markets moved much higher for the rest of the year! (http://www.marketwatch.com/story/still-room-for-stock-bulls-to-run-as-historic-breakouts-take-shape-analysts-say-2017-02-23/email).

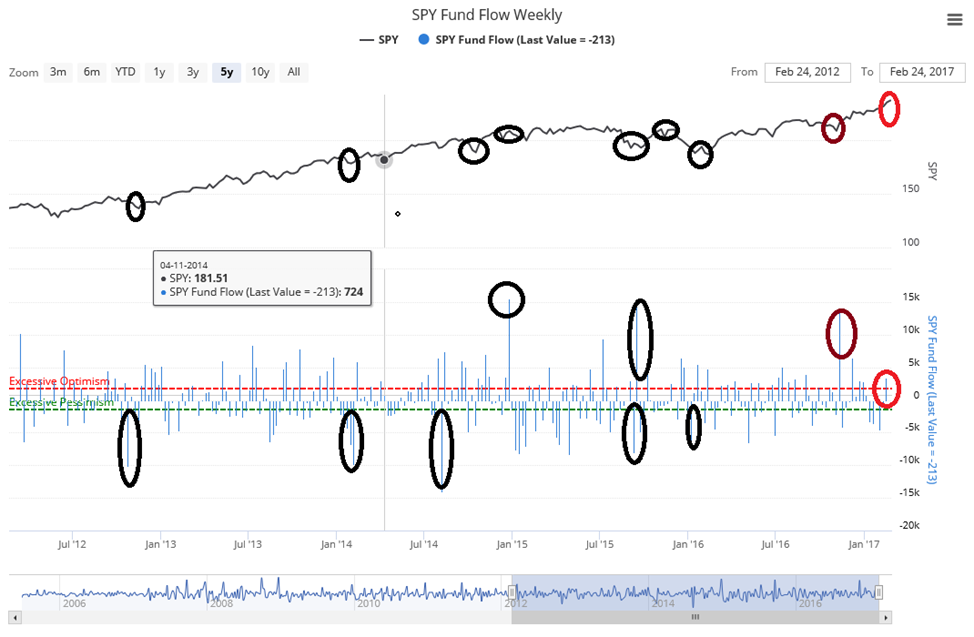
The SPY Fund Flow represents the weekly flows in and out. This is a ‘Contrary Indicator’. When it becomes extremely pessimistic, I then look for a reversal to the upside. When fund flows are very high, I become concerned about a correction as expectations may have become too optimistic.

2

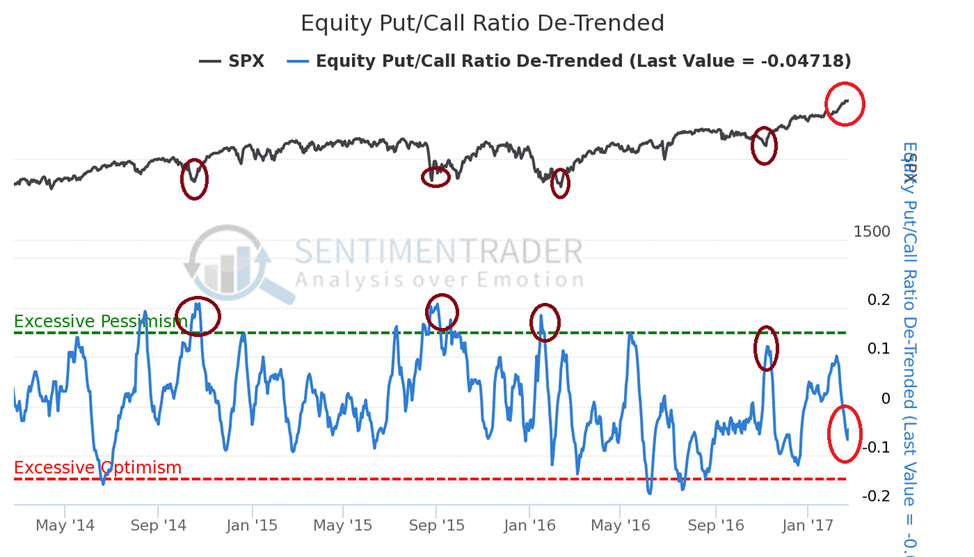
The total put/call ratio is the volume of puts divided by the volume of calls traded on individual equities on the Chicago Board Options Exchange, on any given day.  Generally speaking, heavy volume in put contracts shows large-scale fear by options traders, while heavy call volume is usually a reflection of increased investor optimism in regards to rising prices.  When there is heavy put buying and low call buying, the put/call ratio will be high. When an extreme is reached, this becomes a bullish contrarian indicator and we should expect higher market prices ahead of us. When option traders are optimistic and there is low put volume in relation to call volume, then the put/call ratio will be low and we may be nearing a market high.  The interpretation of this indicator is the same as the equity put/call ratio itself – high readings show fear and are generally bullish for the market. Low readings, show excessive optimism as the market typically declines after they are seen.

3

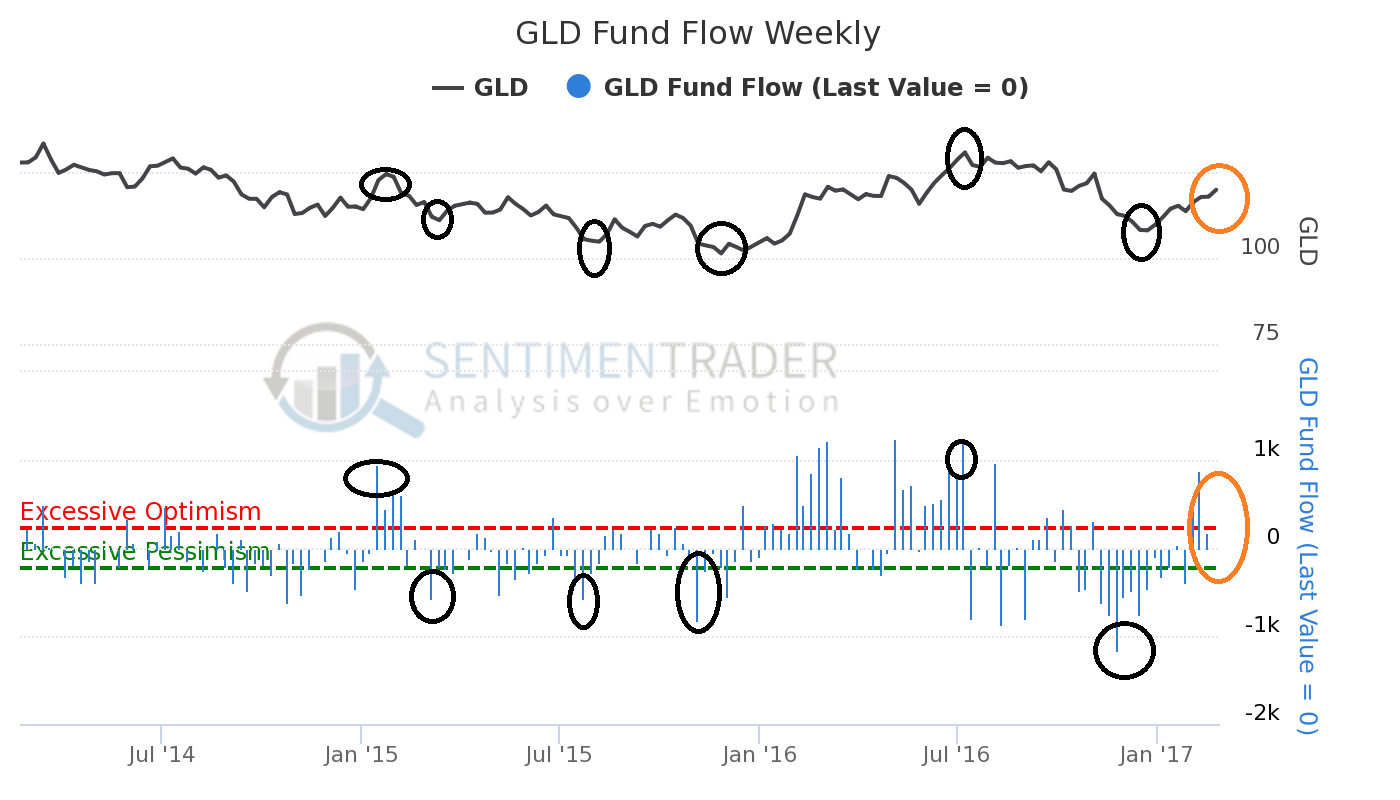
The GLD Fund Flow Weekly Indicator represents the daily flows into and out of GLD: (http://www.wikinvest.com/wikinvest/api.php?action=viewNews&aid=8343471&page=Stock%3ASPDR_Gold_Trust_%28GLD%29&comments=0&format=html).

Contrary Indicators are measuring the fund flows. When it becomes extremely pessimistic, then I begin to look for a possible reversal to the upside. When fund flows are very high, then I become concerned about a correction as expectations have become too optimistic. Why gold is great again: (https://www.forbes.com/sites/ralphbenko/2017/02/25/president-trump-replace-the-dollar-with-gold-as-the-global-currency-to-make-america-great-again/#23cdf01f4d54)

4

5


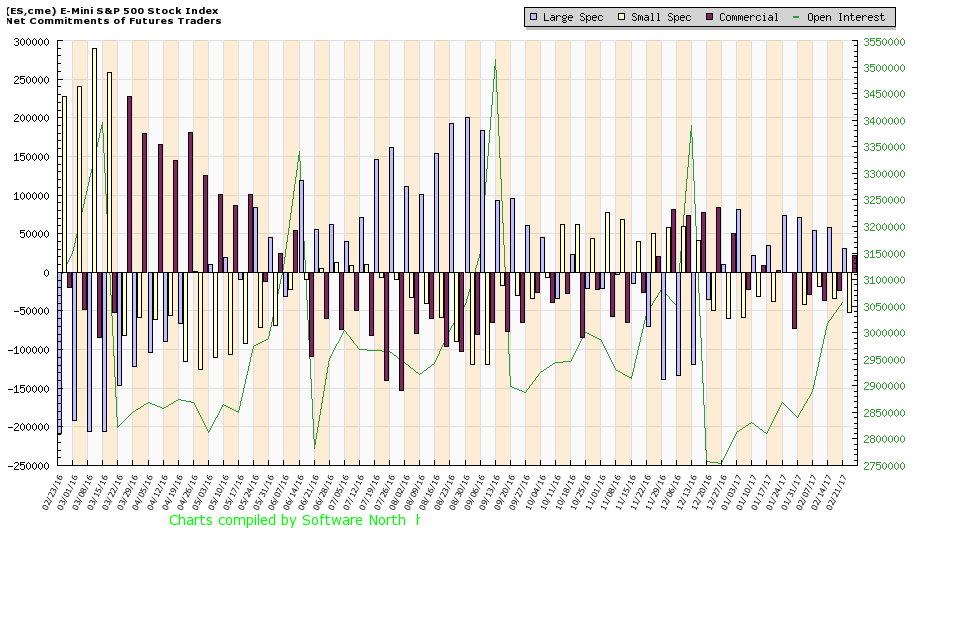
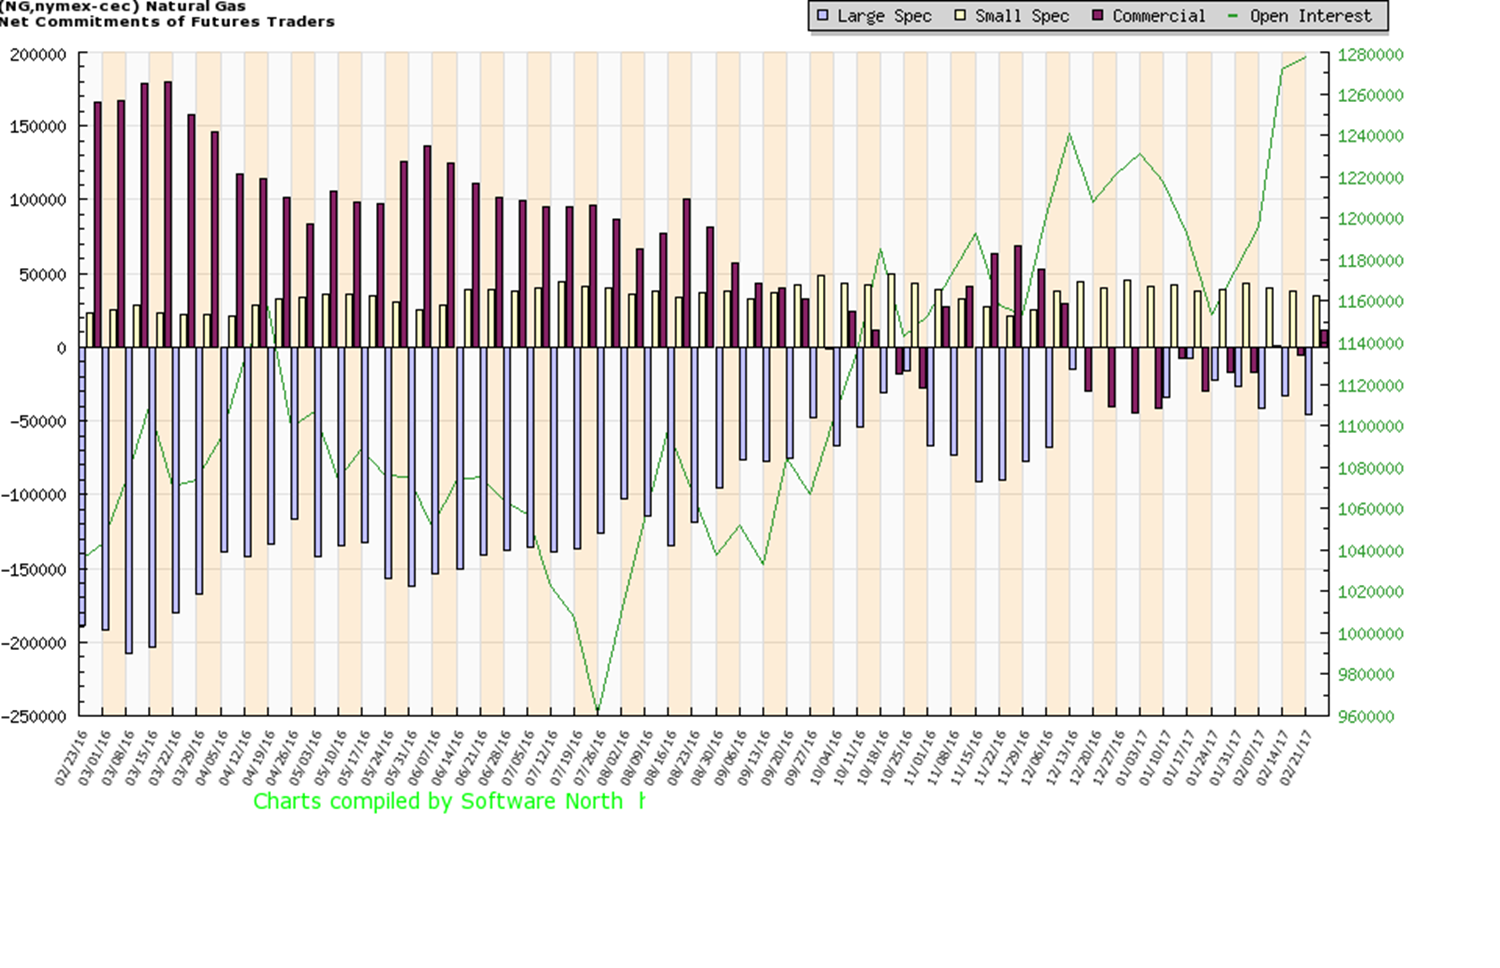
The Commitment of Traders (COT) Indicator gives you the overall picture of what is happening behind the scenes. It tells you who is buying and who is selling!  This information is an important key for your trading success!

The commercial traders are considered the “Smart Money”. The chart below displays, as of February 21st, 2017, that the commercial traders have taken new long positions.  This matches up perfectly with my long-term Elliot Wave forecast of 2550, in the SPX.


Red Bars: The Commercial Traders
(i.e.: Farmers, Hedgers, Producers, and Factories)

Blue Bars: The Large Speculators
(i.e.: Banks and Large Financial Money Managers)

Green Bars: The Small Speculators
(i.e.: You and me)

Yellow Line: The overall open interest in the market.

6

7

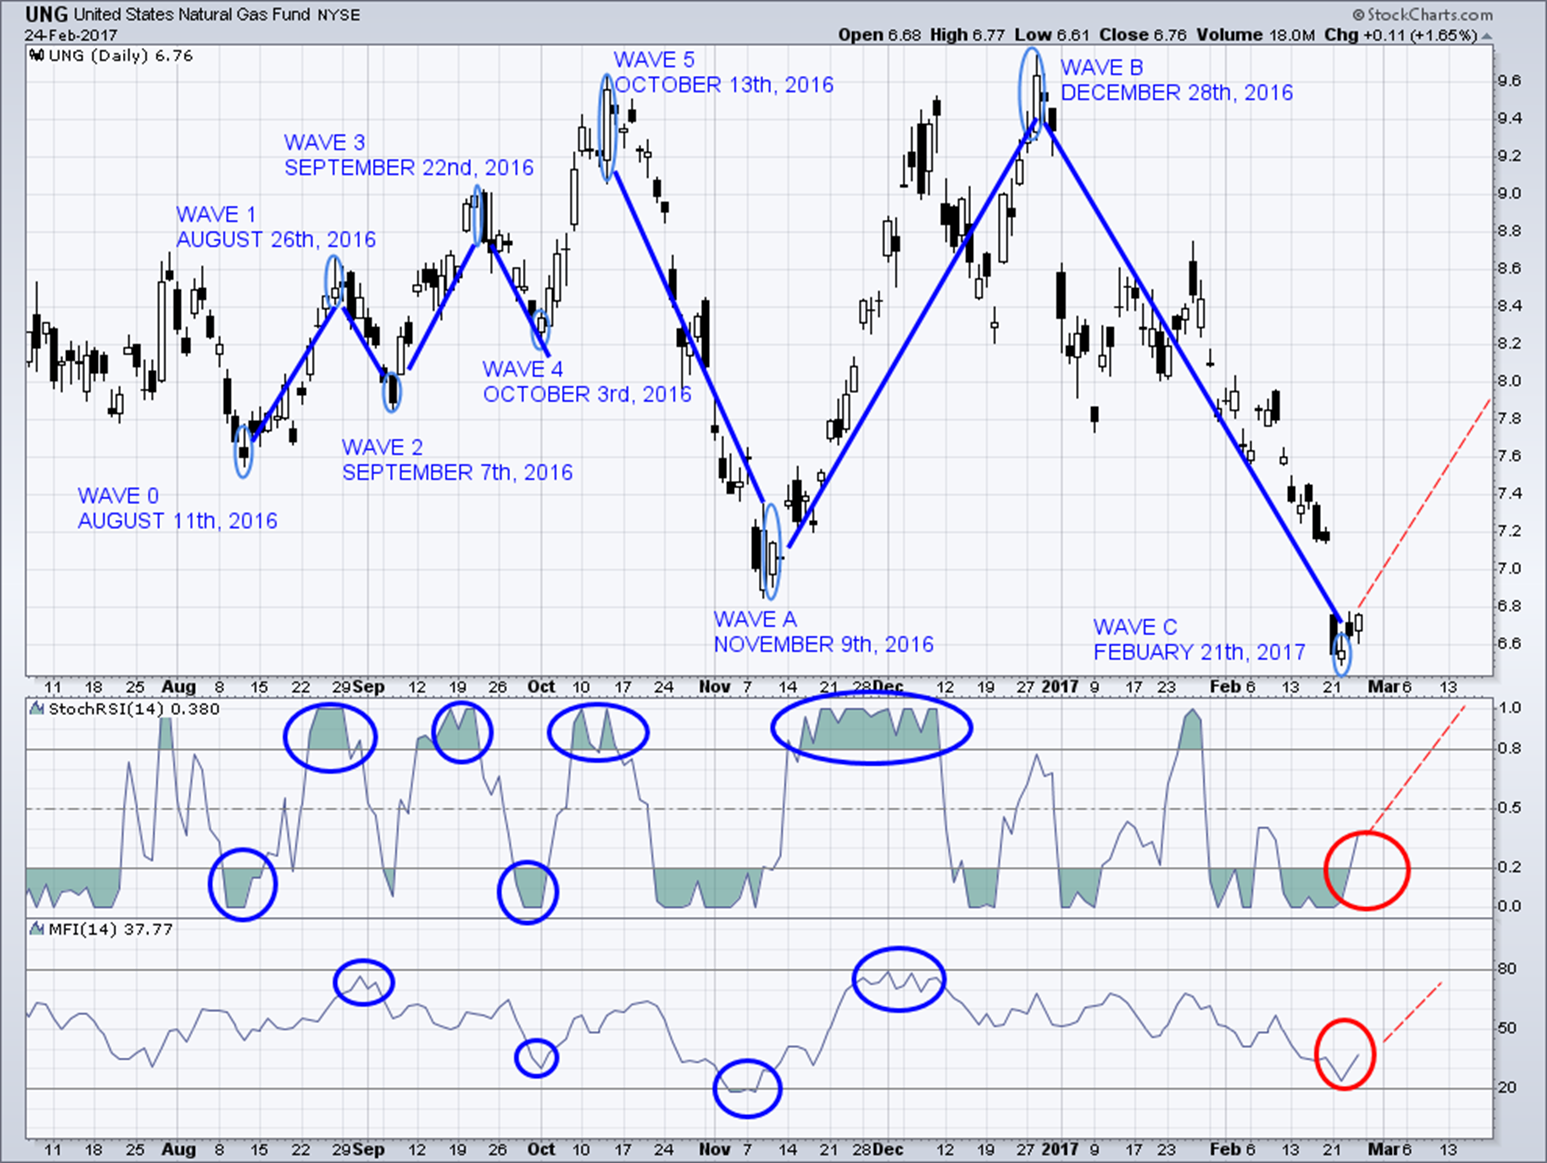
The next setup for going long on Natural Gas.

8

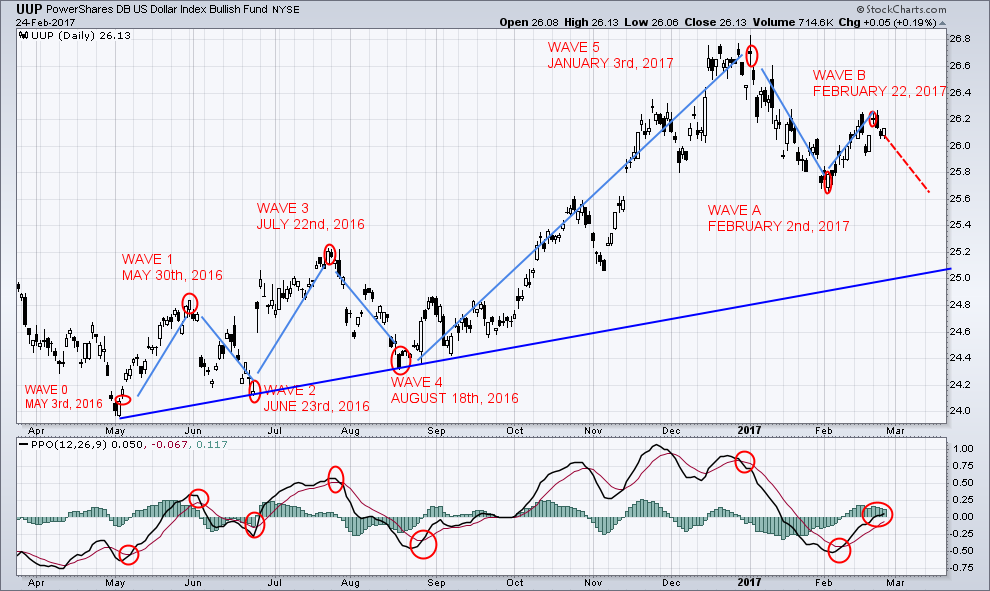
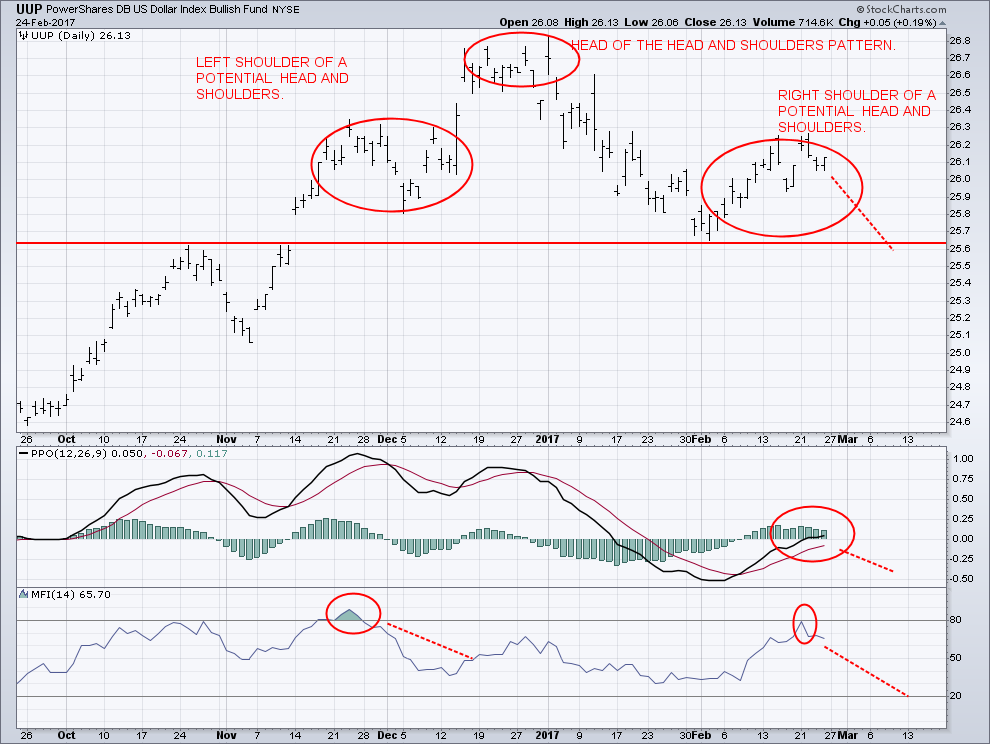
The U.S. dollar: Waiting for trend confirmation.

9

10

Learn how to build wealth during 2017!

Every week, there are new actionable trade ideas. Avoid what I refer to as “Herd Mentality” which will put you on the losing side of the trades more often than not.

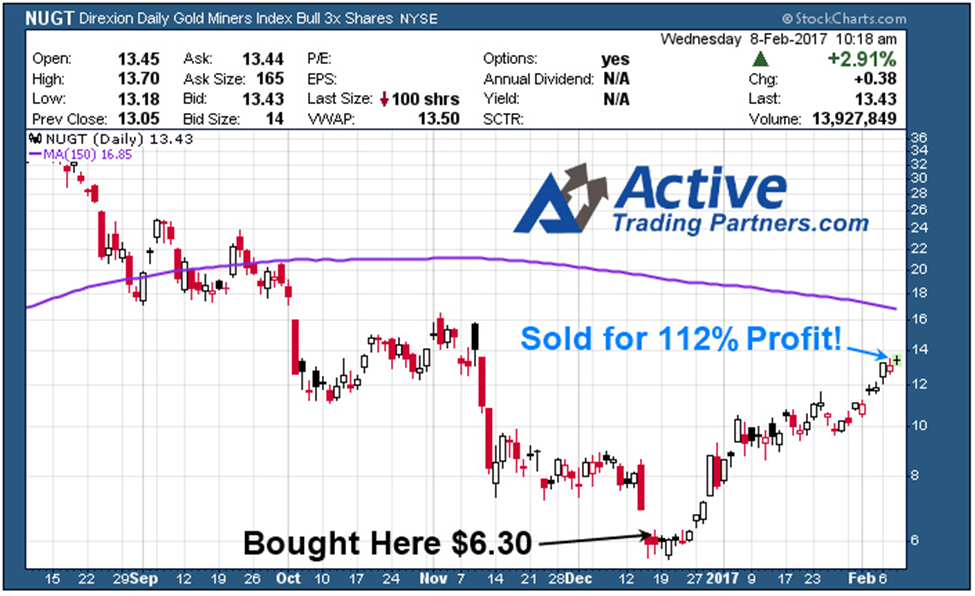
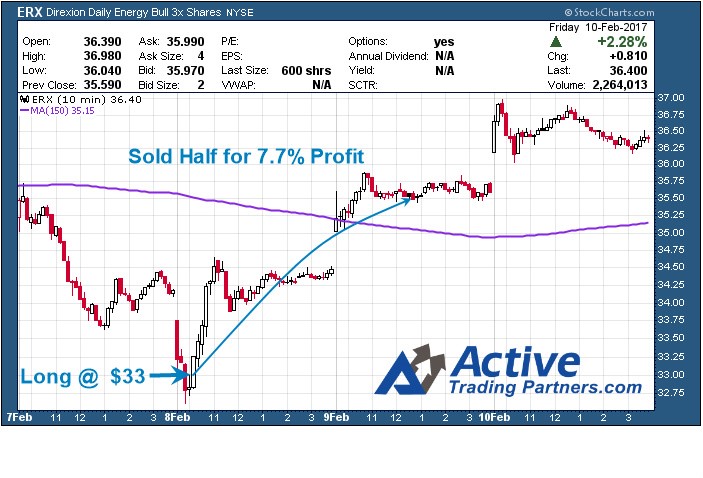
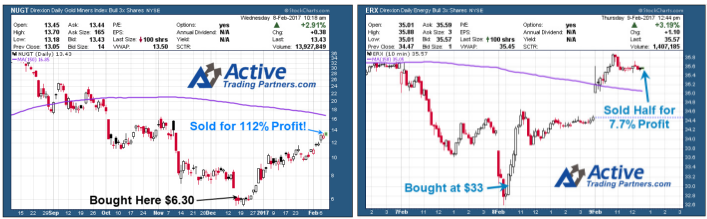
Our most recent trade was UGAZ:( http://etfdb.com/etf/UGAZ/) on February 21st, 2017. We sold half of this position to lock in a quick 10+% profit in two days. Previous trades generated a 112% profit within 25 days (NUGT), and 7.7% profit (ERX) within 24 hours.


Stock Market bulls will continue their historic breakouts!

The Trump Administration’s promises of tax cuts and regulatory easing is the catalyst for the markets’ recent strong advance. Mr. David Dodd’s timeless classic saying: “The market in the short term is a voting machine, but in the long run it is a weighing machine”. This is the second most bullish market, after an election, since President Kennedy took office.

The Research Investment Committee commented “Monetary, fiscal and regulatory policies could be key drivers in 2017, but the timing of those actions could cause volatility”.  New regulatory action will favor many stocks in the financial and energy sectors. Repatriation will occur under President Trump’s new corporate tax plans. The U.S. currently operates under a tax system in which the domestic earnings of U.S. corporations are taxed at the federal U.S. corporate rate (35%) and any overseas earnings that are repatriated are taxed at this rate less a credit for foreign taxes paid on those same earnings. Foreign earnings have been parked offshore, allowing corporations to avoid the taxes associated with bringing them back to the U.S. These U.S. Companies would be granted an eight-year period to pay their tax liability. President Trump’s plan calls for a one -time deemed repatriation of overseas corporate profits at a 10% tax rate.


Conclusion:

In short, the US stock market is back in full blown bull market with truck reenergizing things. While I feel a short-term correction is due any day, it is just that, a short-term pullback followed by higher prices into June/July.

Tuned For More Analysis and Trades at: www.ActiveTradingPartners.com

Chris Vermeulen


Why Low Risk Does Not Equate To Risk Free!

Charles Schwab has informed its’ clients that “at least 80% of the fund’s net assets will be invested solely in U.S. government securities…”.   Schwab automatically assumes that all clients affected by this change will accept: “if you are in agreement with this change in your cash feature, no response is required from you. They consider a non-response from its’ clients to be notice. “Those who disagree have the “option” of either sweeping their cash into the corporate bank exposing them to greater risk.  They add “you also have the right to close your brokerage account(s) without penalty at any time.”

Who will be the most recent owners of the rest of the current and future new debt?  The answer is:  YOU.  U.S. Mutual funds, U.S. pension funds and American investors. Why?  Because our insolvent government needs Americans to finance it before the entire house of cards come crashing down!  One’s ability to take your savings out of banks and store it in cash is coming to an end. U.S. Institutions are holding up to 99.5% of assets in cash, U.S. government securities, and repurchase agreements that are collateralized solely by the U.S. Government’s good faith.

“Debt-As-Legal-Tender”

This will make it much more difficult for one to be able to access any/all of your personal cash which was always considered to be accessible liquid risk free funds. What will American citizens do when they realize they were conned into “toxic investments” and decide to just pull their cash out of the banks and store it themselves?  If you do take possession of your savings in cash, how secure do you feel when the government comes knocking on your door asking about your stockpile of cash?  Schwab and others are taking preemptive action now to move your money into U.S. debt.

The top complaints and reviews about Schwab refusing to honor its’ clients’ money:( https://www.consumeraffairs.com/finance/schwab.html).  Fidelity is also causing the same problems for its’ clients, as well: (https://www.consumeraffairs.com/finance/fidelity.html).

This is just a new vehicle in which the U.S. Federal Government is taking control of your cash and converting it into “toxic assets” to be spread out amongst us all.  Why? The answer is to cover our enslavement of $19.9 trillion debt which is growing with each passing second.  The Current outstanding public debt of the United States is: $19,926,581,166,878.36 as of Monday, February 20th, 2017. That equates to everyone, in the United States, currently owing $65,586 which represents their share of the U.S. public debt.

chart

Public Debt: $14,403,392,566,439.40
Intragovernmental Holdings: $5,523,188,600,438.96
Total U.S. National Debt: $19,926,581,166,878.36


Who owns the public debt?

Foreign governments own the most U.S. debt.

chart1


This has been done under the auspices of the S.E.C. (Securities Exchange Commission): (http://www.investopedia.com/terms/s/sec.asp).  They implemented the New Money Fund Reform Rules”:

(https://www.sec.gov/News/PressRelease/Detail/PressRelease/1370542347679). The rules require fund providers to institute liquidity fees and suspension gates as a means of preventing a run on the fund. The requirements include asset level triggers for imposing a liquidity fee of 1% or 2%. If weekly liquid assets fall below 10% of total assets, it triggers a 1% fee. Below 30%, the fee is increased to 2%. Funds may also suspend redemptions for up to 10 business days in a 90-day period. These are the official rule changes; there are several factors investors should know about the reform and how it will affect them during its’ implementation.

The move for money market fund reform grew out of the 2007–2008 ‘financial crisis’. The Reserve Primary Fund recently settled its’ claims:( “ADDITIONAL INFORMATION REGARDING YIELD PLUS FUND-IN LIQUIDATION (Formerly known as Reserve Yield Plus Fund) DATE OF FINAL DISTRIBUTION WEDNESDAY, JUNE 15, 2016” ): (Reserve Primary Fund).  The fund had assets totaling $62 billion. The class action suit brought against them resulted in a mere $10 million settlement: http://www.usatoday.com/story/money/markets/2013/09/08/money-fund-broke-buck-deal-managers/2782931/). The 2008 financial crisis precipitated by The  Reserve Primary Fund (Reserve Primary Fund)  when it was forced to reduce its’ net asset value (NAV) of its’ money market fund below $1, due to huge losses, which were generated by failed short-term loans issued by Lehman Brothers. It was the first time a major money market fund had to break the $1 NAV which caused panic among institutional investors, who consequently began mass redemptions. The fund lost two-thirds of its’ assets within 24 hours and eventually had to suspend operations and commence liquidation.  This event prompted significant redemptions by institutional money market fund investors, putting the funds under severe financial stress.  The Reserve Primary Fund, which invested in Lehman Brothers debt, “broke the buck”: (http://www.investopedia.com/articles/mutualfund/08/money-market-break-buck.asp).

The S.E.C. Chairwoman. Mary Jo White, said “Today’s reforms fundamentally change the way that money market funds operate. They will reduce the risk of runs in money market funds and provide important new tools that will help further protect investors and the financial system. Together, this strong reform package will make our markets more resilient and enhance transparency and fairness of these products for America’s investors.”  This is what the SEC wants Americans to believe and buy into it!

The official final amendments to money market rules, which were made in 2014, for protecting shareholders from the impacts that a flood of redemptions could have on money market funds is how the S.E.C. is rationalizing this dilemma. The amendments are also intended to give fund managers enough time to respond to requests in a more thoughtful, prudent manner and in a much slower period.

  • Fidelity is converting its’ largest prime fund into a U.S. government fund. Federated is taking steps to shorten the maturities of its’ prime funds to make it easier to maintain a $1 NAV.  Vanguard is assuring its’ investors that its’ prime funds have more than enough liquidity to avoid triggering a liquidity fee or redemption suspension.

The Bank of America Corp. sold its’ money market business to BlackRock, Inc. to avoid these types of future problems.

  • Restricts who can invest in retail money market funds.
  • Continues to seek a stable $1 net asset value (NAV) for retail and government funds, but requires institutional funds to have floating NAVs like other mutual funds.
  • Allows certain funds to impose liquidity fees and temporarily suspend withdrawals (known as gates) in certain circumstances.


Gold Is Money!

Global negative interest rates have shifted the worlds’ appetite to buying gold and silver, once again. Gold and silver can sit outside the system and remain completely private. It cannot be tracked by the government or banks. Gold and silver have been the world’s greatest wealth protectors for over 5,000 years. It has shielded its’ citizens from government and banking collapses during the worst crises in history. Physical gold and silver cannot be instantly seized with the stroke of a keyboard. This is why I believe we should invest in gold and silver, before we have potentially nothing left to protect. Its two things to me: a store of untraced wealth, and an insurance policy in case something really bad happens. I like feeling financially protected and this is one way I do this.


Timing Is Everything!

The next BIG TRADE is setting up. You should take advantage of my hard work and expertise to make you short term profitable trades. Protect your financial future by getting my market and trade alert reports every week. Your portfolio should involve a proven strategy which I provide.

We have just entered a new commodity trade (UGAZ) Feb 21 as its forming a bottoming pattern. We have locked in 10% in 36 hours and hold the remaining for much larger gains. Do you want to be in the next trade of the Next Hot Stock setup?  My subscribers banked a 112% in a swing trade with NUGT (Dec 16 – Feb 8th). All the trades are based on my Momentum Reversal Method (MRM) trading system.

Another trade this month was ERX, in which we took a nice profit of 7.7% in less than 24 hours after entry.  All risks are well contained.

Follow my lead and start making money every month with www.ActiveTradingPartners.com

John Winston
Co-Author: Chris Vermeulen

Gold is setting up for a historic rally based on my analysis.  Recent news provides further evidence that the Precious Metals and Currencies are in for a wild ride.  Just this week, news that China’s reserves fell below $3 Trillion as well as the implications that the fall to near $2T in reserves could happen before the end of 2017.  Additionally, we have recent news that the EU may be under further strain with regards to Greece, the IMF and debt.  The accumulation of Precious Metals should be on everyone’s mind as well as the potential for a breakout rally.


Based on my analysis, I would estimate that near June or July 2017, Gold will be near $1315 ~ $1341 (+13% from recent lows).  This level correlates to a Fibonacci frequency that has been in place for over 3 years now.  A second Fibonacci frequency rate would put the project advancement levels, possibly closer to October/November 2017, near $1421 (+21% from recent lows).  After these levels are reached, I expect a pullback to near $1261 if the Gold rally ends near $1315~1341 or to near $1308~1309 if the Gold rally ends near $1421.  This pullback would setup a massive next wave rally to $1585 or $1731.  So, if you need confirmation of this move, just wait for any rally to end above $1315, then wait for a pullback below $1280 or $1315 and BUY.


Subscribers and followers of my work profited handsomely this month locking a 112% profit with NUGT ETF with my service at ActiveTradingPartners.


Remember, the volatility expansion I am expecting in the VIX near March/April will likely be the precursor event to a much larger volatility expansion later this year.  I can’t accurately detail the scale and scope of the projected March/April event other than it will likely be larger than the last VIX expansion.  I expect these global debt events to unravel the low volatility activity we have been seeing and shake up global markets/currencies.  Within this process, Precious Metals will likely see a massive upside run as a protection from uncertainty and risk.


GCJ17_Daily


GCJ17_Weekly


Silver Rally

Much like Gold, the other shiny metal is set for incredible runs as well.  Given my Fibonacci frequency analysis, a similar type of patter may occur in Silver.  Before we get too much further into this analysis, let me be clear about one thing.  We are already nearly +50% towards the upside rally target in Silver based on simple Fibonacci frequency.  This target is $19.10.  This does not mean this is the end of the run (yet).  It means we have already achieved some success in one level of predictive analysis and now we need to see if the second Fibonacci frequency plays out.  The second Fibonacci frequency target is $20.78 (nearly +25% from recent lows)


Much like the Gold analysis, after these levels are reached, I expect a retracement/pullback to levels that reflect the Fibonacci frequencies before a follow through rally continues.  The first Fibonacci frequency pullback range is $18.26~$17.85.  The second, larger, Fibonacci frequency pullback range is $19.50~$18.82.  Case in point, these retracement levels are based on what I can determine as common Fibonacci frequencies.  The pullbacks could be deeper and reflect more uncommon frequency functions.  As of right now, I don’t believe that will be the case – but I could be wrong on this matter.  In any event, once the rally points ($19.10 or $20.78) are reached and Silver pulls back to below my retracement objectives ($18.26~$17.85 or $19.50~$18.82 respectively), look for long entry positions or accumulate more physical metals.  Want to know what my upside “second wave” objective might be based on my frequency analysis for Silver?


Silver Charts – Daily & Weekly

SIH17_Dailly


SIH17_Weekly

Seeing as though you have been so patient in reading my analysis/article regarding these VIX cycle patterns and what I believe could happen with the US and global markets, I’m going to shed a little light into the future cycle phases of Silver.  We’ll focus on Silver for one reason, it is a cheaper precious metal for most traders to participate in and it has some very interesting facets of cycle/Fibonacci analysis.  One key date range that keeps appearing in my cycle analysis is April 17th through April 24th.


Additionally, June 26, July 31 and August 14 appear to be key cycle dates.  Given my earlier analysis, I suspect the April dates will be critical to the VIX cycle spike that I’m expecting.  It could also drive further expansion or price rotation in the Gold, Silver and OIL charts.  What is interesting about these Fibonacci Time/Price “inflection points” is that they can be drivers of many outcomes (rallies, collapses, rotations, tops or bottoms).  They simply tell us that we need to be aware of these dates and they may, and will likely, present key information for future decision making.


Now, onto the extended projections for Silver.  If my first, shorter, Fibonacci frequency is correct, any subsequent (second wave) rally will likely start near $17.85~$18.15 sometime near or after April 10, 2017.  This second phase rally will likely run to near $21.46 before finding resistance (possibly slightly higher).  Target objective date ranges for this rally to end are June 19 through July 24.


If my second, longer/larger, Fibonacci frequency analysis is correct, any subsequent (second wave) rally will likely start near $18.80  sometime near or after May 8, 2017 and run to near $24.85 before finding resistance (possibly higher).  Target objective date ranges for this rally to end are July 3 through August 7 (or later).


Remember, these second wave projections in Silver represent a 20.5% and 32.85% rally from my projected retracement levels.  These are massive moves and I hope you are all able to take advantage of these triggers.  Gold should move in somewhat similar manners – so pay attention.  Smart traders and followers of ATP newsletter may take advantage of trades to play these moves.


USD (US Dollar) and Foreign Currencies

I touched on this topic earlier, yet I feel the need to provide further documentation regarding my belief that the USD will continue to enjoy renewed strength at least for the next few months.  First, I expect the global weakness in foreign markets to continue to propel the USD and the US stock market to greater attempts at new highs.  I believe large amounts of money will keep pouring into the US markets for reasons that are obvious to most – US strength and capabilities for growth.  As I often tell my clients, if the US is growing, so is the rest of the world.  The current situation is a bit different though as the US markets and currency is, as I believe, going to be a standout marketplace in a global pot of debt and confusion.


There is one level of resistance on the USD that we have to be concerned with, the $102.25 level.  Beyond that, I believe the USD could reach $104~105 before August 2017.  The possibility that a VIX expansion could drive the USD higher would be more highly correlated if there is some external (global) event that provides a catalyst for a stronger US Dollar.  For example, a crisis in Europe, Greece or Asia that undermines expected currency valuations and results in strength in the USD.  Right now, I would put that possibility at about 50/50 given some of the news items I’m seeing and the continued fundamental strength of the US economy.

USD Daily & Weekly Charts

USD_Daily


USD_Weekly


The EURUSD relationship will continue to see downward pressure with a likely target objective near 1.035 as a first target.  This downward pressure could drive the EURUSD valuations well below this level, but I feel the potential for the EURUSD falling below the 1.00 level is still far off.  It would take a global cataclysmic event to drive the EURUSD values below PAR.  I’m not saying it could happen, but I am saying I don’t see it happening anytime soon (without a global cataclysmic event).


My Fibonacci frequency target levels for the EURUSD are 1.014 and 0.999.  As I stated, I don’t believe there is much downside risk below 0.99 unless the EU completely collapses.  I still feel the Euro will survive as a global currency near PAR with the USD.


EURUSD Daily & Weekly Charts

EURUSD_Daily


EURUSD_Weekly


Take a look at some of my recent trades to see how we’ve been able to generate profits for our valued members.

atpperffeb


I hope you have enjoyed my analysis of the VIX cycle patterns and how the relate to opportunities for all traders?  If you find this type of analysis helpful and want to take advantage of clear, concise and profitable trading signals, visit ActiveTradingPartners.com where I share even more detailed analysis and trading triggers with my members.

John Winston
Co-Author: Chris Vermeulen
www.ActiveTradingPartners.com

Here is a great video that shares the brutal truth and issues taking place today with the financial markets. Obama and Fed Chairwoman Agree as shown on video…

Obama and Fed Chairwoman Agree as shown in video…

Fast track video START AT 4:22 time where Mike shares his insights.

You can get on this special email list to learn more and to profit from this turmoil – Click Here

FAST TRACK VIDEO START AT 4:22 TIME

Get Stock & ETF Trading Signals, and Long-term Investment Portfolio Strategy
Start Profiting And Be Protected – Click Here

Subscribe to TheGoldAndOilGuy.com ETF newsletter and profit!CLICK HERE

Have you ever been presented with an opportunity and missed out on it?  Well, here is an opportunity you Do NOT want to miss out on.

Based upon my unique “Cycle Analytical” work combined with my “Proprietary Predictive Analytics Model, I can assure you that there are new highs to be made in the U.S. stock. Appling my unique metric, which are not available to the public, I can inform you that the stock markets are not overbought or overextended, at present. The market remains in a clear bullish trend!  This next new leg is very sustainable!


Technically Speaking, It Is Now Back To “Buy The Dip”:

The SPX, Dow Jones and the Nasdaq Composite all closed at new all-time highs last Friday, February 10th,2017.  The Trump Rally is just getting started according to Bloomberg.

Investors should expect that the global markets will continue their bull market run throughout the first half of 2017 rather than forming a top which leads to a bear market. “Extremes” have lost their’ meanings, at this point. The Federal Reserve has given the green light to major banks in the U.S. to raise dividends and buy back shares of their companies. The huge thrust in momentum has now returned to the four U.S. stock indexes.

Nicholas Teo of KGI Securities said that: “Ever since his victory in November, global stock markets have been steered by actions events rhetoric emanating from the new commander-in-chief”.

The trigger events show the willingness of the markets to give the Trump Administration a lot more ‘slack’ as we engage into 2017.  Billions of dollars are continuing to flow into the U.S. real estate market from Chinese nationals. They are using their offshore cash reserves to make payments on the properties they have speculated on in the U.S. There are also big-money speculators who have the sophistication needed to circumvent China’s Capital Controls.

Blackrock estimates that there is a whopping $50 trillion in cash “sitting on the sidelines”. This money has come from global central-banks, financial-firm reserves and consumer savings accounts.  Blackstone is keeping nearly one-third of its’ assets in cash. Fund managers have increased their reserves to levels that equal the highest since 2001. This means that there is a lot of liquidity with nowhere to go, but UP.

We are still in the early days of the new Trump Administration and everything seems to be going his way. President Trump’s proposed economic policies are being well received by U.S. businesses, especially Wall Street big banks. His plans are certainly positive – such as deregulation, defunding of various useless federal agencies, simplification of the tax code and lowering taxes. Many people, including some of the best money managers, in the world, are at a loss trying to figure out where to put their money, right now.  However, all that you need to do this year is to follow my lead as I strive to make profitable returns and be on the right side of all markets, and you cannot afford to miss any hugely profitable setup this year!


All of the indicators continue to suggest higher prices ahead! 

The Elliott Wave Principle is a description of how groups of people behave. It reveals that mass psychology swings from pessimism to optimism thereby creating specific and measurable patterns. In the chart below, repeating patterns in prices are displayed showing where we are located at any given time. In those repeating patterns, I can predict where we are going next.


Wave 5:

Wave 5: Wave five is the last leg in the primary direction of the dominant trend.  Wave 5 advance is caused by a small group of traders. Prices will make a new high above the top of wave 3.

 tr1


How To Make Money In 2017!

Do you trade like the professionals do? Most traders make the same mistakes – which is why they consistently lose money!  Implementing my winning strategy by receiving SMS text alerts every time we enter or close a trade is the best way to get you setup and be profitable on the same day!  Trading and focusing on my Momentum Reversal Method (MRM) and trading just the hot stocks and sectors for quick oversized gains is my expertise. Therefore, these momentum trades are moving significantly in one direction on heavy volume. The length of time for which I may hold a momentum trade depends on how quickly the trade is moving with trades lasting 3-25 days in length and we look for a7%- 35% potential gain.

Momentum traders are truly a unique group of individuals. Unlike other traders or analysts who dissect a company’s financial statements or chart patterns, a momentum trader is only concerned with stocks in the news. These stocks will be the high percentage and volume movers of the day/week.

Read more: Momentum Traders | Investopedia http://www.investopedia.com/university/introduction-stock-trader-types/momentum-traders.asp#ixzz4YY8FK9VY
On February 8th, 2017, myself and subscribers closed out our NUGT trade for a 112% profit that we entered into on December 16th.2016,

tr2

Sometimes stocks move very fast.  As I enter any new swing trades, I will immediately send out these alerts to you on your mobile device.

On February 8th, 2017, we entered the ERX at $33.00.  Right after we got into this trade, ERX, (http://etfdb.com/etf/ERX/), we were up 6% to 8% and we closed half our position.  Instantly receiving these alerts on your mobile device can make a huge difference in both time and profits as you saw in the ERX setup!  I always send out my swing trades to my members by SMS, but keep in mind most trades can be entered within a 1-3 day period as I don’t catch exact market bottoms or tops.

tr3

America Is Happy, Again!

tr4

A recent Gallup Poll reported that American’s confidence in the U.S. economy remained strong in January of 2017. Gallup’s U.S. Economic Confidence Index averaged +11, which is the highest monthly average reached in Gallup’s nine-year trend. I just came across this video that is enough to make you start thinking about changing your long term portfolio asset allocation – Watch Video Here


So, if you are looking for a simplified and highly accurate pulse on the markets, along with timely swing trades, I urge you to join my newsletter at www.ActiveTradingPartners.com.


Chris Vermeulen

Previously, I authored a “Part 1” of this article regarding my analysis of the VIX cycles.  I sincerely hope my readers enjoyed the analysis and I hope it opened up a few questions regarding the potential moves in the US and global markets.  Today, we will delve deeper into the concept of the VIX cycle patterns that I’ve identified and use common technical analysis concepts to attempt to identify price target levels as well as support and resistance that may become important in the immediate future.


For those of you that missed “VIX Cycles set to explode in March/April 2017 – Part 1”, please click on this link to review my earlier analysis.  When you are ready, the rest of this article continues my analysis.


As we had been discussing in “Part 1”, my hypothesis that a 5 month VIX cycle pattern exists and has been driving market volatility since 2015 appears to be substantiated by historical chart evidence.  The other interesting facet of this 5 month pattern is that it appears to be quickening in relation to recent activity.  I stated earlier that I believe this pattern to be a 18~22 week cycle event, but more recent VIX chart activity shows the current range may be more like 16~20 weeks.  My understanding of cycles and patterns is that within extreme, potentially violently, volatile periods, price cycles may become more frequent and velocity may become more volatile.  An example of this can be found in my long-term US major market cycle analysis below.


This image maps a major market cycle rotation process that has been in place for over 60 years.  This image starts in the late 1970s and maps TOP and BOTTOM cycling events and well as potential early and late stage cycle ranges.  When the GREEN and YELLOW levels, near the top, move above the 80% range, this starts the “Topping cycle event”.  When both of these levels fall below the 80% range, this ends the “Topping cycle event”.  The opposite is true for the BLUE and RED levels.  When both of them fall below the 20% level, this starts a “Bottoming cycle event”.  When they both leave the 20% level, this ends the “Bottoming cycle event”.  Actual price tops and bottoms can, and often do, occur within these event ranges.


US Cycle Chart

TopBottom2

Price and event cycles have been in place for centuries and correlate with other traditional forms of technical analysis easily.  For example, Elliot Wave, Fibonacci, Price Channeling and Price Patterns all relate to cycles very well.  Within this article, I’m using Price Patterns as well as Fibonacci to attempt to project and identify key target, support and resistance levels based on my understanding of the proposed VIX cycles.


Recent price expansion from the lows at $868.47, January 2016, prompted a rally to $1194.60, on April 25, 2016.  This range, $326.13, represents an expansion cycle and a Fibonacci range that we can use to determine Fibonacci cycle frequency – which may help us determine future price objectives.  After this peak, price dropped 25% of this range (a common Fibonacci level that is correlated to a real Fib value of 0.272) equaling $81.53.  Because of this narrow retracement, we should expect a potential future price move equaling 1.272%, 1.618% or 1.768% of the existing range.  XOI rallied to $1259.56 on December 12, 2016 – equating the expected 1.272% price expansion we projected and setting up for a 0.768% total range retracement.


Let’s take a look at one example – OIL (XOI)

XOI_Weekly


Last week followers, subscribers and I got long 3x long energy fund – ERX.

call


In 24 hours we locked in a 7.7% partial profit, and are now sitting with 10+% gain on the balance. This special setup I call the Momentum Reversal Method (MRM) continues to be in play and we could experience another 20-35% gain from here.


What does all this technical stuff mean? After this bounce we should expect XOI to fall back to near $976.00 before attempting any further price moves.  All of this type of Fibonacci work is conducted by understanding how Fibonacci price relationships correlate to time/price/cycle frequency functions.  Many of the best analysts of the past had detailed understandings of how these correlations work and how price would react based on larger and longer term time/price/cycle events.


Stay Tuned For Gold & Silver Forecast Next – Part 3

And Join My Newsletter for Real-Time Trade Alerts!

www.ActiveTradingPartners.com

President Donald J. Trump was elected the 45th President of the United States to preside over the largest debt collapse ever in U.S. history.  During this four-year term, he and his administration will be most feared and hated president there ever was. The odds are stacked high against his ideology of “Making America Great Again” during his term in office.


Debt deflation is a concept that was first introduced in 1933 by the economist Irving Fisher.  Debt deflation is a concept whereby the combination of high levels of debt and falling prices cause a downward spiral in the economy.  When there is deflation in an economy, those who are in debt become significantly worse off financially. Deflation causes prices and wages to fall and the value of money to rise which increases the real value of debts thereby causing it to become more difficult for people to pay off their debts, i.e.: people holding mortgages would be forced into selling their homes. However, the selling of assets only served to worsen the situation by causing prices to fall even further – creating more deflation. This affects all those people who are in debt and the cycle repeats itself exponentially. Hence, the beginning of the “Next Great Reset of 2017-2020” which should start June/July of this year.

As many Americans enter retirement, they are realizing one unfortunate fact.  The fact is that the new retirement plan means no retirement, at all, and is called the Retirement Myth.

One of the promises of the American Dream was the idea of a comfortable retirement, however, this will NOT materialize due to financial swindling and a real estate bubble. Most Americans have incurred massive debt and have consumed their future nest egg by making purchases beyond their budgets and are living beyond their means.  We are now left with over 75,000,000 ‘baby boomers’ which a large portion of them are entering retirement with very little and/or no savings. DEBT has enslaved them!

The stock market collapse of 2008 resulted from a class of “subprime mortgage bonds” going into default. Today, the triggers for our financial crisis in the U.S. are still there to cause a hiccup in a Treasury bond auction, trouble in the settlements of derivatives contracts held by major banks or default on leveraged finance loans or high-yield junk bonds. Apparently, we cannot live without debt as it has become the American Way! Your next pension check or social security check could soon be cut back or eliminated altogether, regardless of legal government guarantees. A loss such as this could be both debilitating and devastating for retirees. Global Central Banks have destroyed the financial markets.

Timing Is Everything!

The next BIG TRADE is here. You should take advantage of my hard work and expertise to help make you wealthy. Protect your financial future by tuning in every morning for my current video update on all asset classes and new trade set ups. Your future should involve a proven strategy. We have just entered a new TGAOG commodity trade which looks to be nearing its’ multi-year lows and is forming a bottoming pattern. You want to be in the next trade of the Next Hot Sector setup!

Followers of my work locked in 112% profit this week in a swing trade with NUGT, and another 7.7% in 24 hours with ERX, which we are still long a portion and expecting further gains. All the trades are based on my Momentum Reversal Method (MRM) trading system.  There are two key components of this trading strategy.
apttrrades 

You will receive NEW explosive trade setups Every Week!

Stocks & 3x ETF Trading – www.ActiveTradingPartners.com
Daily Video Analysis & ETF Signals – www.TheGoldAndOilGuy.com

Chris Vermeulen

My recent analysis of the markets has shown what I believe to be an explosion in market volatility set to starting happening between February 21, 2017 and March 30, 2017.  The historical VIX cycles have been running about 18~22 week intervals for expansion and extreme volatility levels.  The period August 2015 to January 2016 represented roughly 5 months.  The period between January 2016 to June 2016 represented roughly 5 months.  The period between June 2016 to Early November 2016 represented roughly 5 months (just a little short of 5 months in reality).


The period between November 2016 to the next volatility expansion phase, if this cycle continues, should be March/April 2107 at a target date range.

2017-calendar-1468440983V9p

How will this relate to the US major markets?  I currently believe the recent “melt-up” will stay in place until we have some catalyst that will change the direction of the markets.  In other words, the path of least resistance in the US major markets is upward right now – at least till something changes that direction/sentiment. The VIX cycles may be related to some catalyst event or external foreign market event that could change the major market directions – nut only time will tell.


VIX_Weekly


Currently, on the below DIA chart, I can state that my estimates for upside resistance is 210~212 based on historical price action.  The reason I believe these levels will become upside target objectives is based on my understanding of price rotation, expansion and contraction as well as Fibonacci ratios.  The actual number that I believe will be resistance is 211.63 and I believe this level will be reached in March 2017 or early April 2017.


DIA_Weekly


Once this critical resistance level is reached in the DIA, then all bets are off in terms of the price retracement/rotation that may occur.  Given historical price rotation as examples, I would estimate that the DIA could retrace a minimum of 6~8% ($13 to $17).  A moderate price rotation would equate to a move of 10%~13.5% ($21 to $28).  Beyond these expected levels of support, all bets are off in terms of downside potential.  The closest major downside support levels are $178.25, $170.30 and $154.35 – these levels represent a greater than 15% total price retracement and would put us dangerously close to “Bear Market Territory”.


Of course, if the VIX cycles persist as I suspect, a massive increase in volatility will drive other markets into further trending or price rotation as well.  The tech heavy NASDAQ (QQQ) has been mirroring the DIA and my projected top level is 128.15.  Currently, the QQQ is at $126.54 – only $1.65 (or 1.33%) away from my expected peak level.  After these peaks have been reached, I expect the major market to take pause and attempt to resume trending as we move closer to the volatility cycle period I suspect is driving the VIX (March/April 2017).  It is because of this that I’m issuing this warning to my members to be cautious of extended risk or exposed positions as we near the end of February 2017.  I believe the old term, “Beware the ides of March”, may be a harsh reality this year.


QQQ_Weekly


As I continue my extended analysis of the US major markets and commodity markets in relation to these VIX cycles, I will post “Part 2” of this article within a day or so.  I wanted to get this out to all my members and associates so they were brought aware of the fact that the markets are beginning a phase of volatility expansion that should not end till near April 1st, 2017.


In short, what does all this mean? Well, it means now is not the time to be adding new long equity position for long-term growth. Going forward, its going to be all about active trading and focusing on my Momentum Reversal Method (MRM) and trading just the hot stocks and sectors for quick oversized gains.


On Feb 8th, myself and subscribers closed out our NUGT trade for a 112% profit that we entered December 16th.

atp-nugt


This week we got long ERX at $33, and sold half the position 24 hours later for another quick 7.7% profit and there is still a lot of room for bigger gains there.

erxprofit

So, if you are looking for a simple and highly accurate pulse on the market along with timely swing trades I urge you to join my newsletter at www.ActiveTradingPartners.com – STAY TUNED FOR PART II…


Chris Vermeulen

Where is this economic boom that Former President Obama and his administration had taken so much credit for?


The Obama Administration, with the assistance of the Federal Reserve and Company, deliberately kept the U.S. economy from creating any growth at all.  The money that flowed from the Federal Reserve, over the last 8 years, had a direct pipeline that flowed only into Wall Street Investment Banks. The American people were sold this false bill of sale that “Quantitative Easing” was going to make lending money to “Main Street America” easier to access. They promised that there would be a boost in hiring which would, in turn, increase aggregate demand and thereby reflect a newly stimulated economic growth!


This QE effectively down-sized the middle class into minority status.  The largest growth has occurred within the low-income category.  Despite the stock market reaching near all-time highs and real estate bubbling over once again, there are now 45 million Americans on food stamps.  This number is at an all-time high.  People are feeling poorer today than ever, and with sky rocketing real-estate prices those who do not own a home cannot afford to buy anymore!


This Weeks Sector ETF Ready To Rally – Click Here

This massive disconnect is expanding exponentially. The velocity of money is the number of times that currency is turned over to purchase domestically- produced goods and services.  One can see, as in the chart below, that the velocity of money has been steadily decreasing.  There are less transactions occurring by individuals in our economy.  One can see that the money never reached “Main Street America” which is why there has not been any demand for goods and services.


fred


The average American is now barley scraping by and many do a lot of their shopping at dollar stores. Most the growth in the job market is in low wage jobs which have zero benefits! The clear majority of Americans have bought into the propaganda promoted by the controlled media outlets.


The masses bought into this propaganda as Wall Streets’ big banks kept artificially inflating the equity markets with free and cheap money, which was at the expense of U.S. taxpayers.


The Obama Machinery put on a stellar performance for the American people, however, this was a fictitious story. In fact, the real number, as of January 2017, of unemployed Americans currently stands at 22.9%: (http://www.shadowstats.com/alternate_data/unemployment-charts). The big gains have been largely allocated to the well-connected financial sector.


Corporations took advantage of low interest rates to buy back stock in their own companies. Since 2008, corporate stock buybacks have surpassed $2.2 trillion. These buy backs have only increased the price of corporate stocks and made their companies appear more valuable than they are. This means that stock prices are far above what they would be if it were not for extremely low interest rates.  The politicians believed that it was more important to create a false front and to continue the illusion so that they would remain in power.


The Tax Foundation reports that 60% of the population now receives more in government benefits than what they pay in taxes. What does this say about a society in which more than half of the population are living at the expense of the other half?  Currently, what is even worse is that the dependent class is steadily growing. The 60% will soon become 70%.


Representative Paul Ryan of Wisconsin, recently stated that “more people have a stake in the welfare state than in free enterprise. This is a road that Hayek perfectly described as the road to serfdom”: (https://en.wikipedia.org/wiki/The_Road_to_Serfdom). (http://www.economist.com/blogs/freeexchange/2014/03/keynes-and-hayek). (https://mises.org/library/road-serfdom-0).


Mr. Hayek stated that “Capitalism is the only system of economics compatible with human dignity, prosperity, and liberty. To the extent, we move away from that system, we empower the worst people in society to manage what they do not understand”.


On March 23rd, 2009, the then Treasury Secretary, Tim Geithner sent the stock markets soaring. He announced a plan to help banks unload illiquid securities of uncertain worth from its’ balance sheets. The Wall Street headlines read “Toxic-Asset Plan Sends Stocks Soaring”. Federal Reserve Chairman Ben Bernanke implemented “financial engineering” (https://en.wikipedia.org/wiki/Financial_engineering)  as the sole solution to all our financial problems.


He was publicly opposed to the nationalization (https://en.wikipedia.org/wiki/Nationalization) of banks and said “the bookkeeping problems of many banks are largely an artifact of foolish federal regulations. Capital standards, accounting rules and other regulations have made the financial sector excessively procyclical.”  As we are presently realizing, government control over the financial markets and the economy have failed us.  What we needed was the Federal Government to focus on job creation and to restructure our economy for new and future growth.


They were laser focused on merely bailing out Wall Streets’ big banks.  In my view, the Federal Government should only be focused on its’ constitutional responsibilities. Keeping the free markets out of their control and protection and serving the American people should be their primary goal.


They needed to allow deflation to play out its’ cyclical role. However, it turned out worse as they attempted to control it. Federal Government bailouts resulted in financial enslavement.  There was further unequal distribution of wealth in our society. Today, in 2017, I clearly see the implosion of America, as we once lived and knew it to be.


The economy was being run on non-to low growth policies intentionally.  President Obama deliberately took the path of doing absolutely nothing.  He did not want to be accountable for any economic growth most likely because a stock market crash would ensue. That would have placed pressure on wages that would cause inflation at which time the Federal Reserve would be forced to raise interest rates.  If this had occurred, all the free money which Wall Street investment banks received would not have been invested in the equity markets.


The GDP Annual Growth Rate in the United States merely expanded by 1.90% in the fourth quarter of 2016, over the same quarter of the previous year. A record low of -4.10% was reported in the second quarter of 2009.


fred2


They purchased their own shares back which sent stocks higher into unchartered territory. The way that they played the game was to keep inflation at bay and allow us to wallow in a deflationary contracting economy.  As stock prices rallied upwards, the corporate executives continued to receive heavy compensation on cheap cash being provided to them.  In the term that Chairwoman Yellen resides over, she has only increased interest rates twice by a mere marginal 25 basis points.  This was an immaterial rate hike so as the Federal Reserve could maintain their credibility. Increasing interest rates would have killed this game of “cheap money” which kept the wealth flowing into the top 1 percent.  The Federal Reserves’ decision to not raise interest rates during their last meeting (http://money.cnn.com/2017/02/01/news/economy/federal-reserve-january-meeting/index.html)  sends a clear and powerful message that they do not want to go down the path of normalization (http://www.discovery.org/a/23721) . They want to continue to artificially suppress interest rates. If they had attempted to “normalize”, it would create massive assets and derivative bubbles bursting domestically and globally. Either the bubble will burst or we will return to inflation.


President Trump wants to create the growth which former President Obama never accomplished. He is proposing tax cuts, introducing fiscal stimulus and removing all the red tape that has been so costly for small businesses to implement.  He has also promised to lift GDP to 4% by spending $1 trillion to rebuild America’s infrastructure.  This will overheat the economy!  Trying to implement his plans will call for deep cutbacks in Medicare and Social Security.  It will take years to forge ahead with legislative approval.


Conclusion:

Where is this economic recovery that supposedly happened?   It exists in the stock market at present as the masses are enduring a poorer quality of life!


Our subscribers are currently in a swing trade with NUGT (http://www.etf.com/NUGT)  which is up 95.8% currently and we are expecting further gains going into this week. All the trades are based on our Momentum Reversal Method (MRM) trading system. The strength of the precious metals will continue to drive gains for our NUGT position.  Expect some very interesting and exciting new trades this week.  We are getting ready for some very explosive moves.


Chris Vermeulen
Co-Author: John Winston
www.ActiveTradingPartners.com