Our recent analysis bases on a previous report of the potential for a further run in the US markets based on a number of technical and fundamental factors leads to the question of “what could happen with Gold and Silver”.  A broad US market rally may put some pressure on the metals markets initially, but, in our opinion, the increase in volatility and uncertainty will likely prompt more potential for upward price action in precious metals.


As with most things in the midst of uncertainty and transition, the US Presidential election has caused many traders to rethink positions and potential.  As foreign elections continue to play out, wild currency moves are starting to become more of a standard for volatility.  Combine this with a new US President and a repositioning of US global and local objectives and we believe we are setting up for one of the most expansive moves in recent years for the US general markets and the metals markets.  This week, alone, we have seen a flurry of action in DC and the US markets broke upward on news of the Dakota Pipeline and other Executive actions.


As we wrote week or so ago, we believe the US markets will push higher in 2017 a business investment, US strategy and foreign capital runs back into the US equity market chasing opportunity and gains.  Additionally, we believe the strength of the US market, paired with continued strength of the US Dollar, will drive a further increase in global volatility and wild swings in foreign markets.  This volatility, uncertainty and equity repositioning will likely drive Gold and Silver to continued highs throughout 2017 – possibly much longer if the new trend generates renewed follow-through.


Our belief that the US markets will continue to melt-up while certain foreign markets deteriorate relates to our belief that currency variances will become more volatile and excessive over the next few months.  This, in combination with a renewed interest in developing US economic solutions, will likely drive the US markets higher while the metals markets will continue to become a safe-haven for US and foreign investors to protect against deflation and foreign market corrections.


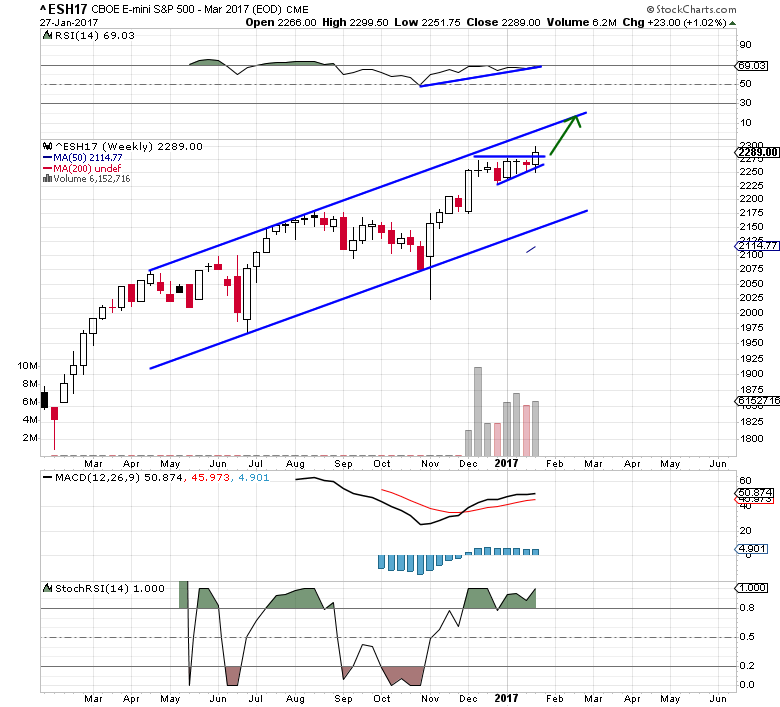
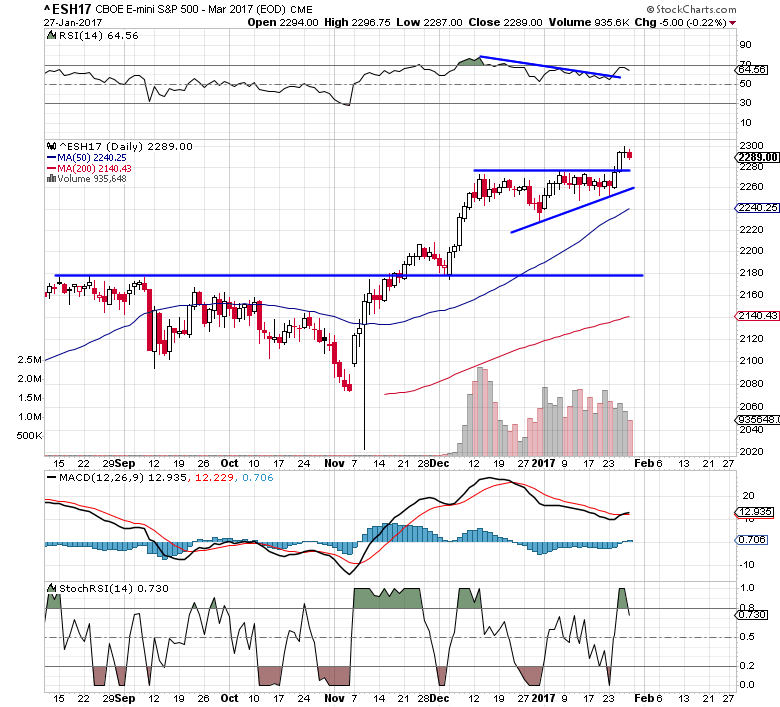
S&P Futures are setting up a clear bullish pennant/flag formation that will likely prompt an explosive price move within 2~3 weeks.  This bullish flag formation is likely to drive the ES price higher by roughly 100+ pts.  Currently, strong resistance is just above 2275, so we’ll have to wait for this level to be breached before we see any potential for a bigger price move.


SP500 Weekly Chart
ES_Weekly2


SP500 Daily Chart

ES_Daily

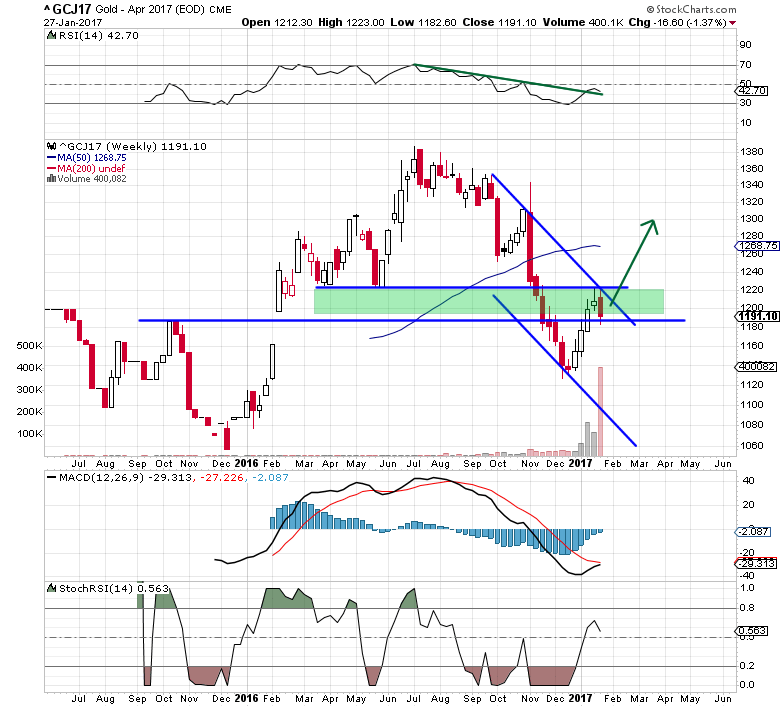
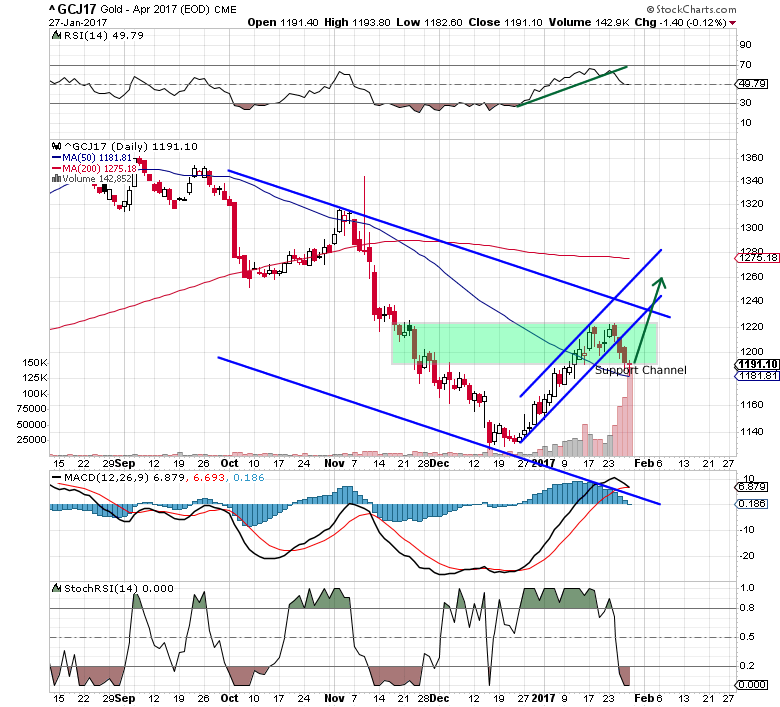
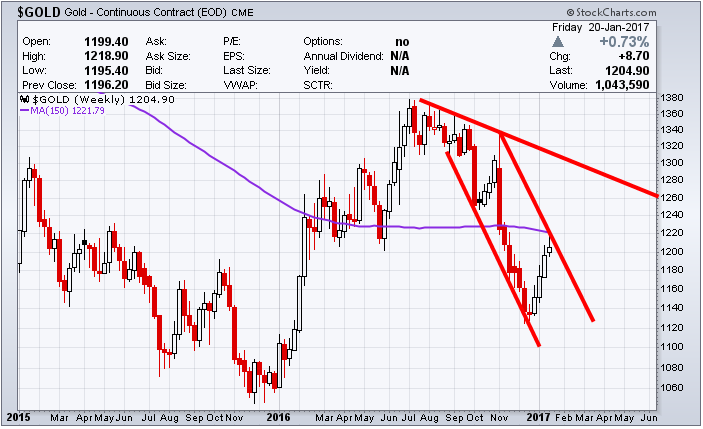
GOLD is channeling in a very clear and narrow upward price channel and trading in the middle of a support zone.  The recent reversal, near the end of 2016, was interesting because GOLD trailed lower after the US election, but then reversed course just before the new year.  The interesting fact about this move is that this new upward swing in GOLD correlates with the beginning of the Bullish Flag in the S&P Futures as well as a decrease in volatility.  We believe as this Bullish Flag will prompt a jump in volatility and price action that will result in is a strong push higher in GOLD.


GOLD Weekly Chart
GC_Weekly


Gold Daily Chart

GC_Daily2


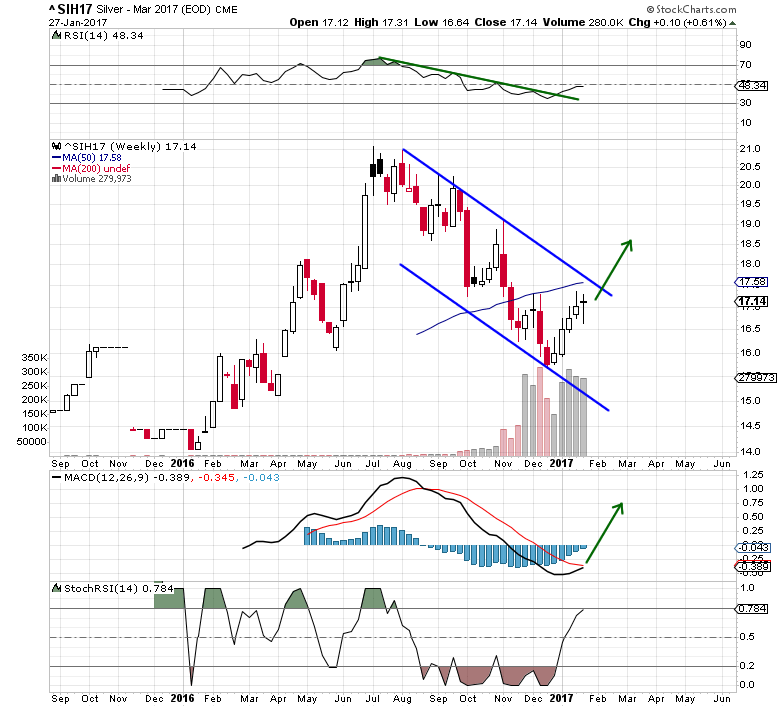
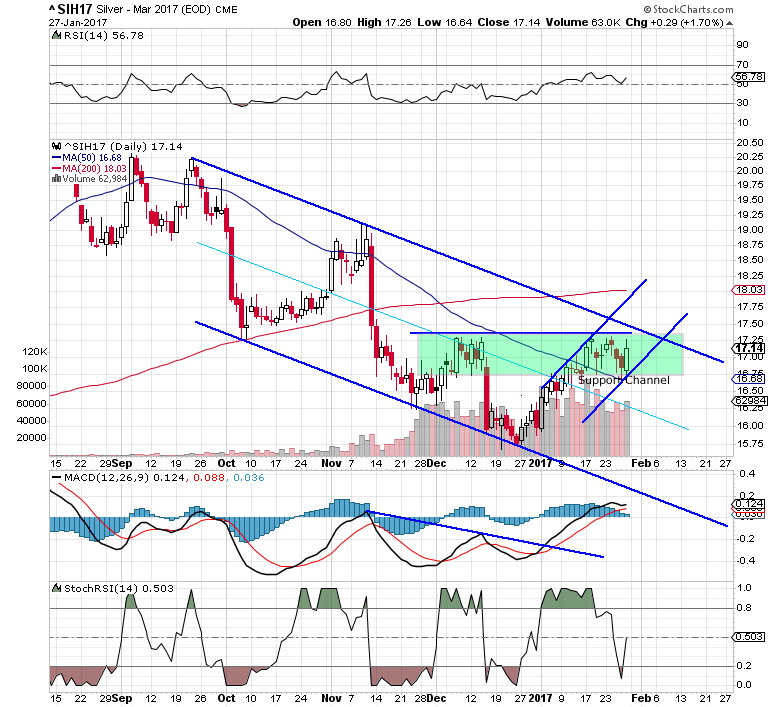
SILVER is setting up in a similar manner as GOLD.  Although the SILVER chart provides a clearer picture of the downward price channel that is about to be breached – and likely drive both SILVER and GOLD into a new bullish rally.  The support Zone in SILVER, between $16.60 ~ $17.40 is still very much in play.  SILVER will likely stay within this zone while the Bullish Flag plays out.  Yet, when the breakout begins, a move above $18.00 will be very quick and upside targets are $18.50~18.75 and $19.50~$20.00 (possibly much higher in the long run).


SILVER Weekly Chart
SI_Weekly


Silver Daily Chart
SI_Daily2


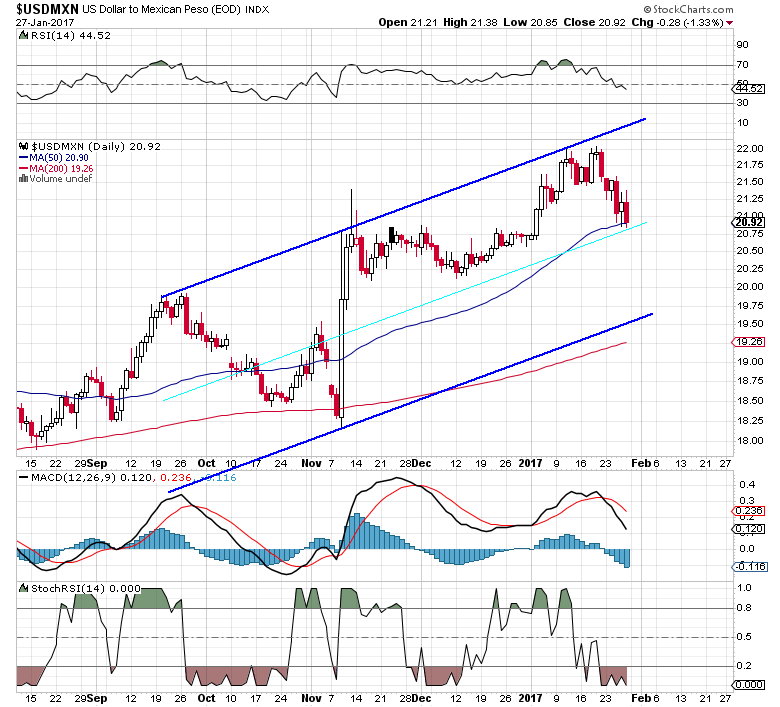
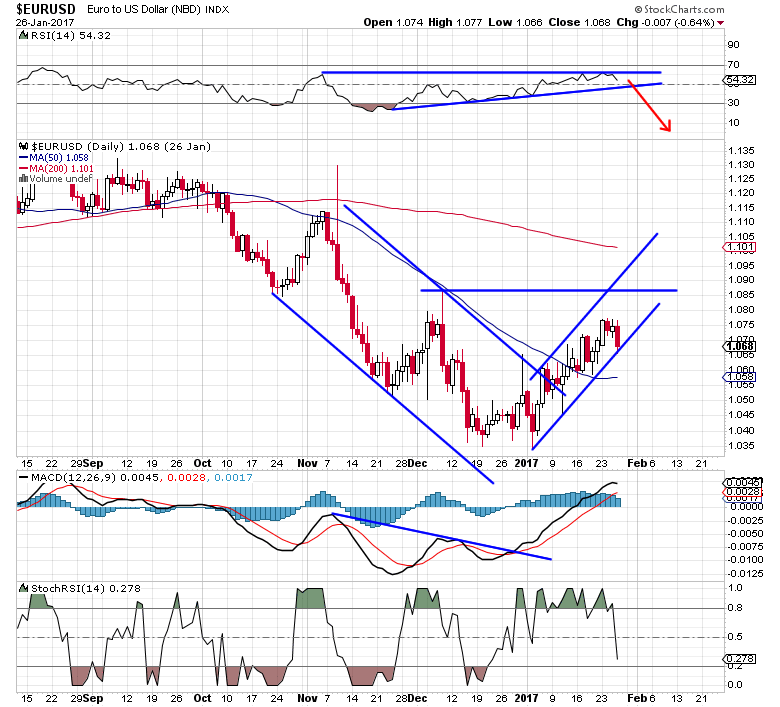
EUR/USD correlation to the US moves should be viewed as measure of strengthening US economy/USD as related to foreign market volatility and potential.  As the USD strengthens, this puts pressure on foreign governments and global transactions based in USD.  This also puts pressure on the METALS markets because billions of people around the globe consume precious metals as a “safe-haven” related to currency volatility.  We expect the EUR/USD levels to fall near “parity” (1.00) again and possibly dip below parity based on future foreign election results.  This volatility and uncertainty will translate to increased opportunity for GOLD and SILVER to run much higher over the next few months.


EURUSD Daily Chart

EUR_Daily2


USDMXN Daily Chart

USDMXN  

USDGBP Daily Chart

USDGBP


Right now is a fantastic opportunity to take advantage of these lower prices.  We may see rotation near to the lower support zone levels as price rotates over the next few weeks.  The key to any trade in the metals market is to understand the potential moves and watch for confluence and volatility in other markets.  We believe the next few weeks/months will be very telling.  If we are correct, we’ll see new highs in the US markets fairly quickly and we’ll see a new potential bullish breakout in GOLD and SILVER.

You can follow our weekly analysis and trade ideas at www.TheMarketTrendForecast.com

Chris Vermeulen & John Winston

Gold to Regain Its Gleam!

One question that gold investors are asking now is, will 2017 be as spectacular for the yellow metal as it was in 2016? The short and sweet answer to this is YES.

The dollar, gold and the major U.S. stock exchanges will all see new highs. Gold is currently in a “complex corrective correction” while experiencing its’ last pullback, beforehand.

Both the short-term outlook and the long-term outlook for gold is BULLISH!  Trumps’ victory win is a positive for gold bulls. Policy uncertainty and slowing growth, following a Trump win, will stoke the yellow metals’ price in 2017.

Gold prices have been under pressure since the Trump victory, but the long-term scenario for gold is that it is parabolic. The global economy is still in contraction. Global Center Bankers continue with monetary easing, leading to currency debasement. Interest rates continue to slide into negative territory in Europe and Asia.  Gold’s investment appeal will encounter a period of time before it generates positive yields. Gold, as an investment, will once again be back in vogue. As prices rally, investment demand will only rise further, taking everyone by surprise.

The demand for gold jewelry has been declining within the large gold-consuming nations. The gold investors will call the shots in this new ‘bull’ market of gold.  Current supply constraint has cushioned gold prices from the rally in the U. S. dollar.

This is the last great buying opportunity for gold before it makes its’ next historic run in 2017 and beyond.


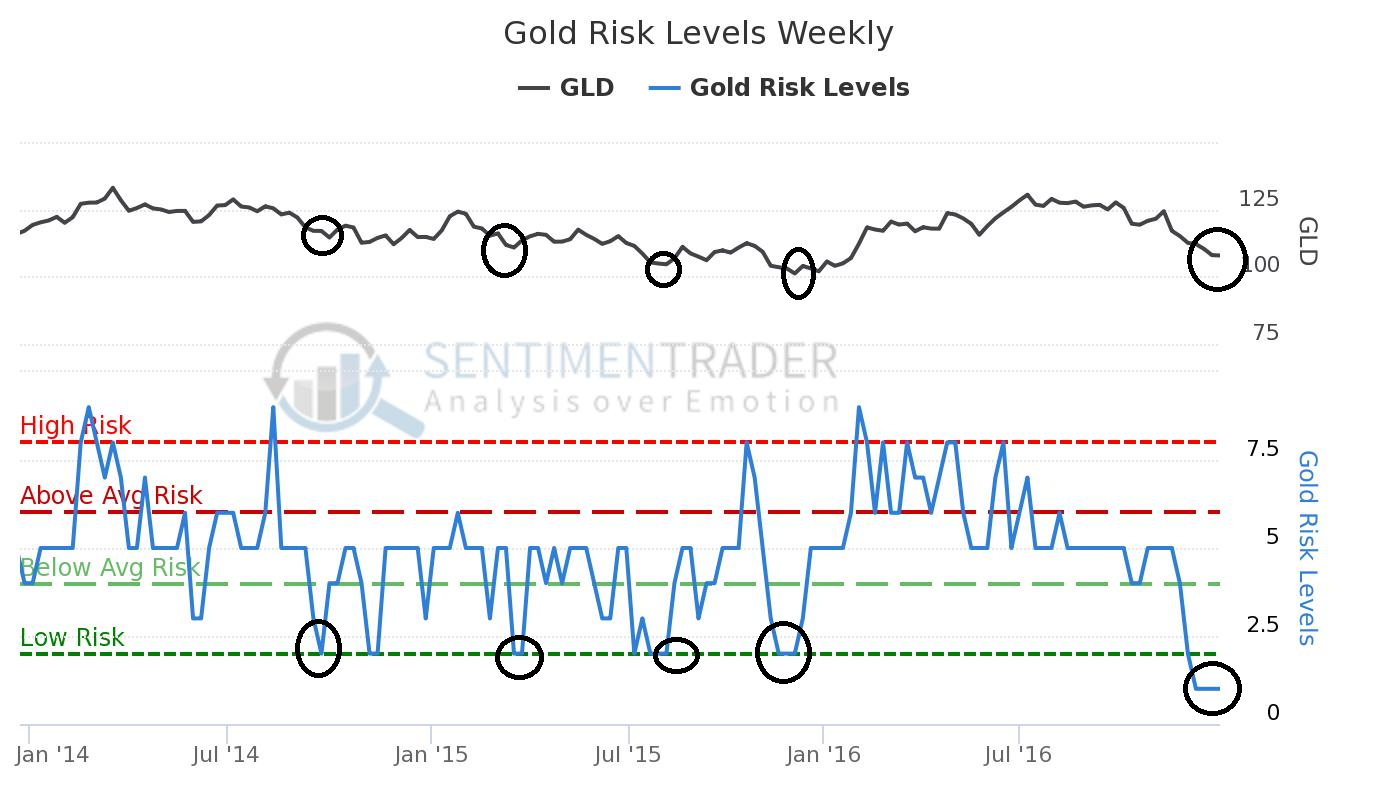
Excessive Pessimism: 2.0
THIS IS WHEN THE BEST OPPORTUNITY TO BUY GOLD IS PRESENTED

Latest Value(s):

– Last Reading: 1.0

– Extreme Values:

– Excessive Optimism: 8.0

gr1


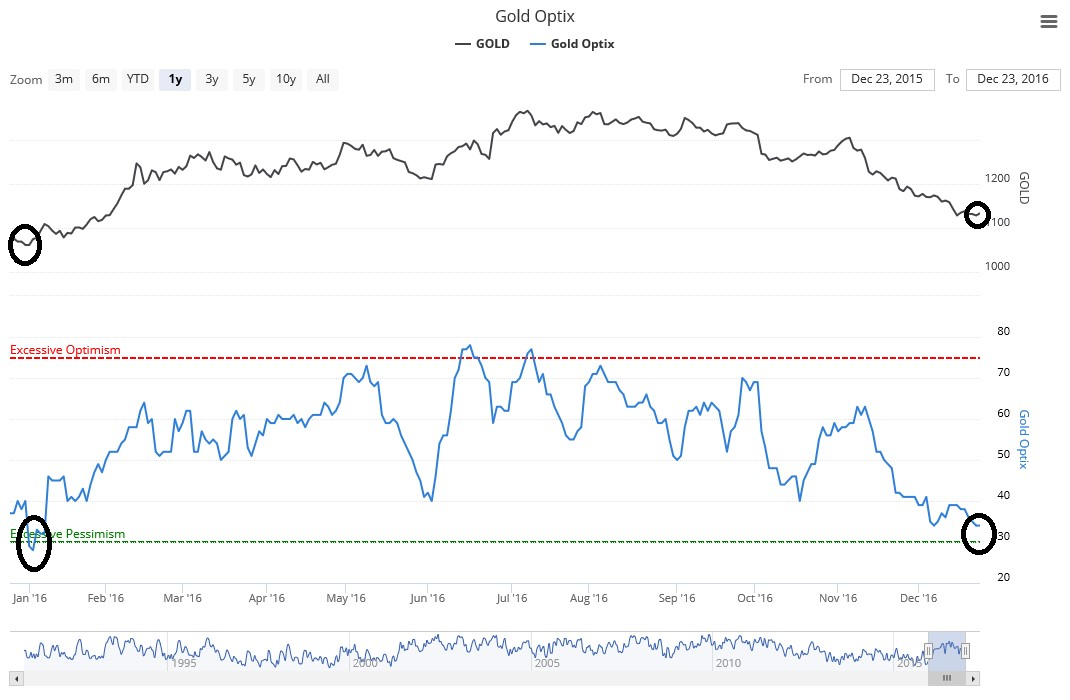
Excessive Pessimism: 30:
THIS IS WHEN THE BEST OPPORTUNITY TO BUY GOLD IS PRESENTED

Latest Value(s):

– Last Reading: 34.0

– Extreme Values:

– Excessive Optimism: 75.0

– Excessive Pessimism: 30.0

gr2


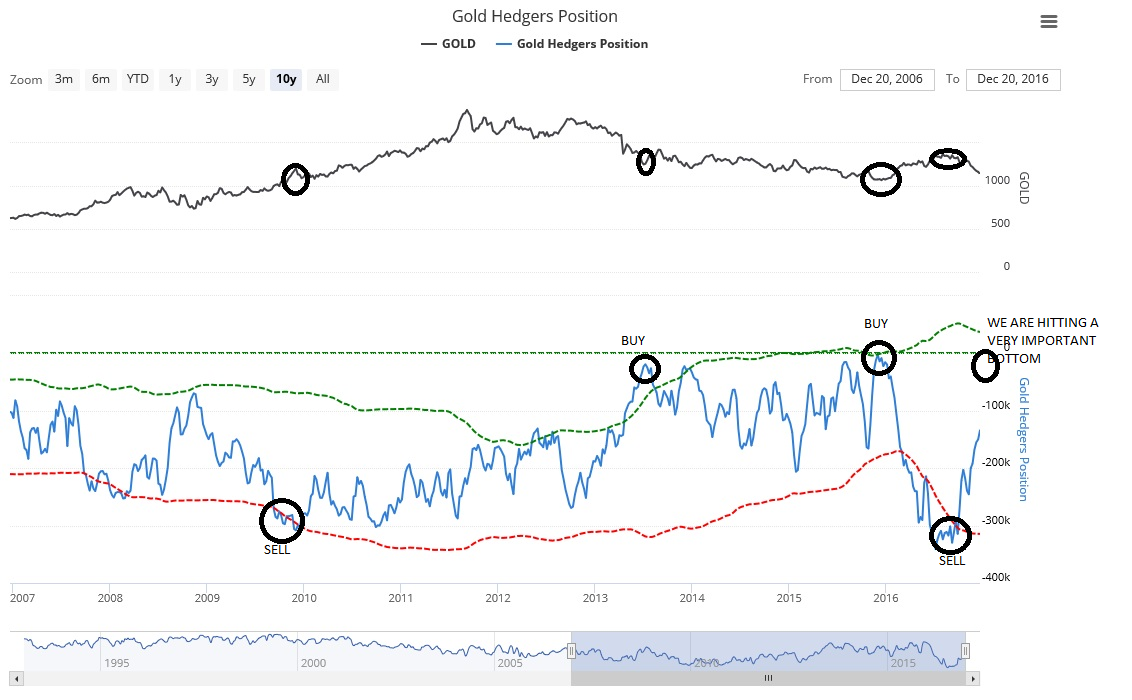
Gold Hedgers Positions

Latest Value(s):

– Last Reading: -134022.0

Extreme Values:

The green dotted line is 1 standard deviation above the 3-year average;
the red dotted line is 1 standard deviation below the 3-year average.

gr3


The Drivers!

A key factor that has driven investments in gold is the negative interest rate in Europe, Japan, Denmark, Sweden, and Switzerland. The sovereign debt of approximately one third of the developed countries traded with a negative yield while an additional 40% of the countries had yields below 1%.

Gold prices will be driven more by its’ value as an ‘investment asset class’. Gold will supersede investments in other ‘asset classes’ such as equity and bonds in due time.

The massive U.S. debt continues to spiral out of control. The Treasury Department’s printing presses are cranking out hundreds of billions of dollars in new money. European countries are imploding financially and the entire European Union is at risk of a collapse.  These ‘geopolitical’ factors will be driving the demand for gold as a ‘safe haven”.

The global ‘retail’ investment market is well positioned for growth what with demand for gold in China, India, Germany and the U.S. for 2017.

Social media is a ‘key driver’ which is critical in both China and India. Financial advisors and financial websites are the key drivers in the U.S. markets. In Germany, banks play the most important influence; ‘Protect wealth against the system’.  It has a competitive advantage compared to other investment options.


Jordan Eliseo, Chief Economist at precious-metals dealer ABC Bullion, says “Gold retreated about 18 percent from its year-to-date high. Afterward, it gained 26 percent in the first half of 2016.  The decline so far, this year has been about 15 percent from its year-to-date high.  Gold, is setting up for another rally in fashion like last year. The recent correction has already drawing in some investors to buy what they see as cheap metal.”


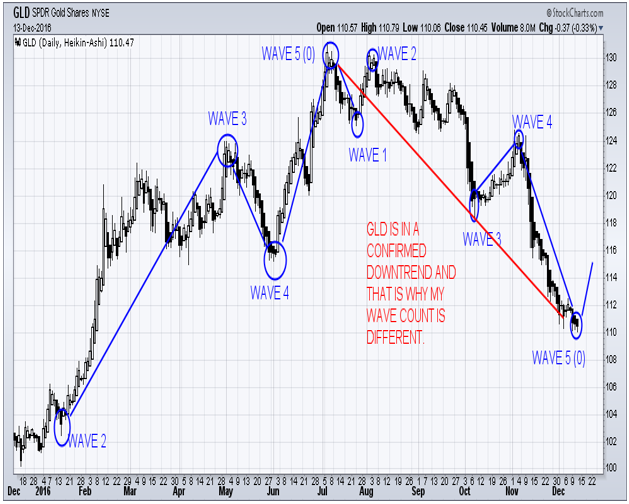
On December 14th my trading partner accurately forecasted the recent bottom in gold which you can see in this gold market forecast.

December 14th Forecast chart:

gr4

He then took things a step further and entered into a NUGT (3x long gold miners ETF) with subscribers and recently locked in 50% profit on the first half and is up over 70% on the balance as of Fridays closing price.


GOLD WEEKLY CHART REMAINS IN DOWNTREND

The constructing on this new infrastructure is going to require a lot of new money. The country is already close to $20 trillion in debt, so if the administration plans to make this one of their priorities, it is going to have to print it.

gr5


‘THE GREAT RESET’

Nixon closed the gold window on August 15th, 1971 and consequently, the world entered a new era.  For the first time in history, all the world’s monies were unbacked fiat currencies, adrift on a sea of floating exchange rates.  This stopped the redemption of currency for gold. Today, gold reserves are nothing more than an asset listed on the FEDS’ balance sheet.  Gold had stopped being an integral part of our financial monetary system

At the top of international commerce, money managers had always known the dangers of ‘currency risk’, but now every currency has become a ‘soft currency’. Recognition of ‘currency risk’ seeped down into the knowledge chain, but on the street of personal financial management, despite it being 45 years later, not many have caught on to the concept.


To Live And/Or Continue Living the American Dream

Golds’ strength is in the role of ‘wealth protection’. It is a ‘safehaven’ and its ‘independence’ from the global financial system makes it a great investment for the future. Gold is still good value for those who do not own any to accumulate ounces.

In a few days, I will be publishing a piece talking about the shift in the economy and what I call “The Great Transfer of Wealth”. Be sure to join my free newsletter below to receive this special report!

Chris Vermeulen
www.TheGoldAndOilGuy.com

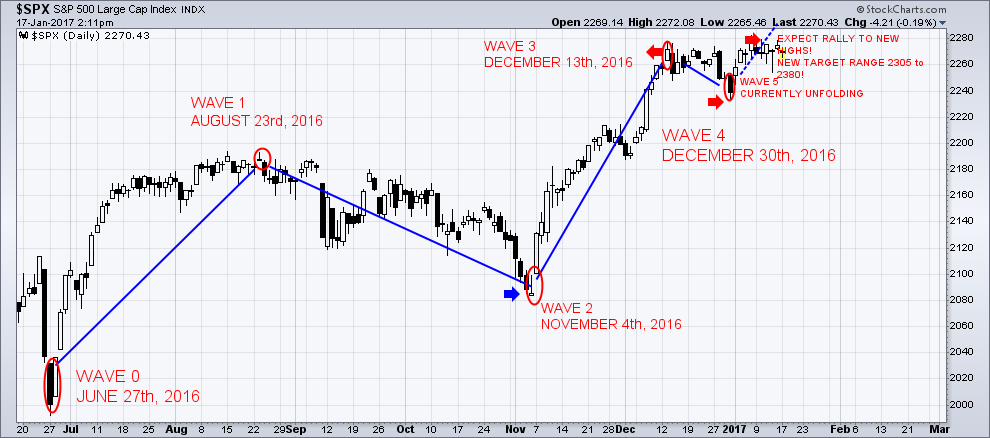
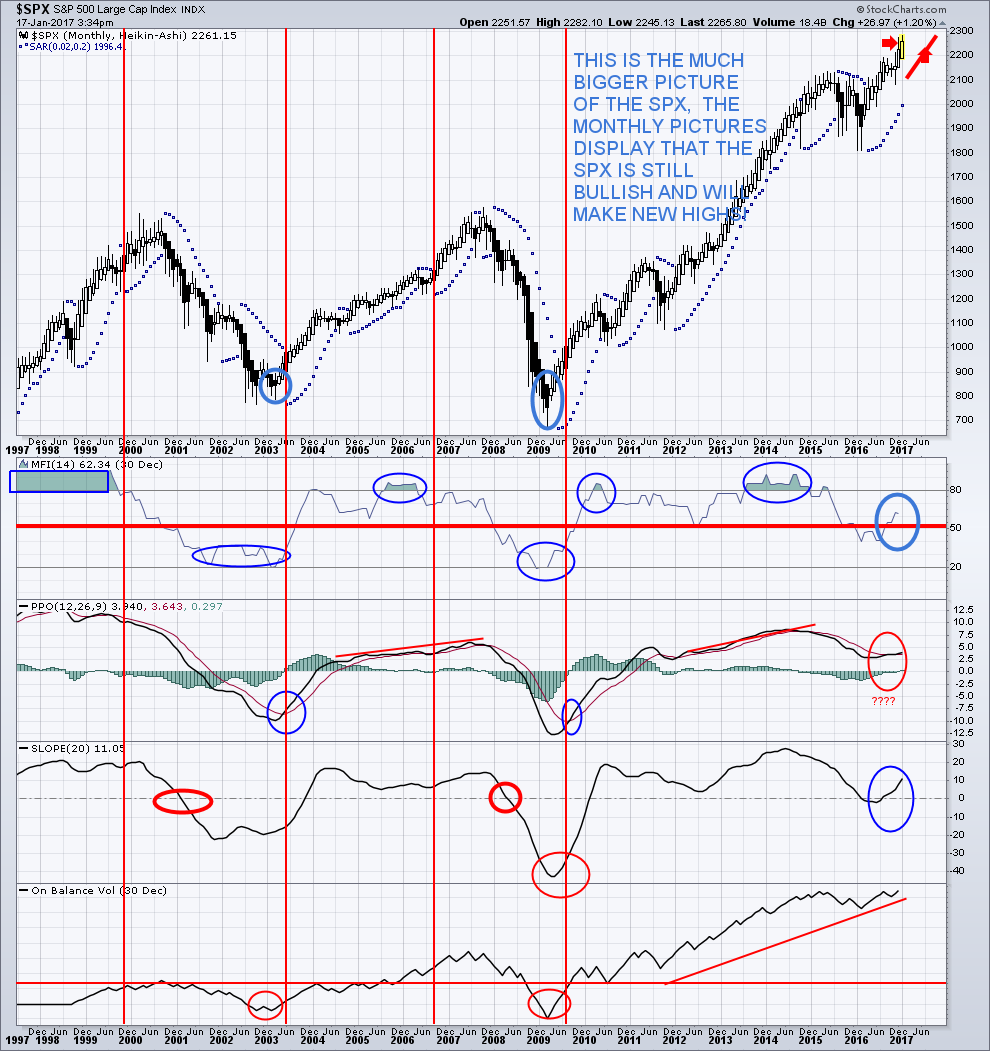
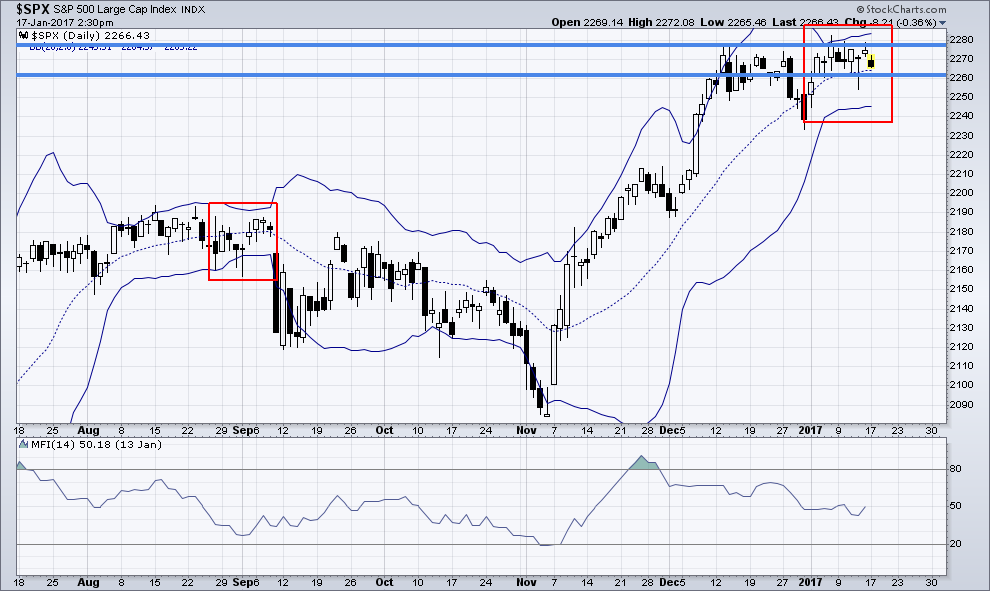
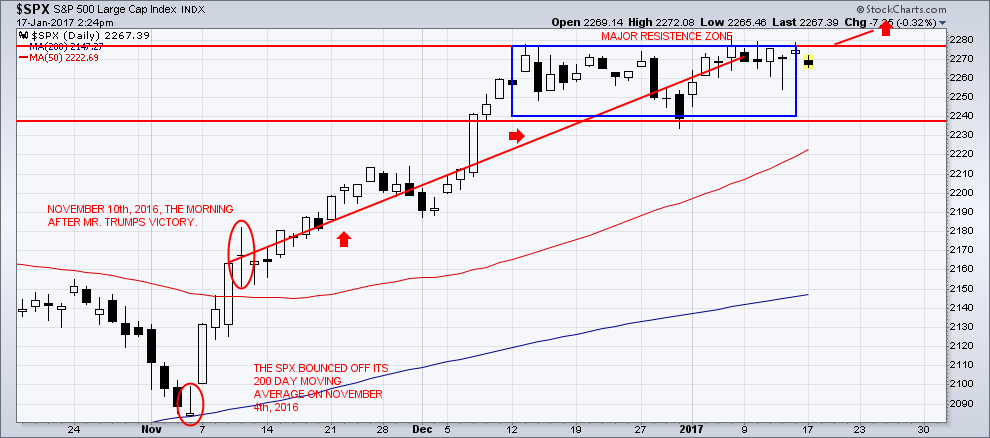
When the SPX breaks out above its’ current resistance level, it will be the next leg up in this bull market. We are currently in a consolidation period. The SPX seems to be resting for now!  The “Bollinger Bands Squeeze” is now taking hold and will result in a powerful move in either direction once broken.  I do have a new BULLISH trigger for members to enter into during this amazing “melt up” that will only be shared with my ‘elite members’.   I can assure you that you will want to be invested in this next BULLISH leg of the SPX!


The Next Move UP!

j201

j202


‘Bollinger Bands’ are one of my most preferred tools of technical indicators:

The “Squeeze”,(http://www.investopedia.com/articles/technical/04/030304.asp?lgl=bt1tn-baseline-below-textnote)  occurs during low levels of volatility as the ‘Bollinger Bands’ narrow. These periods of low volatility are followed by periods of high volatility. Therefore, a volatility contraction of the bands can foreshadow a significant advance or decline.  This is one of my best kept secrets of technical analysis, until now!

j203


Financial markets are now awaiting what the new Trump Administration has in store. These markets do not like “uncertainty”. So far, President-elect Trump has announced a direction of deregulation and lowering the tax bracket for corporations and repatriation of all corporate money (http://www.investopedia.com/terms/r/repatriation.asp) that is held overseas in foreign bank accounts.

The ‘ISI Research Study’ revealed that the “U.S. S&P 500 companies now have $1.9 trillion parked outside the country”.  Most likely, said funds will be applied so as to continue the stock buyback program thereby pushing the SPX to new levels that are ridiculously overpriced. Hot money ‘continues to be supporting the rise in equity markets. I share some of these hot money sectors and stock on my StockCharts.com public list!


Trump’s Victory Speech on November 9th, 2016:

“We are going to fix our inner cities and rebuild our highways, bridges, tunnels, airports, schools, hospitals. We’re going to rebuild our infrastructure, which will become, by the way, second to none. And we will put millions of our people to work as we rebuild it. We will also finally take care of our great veterans”.


Chart of the SPX “melt-up’:

j204

Are there too many happy investors?

The U.S. stock markets have been on a run since the U.S. Presidential election last November 9th, 2016.

U.S. stocks continue to see signs of “optimistic extremes”. The risk of buying on emotional decisions is still currently high.

There is no interest in shorting. The number of shares sold short, in hopes of buying them back at a lower price, has collapsed. The SPY fund (https://us.spdrs.com/en/product/fund.seam?ticker=SPY), short interest is the lowest since the summer of 2007.  Individual stocks are also showing a lack of short sales which, in turn, removes a pool of potential buying interest. A “de-trended” version of the short interest ratio has dropped to a level that has led to negative returns for stocks which will happen, but likely not for many month yet. The market is likely to grinding higher before a big correction takes place.

A new high presented itself on a day that the jobs report missed expectations. On January 6th, 2017, the jobs report came in less than what economists’ expectations were.  However, the SPX powered to a new high of 2276.06.  This may seem like good news, but during prior times that this occurred, stocks usually pulled back over the following weeks.

Stocks have drifted higher even after optimism reached an extreme. ‘Dumb Money Confidence’ exceeded 80% but the SPX has added on more gains without any kind of pullback. This type of buying pressure, after an extreme optimism sentiment, has previously occurred only a handful of times. It has usually led to losses as the late buyers became “exhausted”.


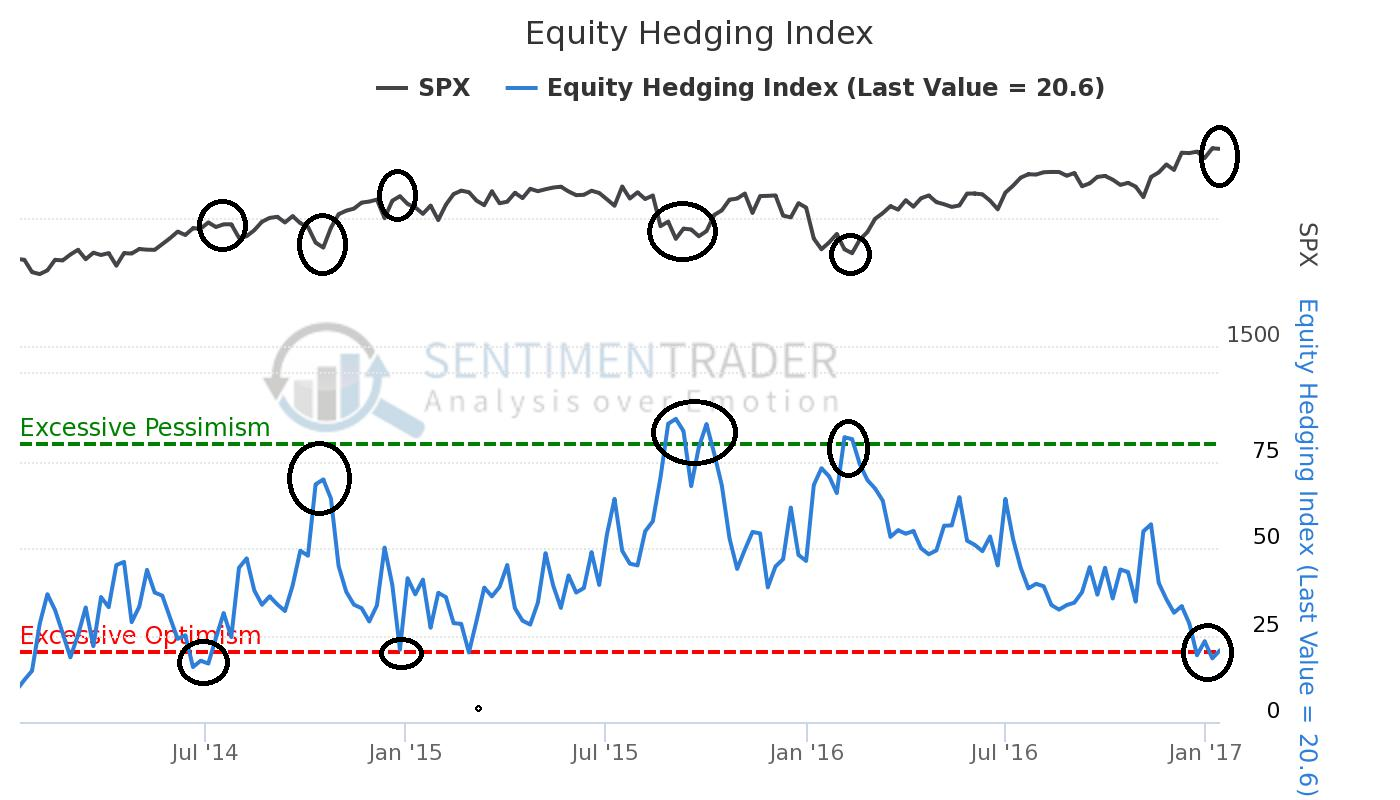
Investor confidence is so High they see no need to hedge their positions:

The Equity Hedging Index has declined to its’ lowest level in nearly two years, showing a lack of interest in the various ways that investors use to protect themselves from possible market declines.

j205

This chart is a contrary indicator. The higher the Equity Hedging Index, the more likely it is that stocks will rally going forward.  The lower the Equity Hedging Index, the less likely that stocks will rally.


                                                                                                              Conclusion:

Hopefully, Trump’s business experience will translate well into his new position. It is certainly my hope that he is as successful as possible. Even during the campaign Trump spoke about how stocks were in a giant ‘bubble’.  This euphoria that we have felt, since his election victory, has made that ‘bubble’ even larger. Throughout U.S. history, every ‘giant financial bubble’ has always ended very badly, and this time around will not be an exception. Trump may get the blame for it when it bursts, but the truth is that the conditions for the coming crisis have been building for a very, very long time.

I expect the stock market to stall out mid way this year in June/July at which point things could turn south. If you want to follow me live at StockTwits.com

Join my free trading newsletter at www.TheGoldAndOilGuy.com

Chris Vermeulen

One of the key tenants of my Momentum Reversal trading is “waiting for the right trigger/event and getting in early”. I find this is one of the most difficult aspects for most clients to understand and master. Therefore, in an attempt to further illustrate some components of my thinking and strategy, I have put together these examples to try to help people understand these techniques.

Within this example, I’ve selected Chesapeake Energy Corp and a recent price move that resulted in strong gains. As you are well aware, within the Momentum Reversal Method (MRM) are a number of key factors that drive my investment methodology.


details1


Additionally, I use Fibonacci and Elliot Wave Theory in all of my analysis and decision making. The Momentum Reversal Method is not foolproof – it does take some losing trades. Generally, though, the winners far outpace the losers. My trading strategy helps to answer these important questions.


details2


Now, onto the setup I promised earlier – Chesapeake Energy Corp.

This chart illustrates three key components to my Momentum Reversal Method trading strategy:

– Established Price Momentum/Trend
– Defined Price Rotation
– Tightening/Coiling of price prior to a breakout

As you can see from the example chart, above, the upward price trend (highlighted in green) followed by the price rotation (highlighted in red) created a primary setup that allowed me to target this stock for potential trigger setups. In other words, this price momentum and rotation created an opportunity for trade signals.

The coiling of price with the flag/pennant formation created another component I often look for – price congestion. Price congestion following a wide range price rotation is usually indicative of a “pre-breakout move”. Therefore, the identification of this type of price action can sometimes be an early warning to watch it more closely for the trade trigger.

I’ve marked the initial breakout bar (not my ideal trade trigger) with a green up arrow. For the average trader, this would likely be your trading trigger. Within the Momentum Reversal Method, we look for early triggers that can allow us to get into these types of trades earlier – and often with much less risk and greater chance of success.

I hope this clear example of a MRM setup can assist you in understanding why this strategy is such a success.


chk1


The Outcome

This, the outcome of the Setup, shows exactly how quickly these setups can turn into profits. Generally, the Momentum Reversal Method holds trades for 3~7 days for short-term trades and for 14~35 days for longer term trades (in some cases even a bit longer).

You may be wondering why we only hold trades for 3-7 days? The answer is simple, we know that most of the biggest moves happen in a very short period of time. The explosive pops/drops in price only last 3-7 days in most cases. Catching these quick explosive moves provide us with the best risk reward. As you know time is money, and it only makes sense to make as much as possible in the shortest period of time, which has two key benefits:

First is that I provide lower risk. The less time our money is locked into a trade/the markets the better as cash is king!

Second, it means we can rotate some of some/or all of our money into the next stock/leveraged ETF ready for its explosive pop/drop.

You can see from this image the first upward move from the trigger bar resulted in a +27.8% gain in only 10 trading days. The second phase run-up in price resulted in an +83.75% gain in an additional 29 days. Clean, Clear and Consistent.


chk2


Again, I’m not giving away my successful strategy to anyone. The Momentum Reversal Method has worked for me for years and continues to generate fantastic results. Even if I tried to teach you every aspect of this trading methodology/strategy, you would still need my assistance in understanding the nuances of how to deploy it and how to better understand general market sector rotation, when to avoid false triggers and what you should and should not trade and when.

This article is to help illustrate why the Momentum Reversal Method is a success and to teach you some of the basic concepts of Momentum Reversal triggers. My followers receive detailed analysis, research and trading triggers from my member based trading room. I can provide a source of valuable and timely trading triggers and follow-up research regarding all activity I announce to my clients. A few of our recent trades have been VUZI 16%, UGAZ 74%, and last week NUGT 50% on a portion and we are up over 75% on the balance which could be 100% by the end of week. The NUGT trade was partially based of a Market Trend Forecast we published back in December.

Feel free to visit www.ActiveTradingPartners.com to see how easy it is to profit from my analysis and to see how well the Momentum Reversal Method works in real-time.

I sincerely hope you enjoyed this article and were able to see how you can improve your future trading successes by using some of these components.

John Winston & Chris Vermeulen
TheTechnicalTraders.com

Chris Vermeulen is a very savvy trader and even he was taken by surprise by the stock market’s Trump rally. Especially by its strength and ferocity and he sees no immediate end in site. It could go on and on. But it won’t necessarily be bad for commodities and precious metals. He’s seeing very bullish signs in those markets as well. So are we living in the best of all possible worlds?

listen-live-button

Trade Alerts @ www.ActiveTradingPartners.com & www.TheGoldAndOilGuy.com

Massive VIX Warning for all Traders

My analysis of the recent VIX action is clearly warning of a potentially massive price volatility increase in the US and global markets.  Many traders use and trade the VIX as a measurement of volatility.  The VIX is a measurement of the expected market volatility over the next 30 days.  As the VIX rises, traders expect larger and more volatile price swings.  As the VIX declines, traders expect smaller and more narrow price swings.


Currently, the VIX is near historical low levels and has recently past a critical cycle midpoint.

stock-reversals1

One can see from my cycle analysis, I am tracking to cycle events; a longer term top-to-top cycle event and a smaller bottom-to-top cycle event.  I call these dual-phase and single-phase cycle events, respectively.


This analysis tells me we recently past a single-phase bottom cycle (near Nov 30th) and are expecting a dual-phase top cycle event near Feb 17th.  Given the expected opportunity to retest the VIX high channel, the potential price move in the SSO would relate to a 11%~16.5% price swing (approx) – or larger.  The dark blue downward VIX channel is a boundary that we would expect the VIX move to attempt to reach.  It could blow past this level and develop a much larger price correction in the US and Global markets but lets just focus on one target at a time for now.


Now, let’s take a look as how this relates on the SSO chart.


On the below SSO chart, I have highlighted the critical VIX “Peak” levels with rectangles and I have drawn the VIX Single and Dual phase event cycles.  You can clearly see how these event cycles align with critical price swings and, most recently (after the US election cycle) correlated with a cycle event low and high.


stock-reverals-2

On the hard-right edge of the chart, I have drawn what I believe will be the likely VIX cycle event target range and target date range.  I expect the VIX to increase moderately over in the next week or so and explode as stock prices rotate lower.  I expect the US and global markets to react to these time cycles and for an increase in volatility. The chart shows a sharp correction as that is the max potential, but we could only see a 2-5 day dip before it heads higher. Either way volatility should jump soon and I plan to get involved with an ETF.


Our last few ETF trades generated some big profits with EDZ 20.7%, NUGT 11%, and UGAZ 74% return. I feel the VIX is starting to show signs of an opportunity unfolding.


Join www.ActiveTradingPartners.com to stay up to date with my analysis and learn how to take advantage of my weekly stock picks and market forecasts as we gear up for another incredible year of trading!


Chris Vermeulen & John Winston
Investment Strategists

Join TheGoldAndOilGuy Trading Signal Newsletter Today!

CLICK HERE