The Federal Reserve Bank has printed trillions of dollars to monetize US government debt just to keep the government afloat.  Any significant rise in interest rates will probably decimate US government finances, the fragile housing market and in the bond market it will cause a financial catastrophe through interest rate derivatives.


This is a solid reason why the Fed will not raise any rates in any foreseeable future.


The power to create money out of thin air is great!  Should we give it to politicians and secretive central bankers? Will this power be abused? Will those in charge yield to the temptation for “legalized counterfeiting?”  Apparently the answer is YES.


All that the Federal Reserve has done was to inflate equity markets. They never solved any of the original financial problems that lead to creating “The Credit Bubble of 2007”.  There was as well no financial resolution by our elected political officials to resolve this serious problem so that it would never occur again in the near future.   This process called “Quantitative Easing” created a shift of a tremendous amount of wealth from the middle class and the poor to the rich.


Inflated stock prices, usually held by the wealthy, created a clear “redistribution of wealth” which will be paid for by future generations to come. The concept by the Fed was that centralizing the wealth would help in creating new jobs and increase capital expenditures in their businesses.


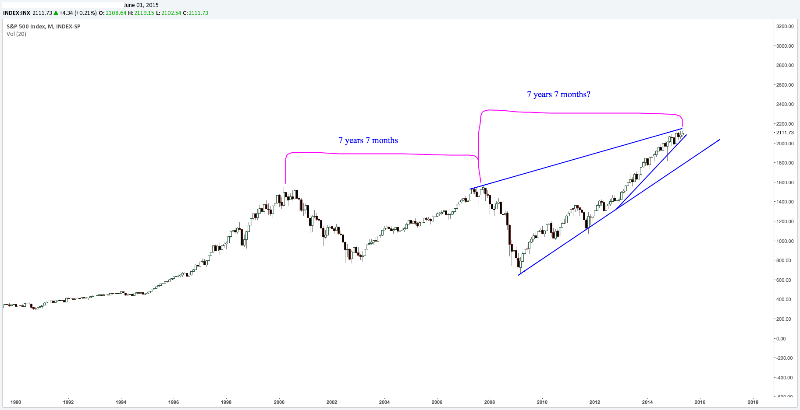
The problem with this philosophy is that it never filtered down from the Billionaires into real economic growth within our economy. Instead, rather than experience expansion, we have been experiencing contraction which is resulting into an economic deflationary depression that will appear evident to all by the end of this year.


The top 1% of Americans hold 35% of the nation’s wealth. This inequality has continued to grow exponentially.


There are several reason that I can refer to why the Fed will NOT raise rates anytime in the near future. There are interest rate cuts and devaluations going on all around the world at the moment. Japan and the Eurozone are both implementing Quantitative Easing.  China is resorting to its alternatives to hold its financial system together and stave off a hard landing. Emerging market economies are being hammered by commodity price falls, while oil producers are being similarly hit by oil price falls.  There is no Inflation in developed countries.  The world is entering a deflationary slump.  Why would the Fed ever even think about raising interest rates???


The unwinding of QE will have many negative effects in a market that is already short of liquidity. So, the unwinding that must be delayed for quite some time will be welcomed by many. The unwinding of QE purchases and the normalization of bond prices would be extremely negative for the bond markets, so the tin can will be kicked down the road for quite some time still.


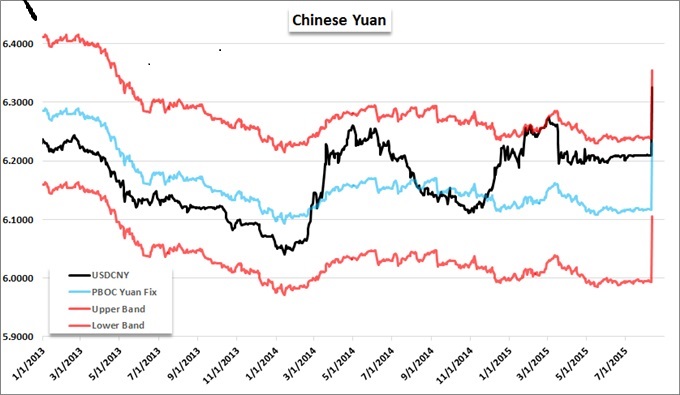
The PBOC has significant room to lower required reserve ratios on banks to encourage lending. Even after a series of cuts, the RRR remains at 18.5 percent for major banks which is among the world’s highest. Reducing the ratio by 10 percentage points would free up 13 trillion yuan ($2.1 trillion) of additional capacity for banks to lend. On the fiscal policy side, the country’s $3.69 trillion of foreign-exchange reserves and relatively low national government debt levels mean it has the ammunition for fiscal stimulus. China is planning at least 1 trillion yuan ($161 billion) in long-term bonds to fund construction projects as the economy struggles. Most of the interest payments on the bonds will be subsidized by the central government. I believe that more projects of this type will be initiated in 2015.   This is a major factor why the Federal Reserve will continue pumping liquidity in the financial system.


I believe that the FOMC minutes suggest that it is very far from a rate hike, the US economy is more likely to see QE4 first!


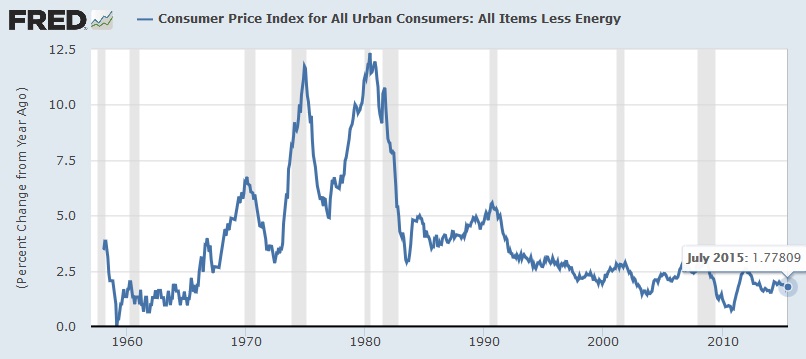
In short, there is no reason to believe that core inflation will rise to the 2% target any time soon and raising interest rates at the moment would jeopardize the US’s fragile recovery.


CPI Continues To Decline
CPI 2015-08-19E


The FOMC members gave the following reasons for caution:

  • Wages aren’t rising much
  • Prices aren’t rising much either
  • The dollar is strengthening
  • Commodity prices are falling
  • Economic growth is still pretty weak
  • The labor market isn’t as strong as the unemployment figures suggest

In Conclusion:
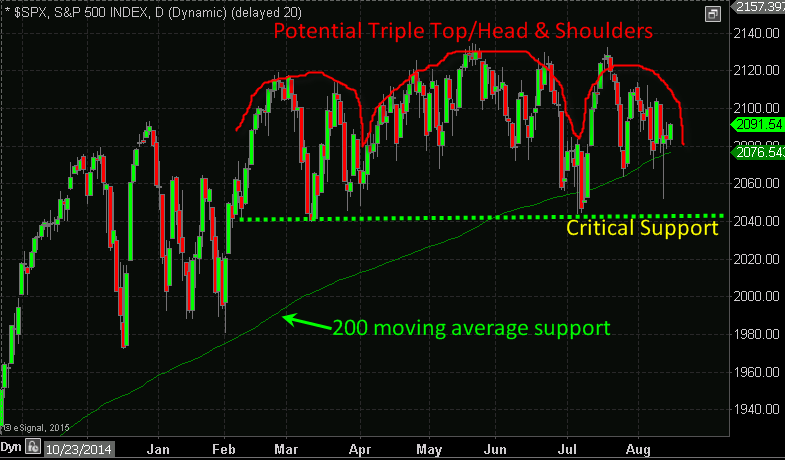
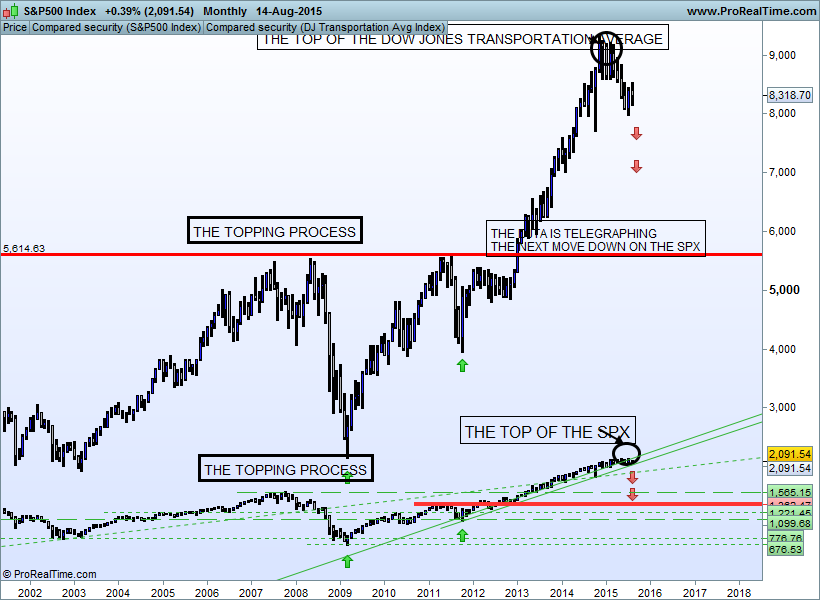
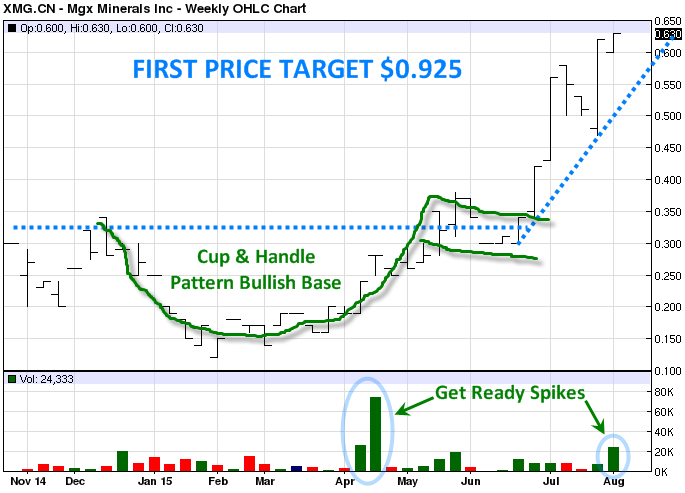
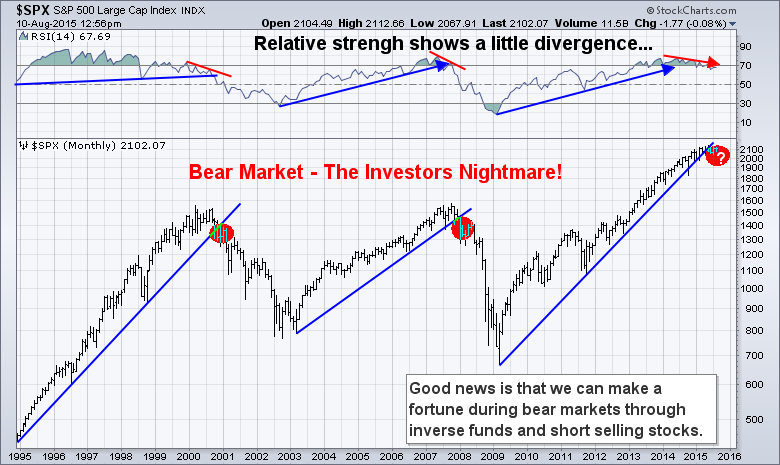
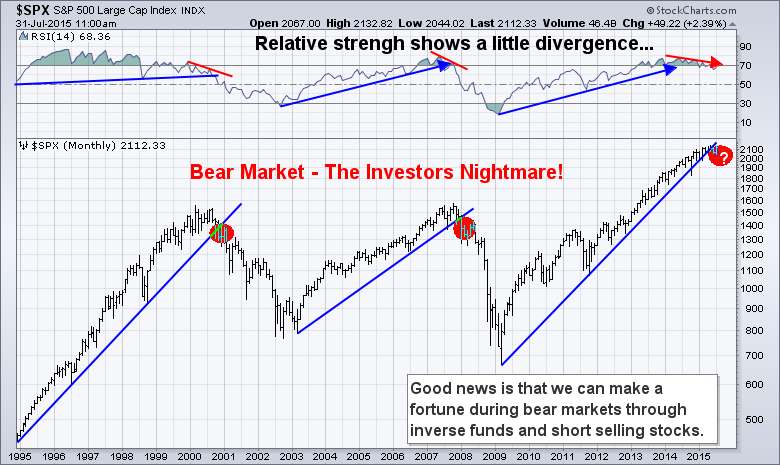
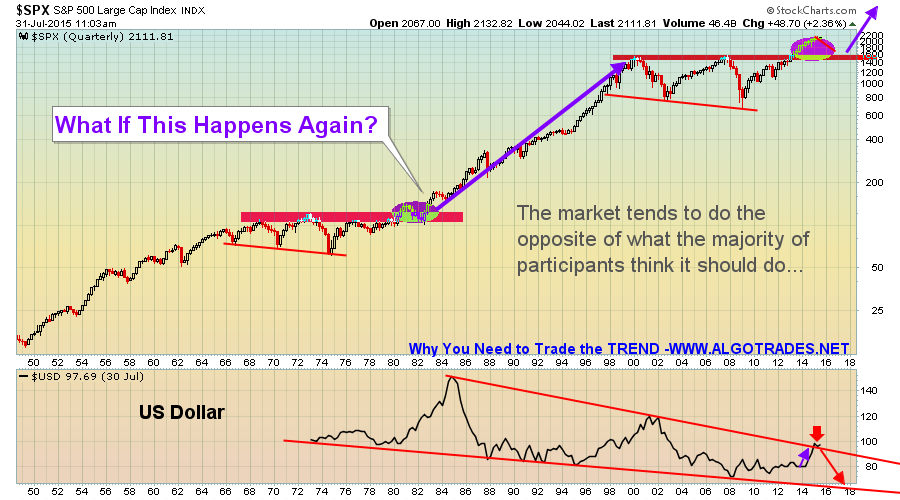
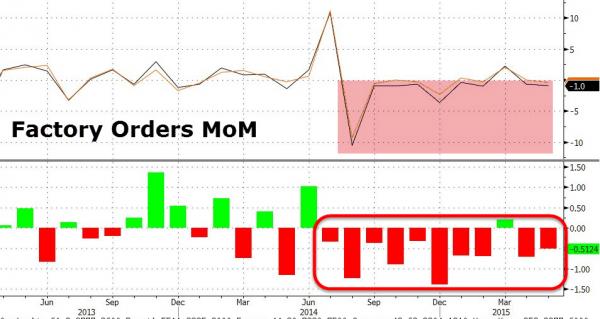
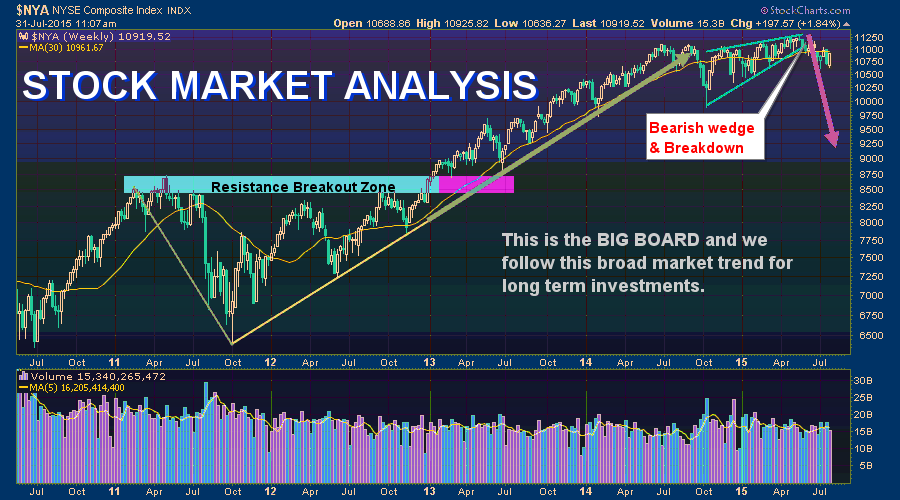
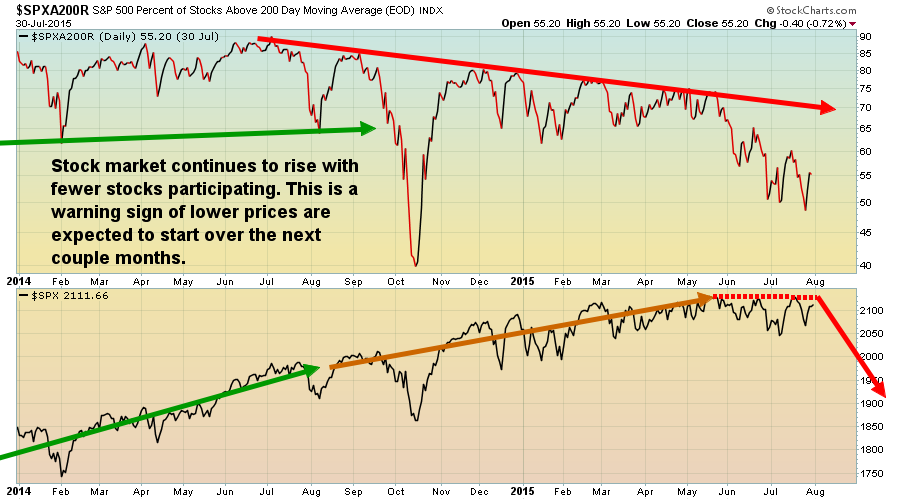
We continue to see the US and global economies struggle. The writing is on the wall that a collapse in equities is drawing near, but we have yet to see the broad stock markets break down. When they do, there will be a lot of money made by taking advantage of falling prices, which is what my focus will be with my trading capital and ETF trade alert newsletter: www.TheGoldAndOilGuy.com – SPECIAL OFFER

Chris Vermeulen

Since we started sharing the new and improved algorithmic trading systems (S10 and D30) a few weeks ago we have received a lot of great feedback and demand.


We do have more good and some not so good news…


The good news is that the system kick started the week once again with positive trading results within the first hour of the week. The index opened lower and it caused the market the flip and flop a little between and up and down trend. But once the intraday trend took hold the systems both reached their T1 (first target) less than an hour after the opening bell to lock in $400 profit. The systems are still long 1 contract and deep in the money as you can see below.


Image
Also, one of our improvements to the systems was our improved Risk Containment and Equity Protection features. This improvement will be explain in more detail in another email/video but in short this reduces the amount of potential gain we give back when the market rolls over and starts moving against our second contract. For example in the past we would see our positions up $800 – $1500 but when the trade was closed we only realized $150 – $400. The improved systems now lock in more profits $450 – $950 in these similar trade situations.


Now for the Not So Good News. To be honest this news isn’t all that bad but we want to be sure you know what is going on. In the past week the emails and phone calls have been rolling in faster than we can take them. The list of phone messages we need to listen to and call traders back is crazy long.


The solution, I know many of you want to speak with us before subscribing and want to join before the 30 day pre-live trading special offer is gone forever so this is what you should do and expect:


Emails are the best and quickest way for us to respond, but if you would like to speak with someone PLEASE leave a phone message and we will return your call within a day or two.


These new and improved systems will be going live for users on Sept 1st (TEN DAYS). Fastest way to get setup is to subscribe now to reserve your seat and take advantage of the special offer, then visit our broker’s page and click on a link to open a trading account and get it funded. We have direct broker support phone numbers to help you fast track the process: Open Account: http://www.algotrades.net/automated-trading-systems/


Hope you had a great weekend!
Talk soon
Chris Vermeulen

Last Tuesday, the 11th of August, the central bank of China devalued the Chinese currency, i.e. the Renminbi (or yuan), against the US dollar by nearly 2%, making it one of the biggest moves ever since the Chinese currency announced that it was de-pegging from the US currency back in 2005.

The reason behind the Chinese government’s decision to devalue the country’s currency last Tuesday had a considerable lot to do with a significant number of factors regarding the global currency markets over the need to aid Chinese exporters craft their goods for lesser prices on the global market.

 ChinaNEWDevChart1

What Does It Actually Mean for a Nation to Devalue Its Currency?

In global regards, devaluation is a decision carried out by the government in order to readjust the value of their currency downward, as compared to another standard or any other country’s currency.  In the case of China, the central bank of the country had adjusted their daily trading brand for their currency. As per the regulations of the People’s Bank of China, the yuan is allowed to have a fluctuation of only 2% (either upwards or downwards) in accordance with a rate that is set by the authorities.

How the Chinese Government Played It Smart

If the Chinese government had devalued its currency, by, for example, 20%, it would have clearly been an effort to help increase exports for the country’s own benefit. On the contrary, however, a mere 2% devaluation is rather different; it largely keeps the Chinese currency at par with the currencies of its trading partners, keeping in mind that those currencies have lost their values against the US dollar.

In the rest of this article, we will be looking at what effects this plunge would have had on the United States and the US Stock Market, as well as some other major areas of concern that should be brought to light.

China’s Overall Impact on U.S. Growth Would Have Been Small

The action that was taken on Tuesday was not major enough to counter the Chinese currency’s appreciation over the span of the previous year, so it is unlikely that the growth rate of the country would have been effected all of a sudden on its own, or so were the assumptions made by some of the skeptics.

The People’s Bank of China presented a change in policy which shifted the government’s procedure for valuing the country’s currency to provide more importance to market prices within a system that is both a combination of market and state control. As such, currently we are still unsure as to what the 2% drop was all about and whether or not it is a part of a bigger picture that is being anticipated by the Chinese government. With that being said, the 5% drop would have never meaningfully influenced the Chinese exports.

The Aftereffect on the US Stock Market

Investors are still critical regarding the slow growth that China has been witnessing lately and what this could possibly portray for the world markets. As the Chinese currency plunged this week, so did the US stock prices. The primary area of concern for the consumer investors from now onward is the perception of Beijing’s apparent tactic for unexpected interventions in the currency markets.

According to Beijing, the move China made last week resulted due to a switch the country was trying to implement. This was the adaptation of a more market-oriented approach of the daily reference rate calculation. This rate is known for setting the value of the Chinese currency, the yuan (also called the Renminbi, or RMB).

Before this move, the authorities had based the rate in accordance with a poll which consisted of market makers. However, after the move was made, the authorities also considered taking into account the close of the day before this move. Other factors that were included were the rates of other major currencies, along with foreign exchange demand and supply.

With everything said and done, the important thing to note is the fact after the recent turn of events of the entire previous week, is that the yuan (RMB) is still only allowed a fluctuation of 2% either up or down as per the reference rate set by the People’s Bank of China.

Focusing on the “Now”

As events turned out on Friday, the 14th of August the Chinese central bank raised the value of its currency by 0.05% against the US dollar. This ended the three-day fall in an unexpected turn of events that consisted of a series of devaluations.

Regardless of this, however, there are still concerns regarding the slow growth in the country’s economy. The particular area of focus in this regard is China’s exports, as they require a serious stimulus which is only possible from additional cuts in the country’s exchange rate. Moreover, a swerve in recent figures also portrays that growth in a number of critical areas has further slowed down to a crawl in answer to contracting global trade. For example, the demand for one of the key measures of activity in China, i.e. oil, fell in tandem due to yet another drop in car sales. The event occurred this June when the exports took a tumble by 8.3%.

The most alarming point is the fact that China’s slump isn’t alone, as it is possibly spreading all across the Asian region. A perfect example is the shrinking of the Japanese economy back in April-June when the country’s exports dropped while the consumers also cut back on spending. Elsewhere, South Korea also went through its weakest growth in the last six years during the second quarter of the current year.

All in all, the devaluation of the yuan may have been a smart move for China, but for the rest of Asia, it does pose a rather disturbing outcome. Only time will reveal what’s next.

Let us share with you more interesting news, analysis and our trade alerts so you can be in control of your financial future.

Chris Vermeulen – www.TheGoldAndOilGuy.comSPECIAL OFFER!

Last week, the global equity markets were quite undecided. China’s and Japan’s equity prices have been moving higher. The Japanese Nikkei reached its highest level since 1996 on Tuesday, August 11th, but then pulled back at the end of the week. Hong Kong’s Hang Seng made a new monthly low and the Australian Market fell to a new 6-month low.

Europe was more decisive. Traders mostly sold stocks.  The German DAX, London FTSE, and Zurich SMI all fell to monthly lows by mid-week and did not recover much by Friday August 14th’s close. In Russia, it was much different. Moscow’s MICEX index rallied to its highest mark in 3 months.

In the US Markets, the selling was even more intense.  On May 19th,2015, the DJIA topped out at 18,351.  The DJIA has failed to make a new high since then and continues to sell off. The decline, so far, has been over 1,220 points which is its’ greatest loss of the year.  Last week, began very strong, with the DJIA up 245 points on Monday, August 10th; Tuesday was down 212 points, and by Wednesday, the DJIA had fallen all the way to 17,125, its’  lowest level since February 2nd, 2015. We had a CONFIRMED BEARISH/SELL signal on August 4th, when the Dow Jones was at 17,596.  Before I can take any BEARISH positions in the US Markets, this signal needs to be CONFIRMED by the SPX and the NDX-100 as BEARISH, which are currently NEUTRAL/TRENDLESS.

The SPX landed at support levels and found its’ footing, once again. We are getting closer to the cycle lows in September/October when the downward pressure will push it through its’ support trend lines.  We are still into a sideways direction. It is a little too early to tell if it will continue the sideways motion or decline in some downward momentum, next week. SPX is undergoing a consolidation in a downtrend trend using the 200- Day Moving Average as support. A daily close below 2076, which does not hold, should bring about the next challenge to the 2040 major support level. The current declining patterns are represented in those of the DJIA,, NYSE and the Dow Jones Transportation Indexes.

spxsupport

The Dow Jones Transportation Index and the Dow Jones Industrial Average are leading the US Markets down during this topping process   They are declining further than the other indexes, and the other indexes should be establishing their downtrends, in the near future. With the exception of a monumental one-day market crash, that happens once in a blue moon, bull markets that are topping undergo a drawn-out process that usually takes, at least, many months before bearish momentum finally takes over and a new downtrend emerges.

DJTASPXAUG14

Considering that US stocks have been in a 7-year bull market, it would be unreasonable to expect such bullish momentum to change overnight.

Therefore, even though price momentum has been favoring the bulls lately, it is still my belief, that it is dangerous to be invested on the long side of these markets, as of November 25th, 2014.

The stock market is undergoing a big trend change and most of the analysts are missing it, which is normal. They lack the access to “The Predictive Trend System Analytic’s” of a Financial Forecasting Model. My clients have the access to this knowledge from our subscription service that we provide.  This knowledge provides you, the client, with THE EDGE that other professional investment firm’s lack.

U.S. equity markets have been fueled by cheap dollars and cheaper interest rates. The combination of the stock market crash from 2008 – 2009, along with a declining U.S. Dollar, has been destroyed by the Federal Reserve Bank (FRB), which has helped US Equities to become a bargain on the global market. This allowed foreign buyers to come in and purchase US Equities, at both a nominal value, based on the markets’ decline, as well as, a relative value based on their home currency. Foreign investors have capitalized on the rise in the US equity market

On November 25th, 2014 my **Global Sentiment Model signaled the “EXCESSIVE EXTREME OPTIMISM”, which provided an exit point on all long US Market positions .  Those traders and investors, that remained in long positions, who were not subscribers to our service, at that time,  have just been channeling, without any new break outs into new highs.

There is a huge disconnect between the popular sentiment, among the  “talking heads” on the news, regarding how these events will affect the September 2015 meeting of the Federal Reserve Bank. The general consensus, that I feel currently exists, is that this could very well push any increase in interest rates, out into the year, 2016. The Federal Reserve Board of Governors has been decidedly dovish, regarding this aspect, and has continued its’ quantitative financial engineering.


INVESTOR SENTIMENT READINGS

High bullish readings in the sentiment stock index usually are signs of Market tops; low ones, market bottoms.

Last Week

2 Weeks Ago 3 Weeks Ago
AAII Index
Bullish 30.5% 24.3% 21.1%
Bearish 36.1 31.7 40.7
Neutral 33.4 44.0 38.2
Source: American Association of Individual Investors,

Our current sentiment and technical features are consistent with a major stock market top.  This model uses the market sentiment composite which is a measure of investor sentiment. This metric tracks the mood of investors, which is then translated into a probability whether the markets will advance or decline, within the near term, as well as, an undisclosed period of time. It is a contrarian indicator that produces a bullish signal, when market sentiment is overwhelmingly negative, and a bearish signal when markets are overwhelmingly bullish.

We have not disclosed these models’ methodology, and its statistical data, as it is proprietary.  We have also not disclosed the correlation coefficient that is used to measure the strength of the linear dependence and its’ algorithms between the market sentiment composite and the 12-month forward return. A trading friend of mine developed this model thirty years ago.  For the period of time that it has been implemented, which is now 25 years, it has been predicatively accurate, 100% of the time, prior to any major changes within the US Markets. The last signal that was generated was on November 25th, 2014, which registered   “EXCESSIVE EXTREME OPTIMISM” and the broad market had been trading sideways since.

Learn how to read the market and make the same trades we do: www.TheGoldAndOilGuy.com

Chris Vermeulen

Over the recent months I have shared my precious metals, miners and commodity sector forecasts. Also I have shared some of the hidden gem stocks which I am starting to accumulate positions in as the resource market start to carve out a bottom.

These stocks each have a very unique opportunity and provide slightly different exposure to my portfolio. These stocks cover gold, silver, graphene, technology, oil, and today I want to share another company that will produce magnesite, which I think has tremendous upside potential that trumps most other opportunities I have come across because the life expectancy of the mine is 100+ years, its location, the high grade of their mineral, and just as importantly their management team and vision.

If you have followed me for any length of time, then you know I like to keep things short and simple. Here is a detailed report by a third party talking about the company’s story, and opportunity.

mgxlogo

FULL REPORT – CLICK HERE


I don’t need to get into the details as that is available in the report link above but let me recap the core points from the meeting I had with the MGX recently.

COMPANY KEY POINTS

  • Canadian resource company – resource bull market is near
  • 100+ year mine life expectancy – potential to become huge operation
  • Advanced holistic extraction and processing of mineral
  • Extremely high grade Magnesite mineral – Demand top dollar for material
  • Magnesite: 75% lighter than steel, 33% lighter than aluminum – Rising Demand
  • Multi-Uses: Abrasives, fertilizers, animal feed, water treatment, automotive etc.
  • China supplies 80% of production and its low grade, high shipping costs
  • MGX’s location has lower shipping costs with consistent high grade Magnesite
  • Company could start small producing in near term – generate cash flow/profits
  • Management Team – Jared Lazerson has incredible passion, energy and vision
  • Company is outside of the gold/silver sector


MGX JARED LAZERSON INTERVIEW

mgxvideo


MGX MINERALS INC. SHARE PRICE ANALYSIS

Let take a look at the share price and see where price and volume are telling us. This in a fairly new company and its name and shares remain unknown by the masses at this point. Hence the reason I call it hidden gem.

There are several great things about investing in stocks that are trading at all-time new highs. Main reason is that there isn’t any overhead resistance in share price from previous owners looking to sell. In fact, buying stocks at new highs is a well-known strategy investor’s use.

The type of price action that typically happens with stocks like this, are small pauses and pullbacks as investor’s become satisfied with gains and slowly sell a few shares to lock in gains. It’s a trickle of selling vs heavy volume distribution which takes place in beaten up stock prices with unhappy shareholders.

If you look at the chart below you will notice at the bottom the green volume spikes. I call these “Get Ready Spikes”. It means some big investors are getting positioned for more upside potential.

Also, notice the bullish cup and handle pattern. These are actually one of the strongest chart patterns that I know of. Many times I see 3-5X the move in share price based on the depth of the pattern from the low to the high for the first initial major rally. This means we should see $0.925 cents a share in the not so distant future.

See live Quote/Chart: http://www.stockhouse.com/companies/quote/c.xmg/mgx-minerals-inc

mgx

I should warn that there are drawbacks to trading these small unknown stocks. Because they are unknown they lack volume/liquidity/market depth. What does that mean?  It means it is hard to get any sizable position quickly. I recently bought shares above the 60 cent level. The way I go about things is to buy some at market price, then place another buy order where I am willing to pay for the rest and hope I get filled over the next week or two.

Shares like this can move quickly because there are not many sellers so once the ask price is bought up price jumps up to the next level where there is a seller.


MY HIDDEN GEM RESOURCE PLAY CONCLUSION:

Technical analysis and trading is my passion and getting involved in new companies which have a quality product, proven management, and have the right timing for entering a market which is close to starting a new bull market is one of the most exciting types of long term investments to watch unfold.

Don’t get me wrong, investments are just that… long term, and take months if not years to unfold, but if you are positioned with the right company at the right time returns can be life changing 3-5 years down the road.

This company could be a world class open-pit mine for Magnesite because of its high-grade mineral, location and potentially lowest processing and shipping costs. This is not a 2-3 year mine that will be out of material like most gold and silver mines, this a 100+ year operation just getting started.

Get My Next Investment at: www.TheGoldAndOilGuy.com

Chris Vermeulen


Disclosure of Interest and Advisory Cautions: Nothing in this report should be construed as a solicitation to buy or sell any securities mentioned. Technical Traders Ltd., its owners and the author of this report are not registered broker-dealers or financial advisors. Before investing in any securities, you should consult with your financial advisor and a registered broker-dealer. Never make an investment based solely on what you read in an online or printed report, including this report, especially if the investment involves a small, thinly-traded company that isn’t well known. Technical Traders Ltd. and the author of this report has been paid by MGX Minerals Inc. In addition, the author owns shares of MGX Minerals Inc. and would also benefit from volume and price appreciation of its stock. The information provided here within should not be construed as a financial analysis but rather as an advertisement. The author’s views and opinions regarding the companies featured in reports are his own views and are based on information that he has researched independently and has received, which the author assumes to be reliable. Technical Traders Ltd. and the author of this report do not guarantee the accuracy, completeness, or usefulness of any content of this report, nor its fitness for any particular purpose. Lastly, the author does not guarantee that any of the companies mentioned in the reports will perform as expected, and any comparisons made to other companies may not be valid or come into effect.

A take on the global economy and equities markets that paints a simple and clear pictures I think.

The DJIA index has recorded seven consecutive down days in a row!  These 7 distribution days are a sign that many institutions are taking profits or establishing losses.

As we are entering the second half of 2015, financial panic is occurring globally. Currently, this tremendous financial devastation is happening throughout the world.  Stock prices are crashing in China, Europe and soon I feel the United States. Puerto Rico has now defaulted on their debts. Quantitative Easing has been masking the symptom of this endemic disease. The Greek Banks are still frozen and will continue to stay this way; however, the mainstream media is not reporting on this current situation in Greece. There is a limit on weekly withdrawals of 420 Euro per (around US $455).

The corporate leaders of the major banks were left in place back in 2008/2009 and were allowed to continue receiving their huge bonuses. Their banks only existed because of the unprecedented taxpayer subsidy.  The system is still essentially the same as it was before, due to any lack of meaningful reforms that have been required.  It is this lack of change in all the required global fiscal policies that I am warning you of the coming collapse of this new “Asset Bubble”. This is where “profits” are Privatized and “losses” are Socialized.

The printing of limitless sums of virtually free money under various “Quantitative Easing” programs and simultaneously slashing interest rates to their lowest levels in history has created stock markets that have been artificially “levitated” for many years now.  This growth is based on virtually “free money”. I am  warning you that the current business valuations and calculations are NOT accurate and even NON-sustainable.  Our previous “Credit Bubble” has now been leveraged and replaced by an even larger and more dangerous “Asset Bubble”.

The Federal Reserves easy money policies have left stocks and bonds on the verge of a massive collapse. Their “Financial Engineering” has created such a “horrendous bubble” that  it will lead to the largest historical economic deflationary depression that we have ever experienced. This bubble, when it finally implodes,  is going to be absolutely devastating to the global economies.  All irrational bubbles eventually burst.

bearmarket-chart

What is actually required today is a universally respected reserve asset capable of filling our current void with a reliable presence that serves as a “store of value”.  We do not require a complex international committee to solve this new future problem.  This “store of value” asset is already in existence and currently held by some central bankers and prudent individuals around the world.  It is known as gold.  From the ruins of our chaotic financial crisis, a degree of sanity will prevail.  Gold, as a freely floating asset, will arise in stature as the only element of global monetary reserves. The floating aspect is the vital evolutionary improvement over all previous structural monetary failures which tried to use a gold standard at a fixed price (i.e: unit of account).

When the global financial crisis hit in 2008, U.S.Dollar liquidity dried up and international financial markets experienced widespread paralysis. First to the scene was the U.S. Federal Reserve Board, pumping liquidity into the system and establishing a series of large-scale bilateral swap agreements with major central banks. This included several countries in the major emerging markets. The International Monetary Fund (IMF) followed with a number of programs for countries hit by the crisis and it adapted its financing toolkit to meet the demands of the crisis. For the first time, policy makers looked to the Special Drawing Rights (SDR) to provide much-needed liquidity throughout the international monetary system.

SDR is an artificial “basket” of currency used by the International Monetary Fund (IMF) for internal accounting purposes. The SDR is also used by some countries as a peg for their own currency and is used as an international reserve asset. The SDR was created by the countries participating in this system who needed official reserves (government or central bank holdings of widely accepted foreign currencies) that could be used to purchase the domestic currency in foreign exchange markets where it is required to maintain its exchange rate. It is a potential claim on the freely usable currencies of IMF members. The Special Drawing Rights was created by the IMF in 1969 to support a fixed exchange rate system.

The SDR is neither a currency nor a claim on the IMF. It is a potential claim on the freely usable currencies of IMF members. Holders of SDR can obtain these currencies in exchange for their SDR.  The SDR is primarily a unit of account for the purpose of accounting.

It is my view point that the SDR, which is a “Virtual Reserve Currency”, will never come close to achieving a status anywhere near that of “the principal reserve asset in the international monetary system” as envisioned by The International Monetary Fund for a future global reserve currency!

Gold has been declining sharply since its all-time high of  $1,920/ounce on September 2011. It is experiencing a historical correction that we forecasted years ago. I am expecting much lower prices over the next few months.   My predictive trend and cycle strategy will inform us when we have roughly hit the bottom of these two markets (gold & silver).

Today, the majority of investors now believe gold is dead and no longer relevant and that cash and the U.S. dollar is King.  With this type of “herd mentality”, investors will mostly likely miss the next historical buying opportunity for metals, and miss the ultimate short-sell trade on US equities.

Chris Vermeulen
TheGoldAndOilGuy.com – ETF Trade Alerts
Algorithmic Trading Strategies Developer & Trader

vermeulen-interview

In 1933, with America five years deep into The Depression, the stage was set for an act of unprecedented proportions. History shows a wicked warlock at work.

On March 6, 1933, Executive Order (EO) 6073 was passed by Franklin Delano Roosevelt (FDR), the 32nd President of the United States in an attempt to solve the dire banking crisis. Executive orders have been around since 1789, allowing Presidents to issue legally binding orders unilaterally, without the consent of Congress. During his Presidential tenure, from 1933 to 1945, Roosevelt would issue 3,728 Executive Orders.

This was his third and it was a doozy. I could just imagine how angry and frustrated individuals would have been. I doubt this will happen again but history does have a way of repeating…

Executive_Order_6102

Source: Wikipedia-executive order 6102

Just two days after Roosevelt was inaugurated as President, he proclaimed a “banking holiday”. From and including Monday, March 6, 1933 to Thursday, March 9, 1933 no bank “would pay out, export, earmark, or permit the withdrawal or transfer in any manner or by any device whatsoever of any gold or silver coin or bullion or take any other action which might facilitate the hoarding thereof…” Sold to the American people as an attempt to control speculation and regulate interest rates, he closed America’s banks, thwarting customers from withdrawing their paper money holdings or converting their holdings to gold.

With a swish of his magic wand, Roosevelt mastered “complete control over America’s banking system”, expanding his Presidential powers exponentially in the process.

In his first “Fireside Speech” (which burned the backside of many Americans) on March 12, 1933 Roosevelt declared “Let me make it clear to you that the banks will take care of all needs, except, of course, the hysterical demands of hoarders, and it is my belief that hoarding during the past week has become an exceedingly unfashionable pastime in every part of our nation. It needs no prophet to tell you that when the people find that they can get their money — that they can get it when they want it for all legitimate purposes — the phantom of fear will soon be laid. People will again be glad to have their money where it will be safely taken care of and where they can use it conveniently at any time. I can assure you, my friends, that it is safer to keep your money in a reopened bank than it is to keep it under the mattress.”

On June 16, 1933, EO 6073 passed into legislation as the “Emergency Banking Act (EBA)”. After only 40 minutes’ debate in the House of Representatives, with an unknown author and no printed copies available for members of the House, the Bill was passed swiftly and without due process. The wand was waved again.

At the time, Congressman Lundeen, appalled at the reckless lack of due process involved in the passing of this Bill said “I want to put myself on record against procedure of this kind and against the use of such methods in passing legislation affecting millions of lives and billions of dollars. It seems to me that under this bill thousands of small banks will be crushed and wiped out of existence, and that money and credit control will be still further concentrated in the hands of those who now hold the power…. I am suspicious of this railroading of bills through our House of Representatives, and I refuse to vote for a measure unseen and unknown.”

Meanwhile, Executive Order 6073 paved the way for Executive Order 6102 on April 5, 1933.

This Executive Order (EO) made it a criminal act to possess gold coins, gold bullion and gold certificates within the continental United States and ordered that the hoarded gold be delivered to the Government on or before May 1, 1933. The official price of gold was raised from $20.67 to $35/ounce.

Although it is unknown just how much gold was confiscated by means of Executive Order 6102, numbers suggest that by January 1934, there were 195.1 million ounces and 227.9 million ounces by August 1934.

The Government had to have some place to hoard the confiscated gold. So, Executive Order 6102 paved the way to Fort Knox. The U.S. Treasury Department began construction of the United States Bullion Depository (USBD) in 1936. Completed in December of that year, at a cost of US$560,000, the Gold Vault sits in a 109,000-acre Army enclave in Fort Knox, Kentucky.

The U.S. Mint states that 147.3 million ounces of gold are now tucked into Fort Knox. Guarded by Apache helicopter gunships and tucked into a bunker with a bomb-proof roof and thick granite walls, you’d think that 147.3 million ounces of gold would be safe in the vault. While Treasury officials insist that the “gold is all there”, why the resistance to a public audit? Congress begs off, saying it will cost US$60 million to test the gold. Other figures bandied about suggest US$15 million. Other so-called experts contest both figures, stating that an independent audit and assay could be conducted for as little as US$15,000.

More nefarious are that the numbers don’t add up…and never have. In his article The Great American Disaster: How Much Gold Remains In Fort Knox?, dated August 27, 2010, Chris Weber states that, at their peak in 1949, the Fort Knox reserves reputedly numbered 701 million ounces – 69.9% of all the gold on the planet. The latest figures reported by the U.S. Mint state that 147.3 million ounces of gold are now tucked into Fort Knox. Treasury subsequently downgraded this figure from 264 million ounces of gold, a decline of 79%! Lucy, you got some ‘splainin’ to do.

Clearly, the road to – and from – Fort Knox is paved in gold and not-so-gold intentions. Tales of pillaging, profiteering and skullduggery abound at the crossroads of Bullion Boulevard and Gold Vault Road. Masked interlopers didn’t rob the USDB. Reputed to be the second most secure place in the world (as reported in The Blogington’s post of September 21, 2010), the video cams, armed guards, attack helicopters, armored personnel carriers, and 30,000 soldiers guarding Fort Knox guaranteed that.

For over 50 years, while domestically it was a crime to hold gold, there is little doubt that well-heeled Americans – and America’s enemies, operating offshore, were able to procure gold at the bargain basement price of $35/ounce.

Not surprising that Fort Knox’s 22-ton door is locked to an audit. For almost 40 years, no visitors have been allowed in the grounds of the Gold Depository. Considered one of the eight most secure places in the world, we’re not getting in for a sneak peek anytime soon. In the last recorded “audit”, in the early 50’s, a group of Congressmen and Senators were taken on a quick tour of Fort Knox and allowed to peek into a few vaults. They reported seeing “orange-hued gold bars”. Lucy, you got more ‘splainin’ to do.

In his article “The Great American Disaster: How Much Gold Remains In Fort Knox?”, Chris Weber outlines details about the one “audit” of Fort Knox, as follows:

“The only audit that has ever been done of the gold inside Ft Knox was done days after Dwight Eisenhower became President in January of 1953. After 20 years of Democratic presidents, the American public wanted to be sure that the gold confiscated from them was still there. Thus, the new President ordered an audit within hours after taking office.

The central problem was that it wasn’t much of an audit. To sum it up:

  1. Representatives of the audited group were allowed to make the rules governing the audit. No outside private experts were allowed.
  2. Those government bureaucrats involved were inexperienced in their tasks, by their own admission.
  3. The entire audit of the largest gold hoard ever concentrated in history lasted only seven days.
  4. Only a fraction of the gold was actually tested. Later, the officials put this fraction at just 5%.
  5. Based on that fraction, the official committee reported that, in their opinion, all the holdings would have matched their records if they’d all been tested.
  6. If the audit was accurate, the fact remains that almost 80% of it went overseas in the coming years. If the audit was not accurate, the amount of gold lost could have been even more. “

On September 23, 1974, Mary Brooks, the Director of the United States Mint, led a tour of members of Congress and the news media through the USBD. There was no audit or inventory of the gold and no other public “inspection” has been allowed since then.

Why won’t the Mint comment about how much gold is there? Perhaps the acid test is not so much as what has happened to the gold in Fort Knox; but rather is there gold in Fort Knox? And if so, how much…..or how little?

In a feat worthy of The Great Houdini himself, the Fort Knox gold may be the World’s Greatest Vanishing Act ever.

In Conclusion:
There are other ways to take advantage of gold’s next bull market that can add leverage and protection against a gold confiscation. One of the best ways is through the ownership of gold producing companies. The key here is in buying the right companies as the right time within the market cycle.

If you are interested in accumulating shares in what I believe will be some of the best performing stocks in the near future join my FREE gold newsletter: www.GoldTradingNewsletter.com

Co-Authored:
Chris Vermeulen
Kal Kotecha

The US stock market continues to grind higher but is doing so with eroding market internals. As the market indexes rise we see fewer stocks moving up to support the move. It’s a matter of time before a large correction occurs.

It seems everyone is calling for a market top, and many have done so for the past 3 years. But the key to success is to follow the market, not predict market tops or bottoms. We follow price trends and trade alongside. We do have a bearish tone looking forward the next 1-2 years for stocks, but we are not calling a market top, nor are we shorting the market in anticipation. Instead, we actively trade the markets smaller trends which occur on a regular basis (weekly and monthly) through active buying, and shorting these smaller trends.

The month of July has been an incredible month for the new and improved automated trading system as you saw from the Results posted recently. The frustrating part is that it takes some time for us to move and integrate this improved system into our platform for our users. While the system is trading incredibly well during one of the toughest market conditions we have experienced in years, we are excited that our users will have these trades executed in their accounts starting September 1st.

Adding to this excitement is the fact that stocks typically fall 3-7 times faster than they rise, which means we can make more money, and make it faster during a falling market then we do from a rising market. Once the major trend turns down (likely later this year) we will be off to the races with out-sized trading gains once again.

Over the next couple months we should start to see the US equities market top, and start its first major correction. Once it start we trade the market in a way that should generate gains as the stock market falls in value.


 S&P 500 Monthly Chart – 7 Year Cycle

The SP500 index (US Stock Market) continues to be in and Uptrend.

The major trend line on the chart below must be broken in a big way before a full blown bear market will be confirmed. This is still months away at best. The AlgoTrades INNER-Market Analysis will get us positioned when the time is right and enable us to profit as the stock market loses value.

Your long term equity investments can continue to be held at this point. Speculative and momentum stocks (Russell 2K) continue to show weakness. Large cap stocks will likely be in favor as the safe haven “blue chip” stocks, but when the market is ready to roll over, all stocks will fall.

I do fear a global economic collapse is possible which I talk about in our GoldAndOilGuy Trading Newsletter. But at this time, we do not need to change our trading approach and investment capital. But when certain events start to happen in the USA and abroad we will need re-allocate some of our investment capital, but again, we will keep you updated on this also when the time is right.

1


S&P 500 Quarterly Chart – BIGGER PICTURE

This chart I feel provides a great perspective on the overall market trend and price patterns. This is the 70 year prospective. I hope something like this unfolds. Fingers crossed to a nominal 12 month correction/bear market. This will build a new base for the next super cycle.

US Dollar has now reached the upper resistance trend line… we could see weakness in the dollar going forward… Keep in mind this is a quarterly chart, lower prices may still be a few months away.

2


Factory Orders Scream Recession/Correction

This has never happened outside of recession… Year-over-year, factory orders dropped 6.3% (adjusted) but 8% non-adjusted, the most since the financial crisis. Against expectations of a 0.5% drop MoM, manufacturers saw new orders tumble 1.0% and previous months were revised dramatically lower. Factory orders has now missed 10 of the last 11 months. Factory Orders have fallen for 9 of the last 10 months…

factory1

factory2

Source: ZeroHedge


Also, the New York Stock Exchange and SP500 indexes are losing momentum.

The SP500 index has been trading sideways the over the last 6 months. It has not provided many trades for our automated trading system (AlgoTrades).

NYSE BIG BOARD STOCKS – Breaking Down

4b 


Stock Market Rises with Fewer Stocks – RED FLAG

Since mid 2014 the US stock market has become move volatile. Fewer stocks participating in the markets move up. This can be seen by comparing the percent of stocks trading above their 200 day moving average and the S&P 500 index.

Once the stock market comes to a complete stall it will drop violently. While I am not calling a top yet, understand each month we are getting closer and I believe the stock market is in a stage 3 topping process.

5


INNER-Investor Monthly Conclusion:

The New York Stock Exchange, S&P 500, and Dow Jones forming a bearish rising wedge which they appear to have broken down from. This could be the start of a bear market but until the price action truly confirms this the major trend remains up. The last quarter of 2015 will likely provide great opportunities for the active trader. BECOME AN ALGOTRADES USER TODAY – CLICK HERE


OTHER TRADING EDUCATIONAL MATERIALS


algocourse“IF YOU’VE GOT 3 HOURS, WE’LL SHOW YOU HOW TO EASILY TURN YOUR TRADING AROUND AND IMPROVE YOUR BOTTOM LINE BY AT LEAST $1,000 EVERY MONTH”

…No B.S., No Kidding or Exaggeration. WE GUARANTEE IT!

Steaming Video Course: Click Here


book1If you are not part of the AlgoTrades program join today!

Not yet read my book? I highly recommend you do this as it walks you through the key indicators/analysis used so you understand how the AlgoTrades system can make you money on auto-pilot.

Digital Book Download: Click Here


book2A Sudden Collapse In Equities Is On The Way!

It is more critical than ever in our history to hedge against an economic collapse, especially this year.

Seven experts from around the world agree with this impending collapse and you will have a once-in-a-lifetime opportunity to profit from chaos.

Digital Book Download: Click Here

I am issuing a “Red Flag Warning” To Financial Markets for the next six months of 2015.  I have come to this conclusion that the next and most devastating financial collapse lies right in front of us. This information comes from my confidential sources who have shared this with me, and is supported by my 15+ years of trading and investment analysis experience, as well as the implementation of our financial forecasting models.

The SPX market internals/market breadth have started to correct itself and therefore the “rolling-over process” is now in progress.  This is primarily due to the 7-year cycle.  It has been slow, but steady.  So far, the result has been to pressure prices into a short-term downtrend.  This correction of the 7 year cycle will be significant!  If we look at the first three trading days of 2015, the SPX was down 2.75%.  The only other time in history that this occurred was when the SPX declined by more than 3% in the years 2000 and 2008.

Financial Markets do move in predictable waves, cycles and patterns.  Economic cycles have enabled experienced analysts, as well as myself, to correctly forecast the timing of stock market peaks and stock market crashes/corrections over a very long period of time. These cycles are currently indicating that the U.S Financial Markets and the US Economy are about to enter a major downturn. These are repeating patterns that do occur in different fractals.

There are many cycles that I have studied over the last 15+ years.  The 7 year cycle is most dominant and repetitive for our analysis and current application. We can look back at the most recent financial crisis which occurred in 2008 in which the stock market crashed, Lehman Brothers collapsed, and we were plunged into the worst recession that we had experienced since the Great Depression.   Prior to that, the last time that the stock market experienced a major decline was during the bursting of the dot com bubble, seven years earlier.  2001 was a year of recession for the U.S. economy and of major problems for stocks. That was the year in which “9-11″ tragically occurred.  Seven years earlier, in 1994, investors experienced the worst bond market of their lifetimes. Another seven years earlier brings us to 1987 in which most of us remember as “Black Monday”.  These repeating patterns are well documented in history.  The same price patterns appear, at any given time, from monthly, daily, hourly, even down to one minute charts. This is the reason why markets are “fractals”.

chart1

This current seven year cycle also aligns with the seven year “Shemitah cycle” that can be found in the Bible.  The Sabbath year (shemita Hebrew: שמיטה‎, literally “release”) also called the sabbatical year or sheviit (Hebrew: שביעית‎, literally “seventh”) is the seventh year of the seven-year agricultural cycle mandated by the Torah for the Land of Israel and is still observed within contemporary Judaism. All of the great economic crashes in the U.S, including the Great Depression, have been in alignment with Shemitah years.

chart2

I first discovered a long term cycle when I came across “The Kondratieff Wave” while in my early years of studying finance and economics. It was developed by a Russian economist named Nikolai Kondratiev.  Nikolai Kondratieff (Kondratiev), a Russian economist was the first to suggest that industrial economies followed a cycle of change

within business cycles which included “inflation”, the “expansion of the economy” and “deflation”, which is the contraction of the economy within a “business cycle”.

During these periods of decline that occur, in the long waves, a large number of important discoveries and inventions in the technique of production and communication have been made.   These are applied on a large scale at the beginning of the next long upswing.

The originally estimated cycle length lasts 50 to 54 years.  These are shifts over time between economic growth “expansions” and periods of economic declines of “contractions”.

This is my interpretation of the time frame.

I have defined 6 long economic waves (cycles) and each of them was initiated by a specific technological revolution:

  1. (1600-1780) The wave of the Financial-agricultural revolution
  2. (1780-1880) The wave of the Industrial revolution
  3. (1880-1940) The wave of the Technical revolution
  4. (1940-1985) The wave of the Scientific-technical revolution
  5. (1985-2015) The wave of the Information and telecommunications revolution
  6. (2015-2035?)The hypothetical wave of the post-informational technological revolution

The only thing predictable about todays’ global economy is the “K Long-Wave” economic cycle.  This is the reason more and more analysts are embracing the “K Long-Wave Principle” as an unrivaled economic indicator, and the source for accurate economic forecasts.

Our clients will profit substantially from the use of this proven advantage of the “K Long-Wave Principle”   This wave is characterized by four seasons:  Winter, spring, summer and autumn. We are currently in the Economic Winter.  We are in a global depression and experiencing an economic collapse during this period of time which is identical to the “roaring twenties”, but now it is similar to 1929. The last “Great Depression” lasted fifteen years and a World War to get out of that economic downturn.

My technical trader which is also a Capitol Hill insider went into development and research for a 5 year period of time 30 years ago. What was created was a financial forecasting model, which he implemented 25 years ago.  It is a Predictive Model in its nature.  It forecasts nearly every major market turn, within the U.S Financial Market. This gives you (my) private clients the EDGE which does not exist anywhere else.  It signaled that we exit all U.S Market positions on November 25th, 2014 for putting new investment money to work in US Equities.

Since that period of time, in history, the markets have just been “channeling” and going into a neutral position and we have been sitting in a “cash position” for these respective markets, which was the optimal position to be in.   When it has confirmed that the “TOP”, is in place, we will implement the proper position in which we will substantially obtain huge gains.  Until this time arrives, I ask that you follow our weekend updates.

Both, the 7 year cycle and “The Kondratieff Wave” are occurring at the same time.  This is a major occurrence that will take place very shortly.

Derivatives are going to play a major role in this next upcoming major financial crisis.  When you start hearing that word, on the news, then you will realize that things have started to really unravel. “Too big to fail” banks in the U.S have over 250 trillion dollars of total exposure to derivatives while only having 9.8 trillion dollars in total assets.

Derivatives are one of the three main categories of financial instruments.  The other two are stocks (equities or shares) and debt (bonds and mortgages).

When, not “if”, the derivatives market crashes, all U.S citizens will be responsible for bailing out the major derivatives clearing houses.  According to The Dodd-Frank Act: Section 2, U.S. taxpayers will bare the brunt. This gives the Federal Reserve the power to provide “discount and borrowing privileges” to derivatives clearing houses in the event of a major derivatives crisis.

Derivatives almost caused the complete collapse of the insurance giant AIG back in 2008. This financial crisis is inevitable because the causes of the previous one have not been solved. The derivative markets are not regulated, and they continue to grow unchecked.  The truth of this matter, is that there are no financial resources left. It is now out of control, and we just allowed it to get bigger and bigger and bigger.  The Federal Reserve, the US Congress and President Obama have created this situation, in which, there is not enough money in the world to cover these debts.

Find out how to profit from the coming events here: http://www.thetechnicaltraders.com/GFWSS/

Chris Vermeulen