2013 was one of the worst years for gold in a generation and the strangest part of it is that this loss came during a time in what should have been a banner year for gold.
When the Fed launched its QE1 and QE2 programs, gold posted huge gains but with QE3, we only had a brief rally in late 2012, it’s been all downhill form there.
The price of gold over the last year highlights just how much Europe has become a powerful driver behind gold vs. the US which has historically been the main mover. When the European debt crisis started a few years ago, people fearing a financial meltdown in Europe put a lot of their money into gold as it was the save haven of choice.
However, with financial and political risk in Europe subsiding, we have seen money leave gold and move into other markets, hence the big outflows from gold ETF’s.
Other factors that have dragged on gold over the last year include falling jewelry demand, the loss of its role as an inflation hedge with deflation becoming more of a concern in some areas, also tax increases on gold imports in India, and the supposedly improving economy in the US. All these contributed to the selling of gold.
Gold and gold stocks crashed last year in the summer. They have since been going through a stage one base. This suggests that 2014 will mark the start of a new bull market for gold, gold mining stocks and commodities. The commodity sector as a whole should be your focus in the coming months if you want to be able to invest in something for longer than a few days or weeks and make a huge amount of money be sure to check out my gold newsletter.
Gold Market Traders & Manipulators Provide Contrarian Bullish Outlook
Gold market traders and manipulators like some of the commercial banks/brokerage firms have been verbally slamming gold, and it turns out many are not as negative as lead us to believe…
Goldman Sachs we all know are the biggest hypocrites. While advising clients to sell gold in the second quarter of 2013, they bought a stunning 3.7 million shares of the GLD. And when Venezuela needed to raise cash and sell its gold, guess who jumped in to handle the transaction? Yup, GS! So while they tell everyone to sell gold, they are accumulating as much as they can without being obvious.
There is a lot more reasons and fundamentals to be bullish on commodities and gold, but that is not the point of this technical based report.
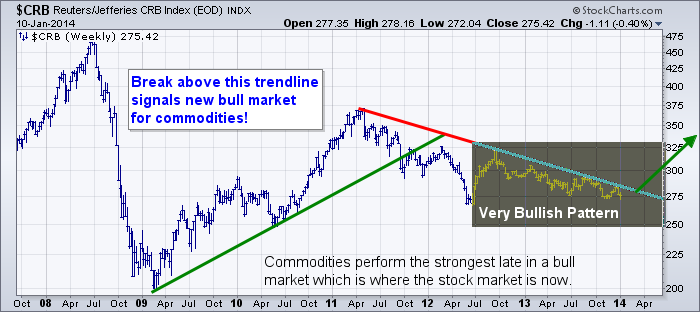
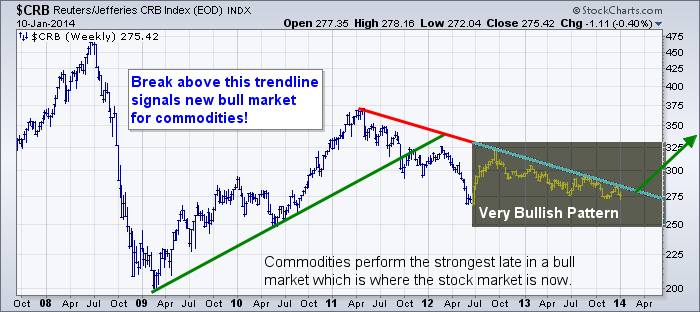
Weekly CRB Commodity Index – Bull Market Cycle About To Start
Taking a quick look at the CB index which is a basket of commodities, it looks as though a breakout above its down trend line will trigger a new bull market in the commodity sector. While this has not yet happened it looks as though it may happen in the next few months.
On stock market that recently broke out of a Stage 1 basing pattern (new bull market) is the Toronto Stock Exchange. This index is heavily weighted with commodity based stocks. I talk about this more in my new long-term algorithmic trading newsletter.
In this report I want to show you some interesting charts that are pointing to a new gold bull market cycle which looks to be starting.
The chart below of the gold miner’s bullish percent index is often misread by many traders and trade off its information incorrectly. Many for example think this index is based on stocks trading above a moving average which is no correct.
How a bullish percent index is calculated is based on Point & Figure buy and sell signals with each individual stock within the sector and in our case the gold minders ETF GDX.
Gold prices peaked in 2011 at $1923 an ounce when the gold mining stocks index was above 80%. Why is this important? Because gold stocks typically lead the price of gold in both directions, tops and bottoms.
As of today we have the reverse situation with the bullish percent index at 13% and showing bullish divergence from that of gold stocks. This is an early signal that the new gold bull market cycle is turning up and it should not be overlooked.
Also we see the 5th and final Elliott wave pattern forming and we could once again witness another multi year rally in the price of gold.
Gold Mining Bullish Percent Index – Weekly Chart
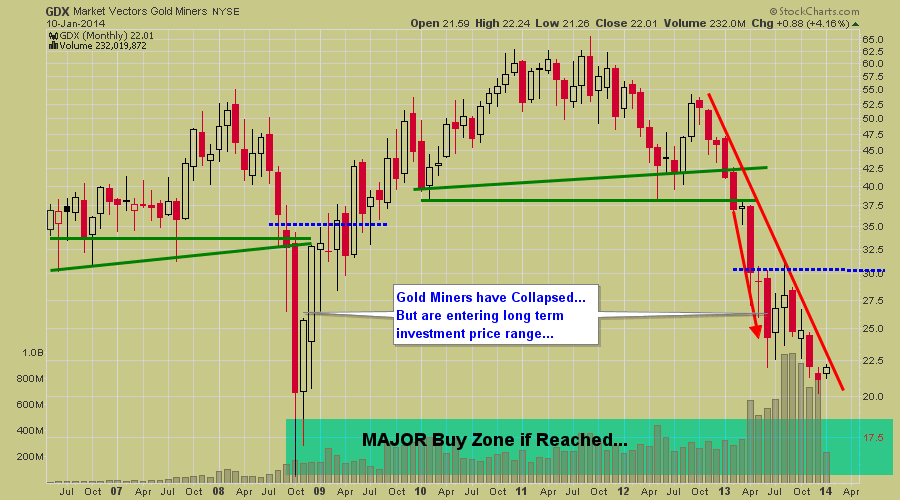
Gold Miners ETF – Monthly Chart
Gold stocks have not yet broken out to start a rally as you can see in the chart below. But the important thing to note is that the daily chart has formed a mini Stage 1 Basing patterns and could breakout this week to kick start a multi month/year rally.
Gold & Gold Stock Bull Market Conclusion:
If you have been following me for a while, you know I don’t try to be a hero and pick tops or bottoms. We all know that strategy is a losing one over the long run.
Since 2011 I have been a very dormant gold trader. Why? Because the price and technical indicators topped out and confirmed a massive consolidation or bear market was in motion.
With gold, gold stocks and precious metals about to start a new bull market, it is time to get back to trading gold and gold stocks.
You can get my daily gold, silver and gold stock analysis every morning with my gold newsletter and save 50% on your membership by joining today!
Get My Gold & Gold Stock Trading Alerts And Save 50% Today! http://www.thegoldandoilguy.com/signup.php
Chris Vermeulen
Get My New Book: “Technical Trading Mastery – 7 Steps To Win With Logic“


