Everyone has been calling for a bottom in Gold the last year. But the fact is that gold and gold stocks are still clearly in a bear market. Just look at the 200 day moving averages. The previous trends were down and prices have been moving sideways for the past year.

A lot of newsletter and analysts are calling a bottom. Technically it’s just a consolidation pattern. Consolidation patterns are a continuation pattern, meaning if the previous trend was down, which it was from 2011 till now, the odds favor price will continue lower after this consolidation.

goldbear

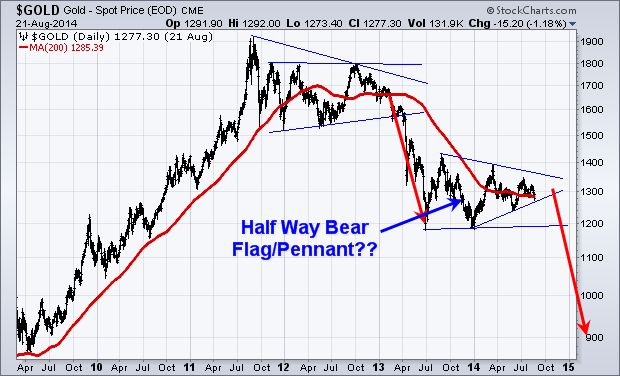
If this consolidation does happen to be the bottom then we can classify it as a stage I base. Gold and gold stocks will start a new bull market, but price needs to break to the upside of this consolidation pattern. Until it breaks to the upside, it is still in a down trend.

Gold topped out over three years ago. And I am in no rush to try to pick a bottom and be a hero here. I’m just going to continue waiting on the sidelines until price confirms either a new bull market has started or for price to breakdown and we get another leg lower.


Oil Outlook

Taking a look at the big picture of crude oil the chart looks bearish. It too has been trading in a range since 2011 and the price is nearing the apex of a consolidation pattern.

oilbear

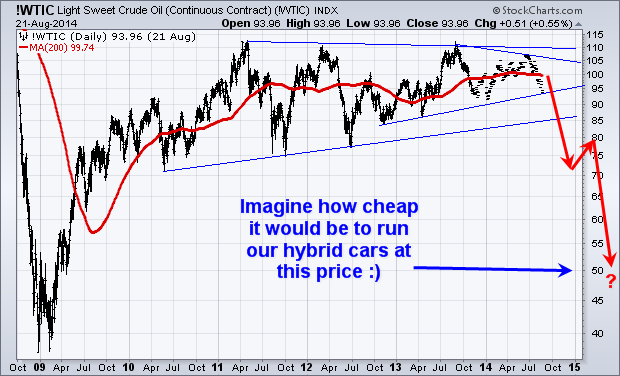
It’s important to know that a pennant formation which is what crude oil has formed are the most predictable when price breaks out of the pattern within the first 1/3rd of the formation.

The longer price consolidates and gets squeezed into the narrowing apex of the pennant pattern, the more unreliable. The trend breakout will be, and it becomes at best a 50/50 bet.

Crude oil’s previous trend was up, but it’s been consolidating for such a long time that price is now squeezed into the apex. This negates that bias for the previous trend to hold true so we have no idea which why it will breakout but when it does expect an explosive move.

A breakdown in crude oil will send price to the $70 or $75 per barrel range, and that will hammer on the Canadian dollar also. I can see $1 USD being equivalent to $1.20 Canadian in a year.

My Gold and Oil Conclusion

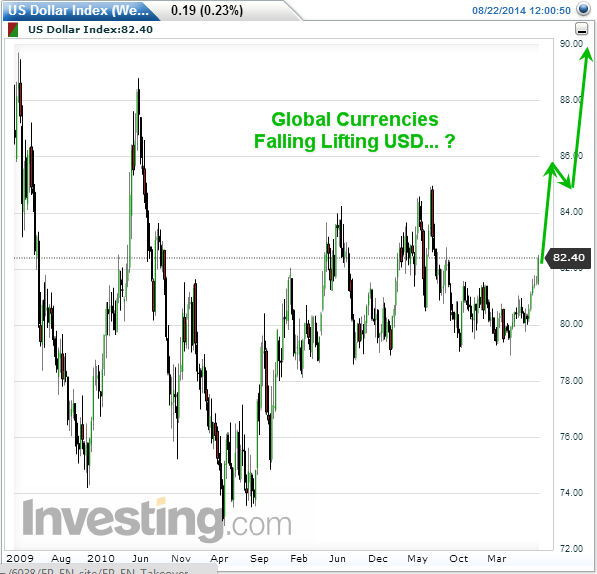
Looking at the US dollar, it has been rising partly due to the euro falling. This strong dollar will put a downward pressure on commodities overall.

Automated Trading System

Gold and oil have not been that exciting for investors since 2011 when they topped out, but both are setting up for massive moves that should last month, if not year or more. Once these new trends emerge expect to see them in the headline news every hour.

It does not matter which way these commodities breakout of the consolidation patterns. With the dollar continuing to rise and the bearish chart patterns for both gold and oil there is a good chance much lower prices are ahead.

This will catch most investor’s off guard. It’s human nature to try to predict tops and bottoms in the market. But this is why most investors get caught on the wrong side of the market. The market always has a way of catching the majority of people on the wrong side of a position.

I am happily sitting in cash with some of my investment capital waiting for gold and oil to breakout of these large patterns. I would not be surprised if we see $900 gold, gold stocks like the gold bugs index $HUI to be at $150, and $70 per barrel for crude oil. I am not saying this is what I want, but you should be mentally prepared so you can get back into cash position and so you can take advantage of falling prices with me.

Big money will be made on the next price movements in these commodities. Whether we have to go long the market or short sell the market. Either way, we can make money. So don’t be a hero and try to pick a top or bottom, just wait for confirmed breakout then invest with the trend.

Would you like my trade alerts CLICK HERE

Want my SP500 trades executed for you in your brokerage account CLICK HERE

Charting your way to financial freedom,

Chris Vermeulen

One thing I have talked about several times which cannot be understated is that is the tendency for investors to believe that complex trading ideas and automated trading systems are better than simple, logical ones.

At first thought this notion is completely understandable. After all, if an idea is fairly simple, how could it possibly be “a secret” and investors not using it yet?

Successful trading and investing is not about how good you look or how impressive you sound in videos. It’s about what, when and how you do it. It does not matter if you are placing the trades yourself or  using an automated trading system. What, when and how the investment is traded is all that matters.

It’s known that highly intelligent people struggle with the markets because they believe intelligence will improve their trading results. The reality is, they do not thing simple trade setups and strategies that look like they will make easy money, will work. Why? Because they think that the market is complex and thus trades should not be simple to spot and time, therefore the simple ideas should not work.

In all fairness “simple trading” is not really that simple. Successful trading requires the right kind of simplicity, in the right amount at just the right time. This is what creates the highly profitable investors and automated trading systems.

Why The Short Traders Are Losing Money This Week:
They are fighting a bull market which is still pointing to higher prices.

Take a look at the chart below of the SP500 futures index. You will notice the bars are color coded; this is done by my automated trading system which identifies the market trend which trades should be trading in line with.

The stock market remains in a full blown bull market. Investors should remain long for time being. On the other hand active investors should be trading with the current market trend which is shown on the chart.

Market corrections within a bull market are sharp and short lived. As an active investor you will be lucky to catch one or two short trades during these pullbacks before the uptrend is retaken.

It is important to know that eventually one of these bull market corrections will be the straw that breaks the camel’s back, and kick starts a new bear market. This his why I always move to cash and look to short each of these corrections. We just never know WHEN a full blown bear market will start. If you are holding your positions through these corrections and think you’re a great investor, just wait until the market does actually breakdown and most of your gains are gone before you realize it. I will admit, its very easy to get lazy with investments after years of rising prices. Laziness and a the lack of a trading strategy for a falling market is what causes 99% of investors to lose their money.

I believe in trading defensively. Sure it’s more work, takes time to follow, and there are extra trading commission fees, but its a  small price to pay to keep the majority of your gains.

Automated Trading Systems & Corrections


SP500 Monthly Big Picture Analysis

Here is the big picture and trend of the SP500 index. Simple fact is, eventually things are going to get really ugly. By stepping back and looking at this chart, it’s clear the market must still fall substantially in value to break below its critical support trend line and before we can confirm a true bear market is in place.

Do you want to see your nest egg drop 20-30% before you decide to exit? Or do you want to profit from this initial correction when it does happen, and make even more money when the stock market drops for a year or two after taking your account to new all-time highs.

Automated Trading Systems Big Picture

Keep It Simple Conclusion: Automated Trading Systems?

The good news is that if you keep things simple by following the intermediate trend, like the color coded chart above, you can keep making money as the market rises to ridiculous new highs, and avoid market corrections, and possibly even profit from them.

In my next article I will show you a simple trading strategy that I have used for many years to time stock market bottoms and tops for swing trading. Best part is that the data I use is available online for free.

One final note, there are automated trading systems that does all this for you. I also use it and have it trade my own investment capital for me. You can learn more about it and join my mailing list here:http://www.algotrades.net/automated-trading-system-2/

Chris Vermeulen

LOOKING FOR AN ALGORITHMIC TRADING SYSTEM THAT DOES ALL THE WORK FOR YOU IN CANADA?

Algorithmic Trading Canada

Algorithmic Trading Canada

If you are an investor or trader who lives or works in within Canada and you are interested in algorithmic trading Canadaautomatic investing Canada, and automated trading Canada, then look no further. AlgoTrades Systems is a Canadian company located in Ontario, just north of Toronto.

If you live in one of these Canadian provinces you can use their algorithmic trading system: Ontario, Quebec, Alberta, Nova Scotia, Saskatchewan, Manitoba, New Brunswick, Newfoundland and Labrador, Prince Edward Island (PEI), and even the North West Territories, and Nunavut.

Unfortunately if you are interested in algorithmic trading and live in British Columbia, you are out of luck. British Columbia is the only location in the world that does not allow algorithmic trading (automated trading systems) for their residents. So much for a free country…

Research shows that the United States (USA) is number one for people searching algorithmic trading systems, with India being second, and Canada third. I was blown away that Canada was #3 for algorithmic trading.

ALGOTRADES ALLOWS YOU TO FREE YOURSELF – WE DO THE HEAVY LIFTING FOR YOU

Say goodbye to searching for hot stocks, figuring out technical patterns, or even reading market opinions. AlgoTrades does all the searching, timing and investing for you using our advanced algorithmic trading systems.

You only have to hook up your trading account – it is very simple and only takes a few minutes – and then you can finally relax while we let sophisticated algorithms take profits out of the market for you.

Watch Algorithmic Trading System Video

The number of algorithmic traders in some of Canada’s largest cities are vast within these top cities: Vancouver, Calgary, Edmonton, Ottawa, Toronto, Montreal, Winnipeg, Hamilton, Kitchener, Camebridge, Waterloo, St. Catharines, Oshawa, Whitby, Carlington, Victoria, Windsor, Saskatoon, Regina, St. Johns, Sherbrooke, Barrie, Kelowna, and Halifax.

Most traders follow the S&P 500 Index closely, but few equity or futures traders are able to structure trades that are profitable based solely on the passage of time. Option traders use a variety of trade structures, called credit spreads to actually make the passage of time a profitable endeavor. Unfortunately there is one catch . . . the price of the underlying asset has to cooperate.

What many readers may find interesting is that I structure my option portfolio around being positive Theta. This essentially means that the portfolio collects option premium as time passes which will be converted into profits if prices cooperate. I attempt to consistently capture close to 1% of my account value per day in positive time decay.

Inquiring minds might ask how I accomplish this task.
The answer:
multiple iron condor spreads. An iron condor spread is a credit spread where a trader takes a call credit spread and a put credit spread simultaneously. In many cases, the trader expects the underlying asset to consolidate or trade in a specific range.

I have several high probability iron condor spreads in my portfolio all the time. I trade the same trade structure using the same underlying assets over and over again. In many cases, I will have more than one iron condor spread on the same underlying asset on my books at the same time. The underlying assets that I focus my iron condor strategy around are primarily index options and index etf’s.

I trade the S&P 500 cash index (SPX), the Russell 2000 cash index (RUT), the Nasdaq 100 ETF QQQ, and the Dow Jones Industrial Average ETF which is DIA. These are just a few of the underlying assets that I trade using the iron condor strategy. I traditionally enter the trades at about 50 days to expiration using a probability of success of around 80%. Most of the time, the broader index would have to move roughly 2 standard deviations from the current price at entry to create losses in my portfolio.

Back in early July I entered an August SPX Iron Condor Spread which presently is boasting profits of around 10% on maximum potential risk. However, I wanted to show readers that recently I entered a September SPX Iron Condor Spread with about 50 days to expiration. The probability of success was around 80% for the trade to be profitable. The following chart of the S&P 500 demonstrates the price range where the new September SPX Iron Condor Spread will be profitable if held to expiration.

Chart1 (1)

As can be seen above, the new September SPX Iron Condor Spread is profitable as long as the SPX price stays between 1,785 – 2,050. The trade was entered on July 22nd in addition to the August SPX Iron Condor Spread that I was holding at the time. The chart below shows the price range in the S&P 500 Cash Index (SPX) which will be profitable if both SPX iron condor spreads are held to expiration.

Chart2 (1)

If both SPX spreads are held to expiration, the profitability range for both trades held simultaneously is 1,820 – 2,020. The probabilities are quite favorable that one if not both trades will be profitable at the August and September expirations.

The combined strategy offers a probability of close to 80% to make a positive return. Based on maximum possible risk, the typical return is between 10% – 15% depending on implied volatility changes during the holding period of the trade. At first glance, many traders write this strategy off as a poor strategy based on risk / reward. However, what other strategy offers nearly a 10% – 15% return on maximum risk with a near 80% probability of success at the time of entry?

When paired with other directional trades, having multiple, high-probability iron condor spreads on the books at the same time builds a high level of positive theta that helps support consistent portfolio profits. So far, the recently launched Technical Traders’ option service is boasting two closed trades thus far. Both trades that have been closed were quite profitable.

The first winning trade was in Facebook which was directional biased to the upside and a call diagonal spread was the trade structure chosen to use. The trade had a maximum risk of $493 per spread and produced a gross gain of $111, or 22.51% per spread. The other big winner was a FXE Put Butterfly Spread which was designed to profit partially from the passage of time and from lower FXE prices. The trade was entered with a maximum risk of $141 per spread and produced a gross gain of $53, or 37.59% per spread.

Overall, the new option service is off to a great start and currently has several additional trades which are profitable at this time. For more information, click the following link to check out the new cheaper, upgraded options service at: www.TheTechnicalTraders.com/options/

Chris Vermeulen