Algorithmic trading which is also known as automated trading has changed the way I trade and invest dramatically. As you know trading is extremely difficult to be consistently profitable in. The #1 reason individuals fail is because they struggle with their emotions and end up trading with the general market sentiment. While the herd mentality/feeling can and most of the time feels like the proper (logical) way to look at the market, trading with the “herd mentality” is the silent killer.

I am going to teach you how to read market sentiment so you can swing trade and profit consistently from emotional traders to earn 1% – 3% per month trading the SP500 index. If you want to make money, you need to trade against the herd (masses) at key support and resistance levels in the market. Plus you should have a robot (algorithmic trading system) execute these trades for you. Because, you need to completely remove your emotions from the game, and because it’s not rocket science to identify key levels where you should be entering and exiting the market with your money.

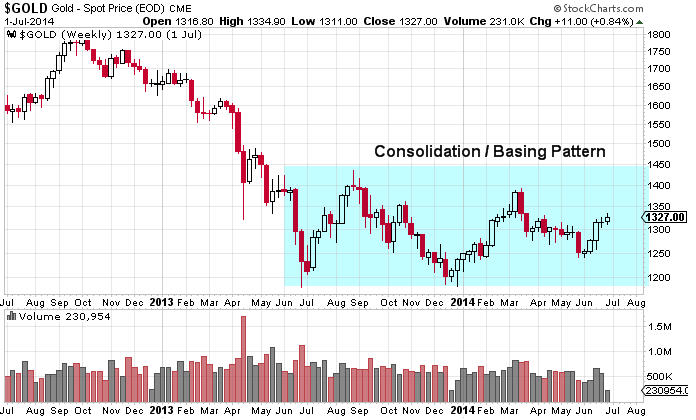
You start by looking at the market completely backwards. Focus on buying positions during heavy volume sell-offs (panic) and sell your positions during heavy volume rallies (greed). This was a very tough transition for me and I still get nervous and emotional during these times when my system enters and exits positions. This strategy feels completely wrong at the beginning but the profits speak for themselves!

One Of My Algorithmic Trading Strategies

This trading strategy is my favorite because I know the masses are panicking out of positions, sweating, and having heart burn, while my automated trading system is entering a high probability position against them. This analysis may seem basic at first glance, and that is because it is, but when you combine the analysis of each indicator explained below, you end up with a highly effective trading strategy. I took things on step further and converted into an automated trading strategy. This is one of nine automated trading strategies I use.


SP500 – 5 Minute Chart – Algorithmic Trading Strategy #1

This SP500 chart shows where a high probability short trade should be executed based on the algorithm trading indicator. It is important to know that over the past 6 years the SP500 has provided a 1.25% profit on average each time one of these extreme sentiment readings occur on the charts. While that may not sound like much of a return, know this happens several times each month and better yet, if you trade the ES mini futures, you get a lot more leverage. ES trading turns a 1.25% index gain into roughly a 10% gain based on futures margin requirements for one contract.

Anyways, the red indicator on the chart is a simple volume based indicator which measures fear and greed in the market. It is very accurate at picking market tops and bottoms. And I  calculate it by taking the NYSE up volume and dividing it by the down volume. When you see this indicator start to rise it tells us the majority of traders (the herd) are buying (greedy) and we should start looking for a short entry.

algorithmic-trading-system-1

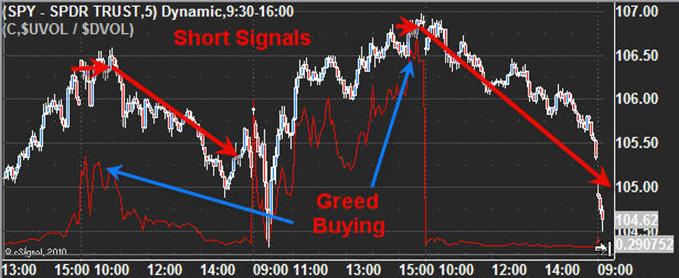
Let me show you how to find the trade using the market sentiment…


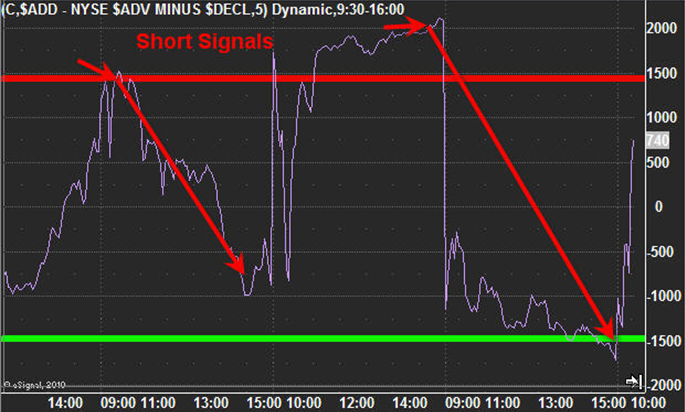
The NYSE advance/ decline line Algorithm Trading Strategy #2

How to use the NYSE advance decline indicator. It’s simple really, when there are 1500+ stocks trading up on the day then the market is getting overbought. Meaning too many stocks have moved up in a short period of time and traders will most likely start taking profits. When the other two indicators talked about in this article are confirming a short sell signal the odds highly favor a selloff in the stock market that should last 1-3 days.

algorithmic-trading-strategy-2


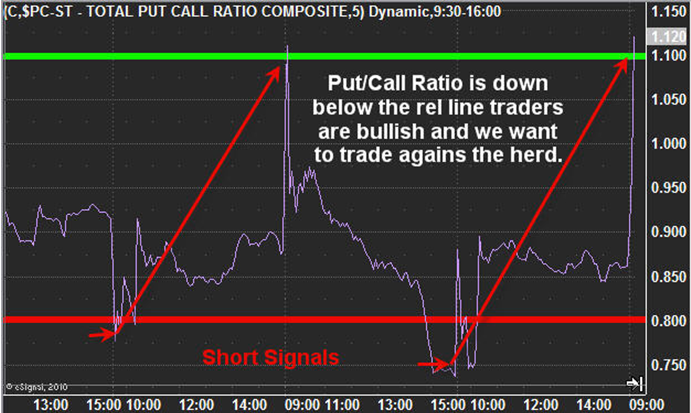
Last algorithmic trading strategy #3 is the put/call ratio

The put call trading algorithm can be a little tougher to use at times because when the market is trending down the ratio tends to fluctuate near the top. It stays near the bottom of the chart when the market is trending up but it is just the extreme spikes we are looking for.

When the broad market bounces and we see the put/call ratio drop into the lower band it’s telling me the majority of traders have finally become bullish. This tends to happen once a previous high is broken as it triggers short covering and breakout traders start to buy within a false rally during a down trending market.

trading-algorithm-3


Algorithmic Trading Strategies Conclusion:

If all you do is use these three indicators, focus on the 5 or 10 minute charts, trade only with trend of the daily charts 20 day moving average, and take partial profits at 1%, again at 2%, while keeping a small position open as a trend trade, you will become a more consistent trader and be able to profit from a falling stock market.

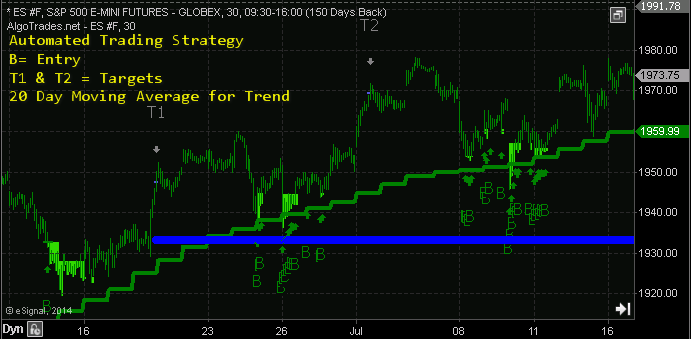
My proven algorithmic trading strategy  running live but this is in a rising market… $3200 in profits made quickly, with low stress and 100% hands-free, what else can you ask for…?

algorithmic-trading-4

It is critical that once you take partial profits at a 1% gain, you start moving your protective stop into the money to lock in a profit for the balance of the position. All three indicators need to reach the extreme levels at the same time for a trade to be triggered. Know that I have seen the market continue a trend during extremely oversold market conditions which lasted for months at times. Do not try to bet against the market just because you think its oversold and should not be shorted, just ride the trend for all its worth. Eventually your last trade will lose as the trend reverses, but wait for it, and expect to lose a trade from time to time,

Final thoughts, this strategy works just as well during a bull market. There are some minor changes required on each of the indicators which I will cover in another automated trading strategy article soon, so stay tuned for more logical trading tips.

Have My Bull & Bear Market Strategies Automatically Traded For You: www.AlgoTrades.net

Chris Vermeulen

Facebook is a hot momentum stock that has found its way on trading lists for many traders, myself included. Facebook stock and options have strong liquidity, decent volatility to trade typically, and the stock price is generally momentum driven.  Generally speaking, if technology stocks are working Facebook (FB) is moving higher, however the same can be said regarding technology sector weakness.

Earlier in the year, Facebook was consolidating in a price range between around $54.50 per share to around $63.50 per share. From late May into the early part of June, FB pushed to the upside toward $68 per share as can be seen below:

Chart1 (1)

The move to the upside in Facebook stalled at the end of June and price dropped rapidly at the beginning of July. FB opened on July 1st at $67.58 per share. By July 8th, Facebook closed trading at $62.76 per share, a drop of more than 7% in a very short period of time.

As a contrarian trader, I immediately became interested in taking a long trade to capture a quick pop higher in Facebook. On July 9th, I entered a FB Call Diagonal Spread which would benefit from the passage of time as well as higher prices in Facebook.

The trade was constructed in the following manner:
Buy to Open 1 FB August Monthly 62.50 Call
Sell to Open 1 FB July Monthly 70 Call

The total trade was executed at a cost of 4.93 per spread or a maximum risk of $493 per spread. On July 15th, the trade was closed for a credit of 6.04, or a profit of $604 per spread. The trade resulted in a gross gain of $111 per spread, or 22.51% based on maximum risk undertaken per spread. The Facebook stock chart during this period of time indicating higher prices is shown below.

Chart2 (1)

This trade was taken in our new options service and members were able to capitalize on a very profitable trade in a fairly short period of time. This trade was taken with about half the normal risk that the service opens new trades with as it is an opening debit trade which typically constitutes smaller position sizing based on the service’s strategy.

Overall, the new service is off to a great start in terms of performance and the service is sending out nearly one new trade per day for members. Primarily we focus on credit spreads and more advanced option trades, but from time-to-time we do sprinkle in some basic long options for directional trades in the S&P 500 Index (SPX) and the Volatility Index (VIX). The FB trade is just another great example of how advanced option strategies can produce very strong returns in a fairly short period of time!

Join Us Today at: http://www.thetechnicaltraders.com/options/

Chris Vermeulen

Oil futures were on the tip of every political and financial pundits’ tongues less than a month ago as geopolitical tensions in Iraq heated up. Fast forward to today, and tensions in the Middle East have intensified further. However, since June 25th oil prices have been falling fast.

Oil futures prices have fallen from around $107.50 per barrel down to around $101.50 / barrel as I am writing. As the chart below indicates, oil futures should see some support around the $101 per barrel price level and stronger support yet down around $98 per barrel.

Chart1 (1)

Is this a pullback that is setting up for a larger move to the upside, or is oil prices going to move down toward $95 / barrel again? Purely from a statistical standpoint, including June 25th through today oil prices have traded 12 sessions. During those 12 trading sessions, oil prices only managed to close in positive territory 4 times with some very strong selling pressure along the way. In raw percentage terms, oil futures have lost nearly 5.5% since June 25th peak to trough.

Purely from a statistical standpoint, the probabilities are favorable that at the very least a bounce could play out in the near future that lasts several trading sessions. Furthermore, that bounce could turn into a stronger move to the upside in the weeks ahead. Obviously at this point it is purely speculation, but the intermediate to longer term trend on the daily time frame is clearly to the upside.

Instead of just rushing in and buying a long oil position using futures or purchasing an oil ETF like USO, I wanted to construct an option trade that would capitalize from higher oil prices in the near term, but with some hedging in case more downside occurs.

In order to accomplish this, I am going to use a standard Iron Condor trade construction. This construction capitalizes on time decay and volatility decay. Additionally this structure will allow traders to profit from a consolidating price pattern as the profitability is measured in a range.

However, when designing this trade structure I want to skew the position to the upside by selling the put side of the Iron Condor Spread closer to the current USO price. The call credit portion of the spread will be sold further from price. By structuring the trade in this way, I will maximize the profit potential of this trade and provide some hedging by reducing the total maximum risk per spread by adding the call credit portion of the trade.

Consider the price chart of USO which is shown below. I have highlighted the price range that would be profitable to the August monthly option expiration which would occur at the close on August 15th.

Chart2 (1)

As long as price stays in the range shown above, the USO August Iron Condor Spread would be profitable.  This strategy does involve some patience, but if USO prices shot up in a short period of time the trade could be closed for some nice potential profit.

The trade structure I have chosen would have a profit potential of $35 per spread, or a total potential return based on maximum potential risk of 30.43% per spread. The probability based on today’s implied volatility in USO options for the entire spread to be profitable at expiration (August 15th) is roughly 72%.

Our new option service specializes in identifying these types of trading setups and helps investors capitalize on consolidating chart patterns, volatility collapse, and profiting from the passage of time.

And if advanced options trades are not for you, we also provide simple option trading setups where we buy either a call or put option based on the SP500 and VIX. The nice thing about buying calls and puts is that you can trade with an account as little as $2,500 with big potential upside.

Join Us Today at: http://www.thetechnicaltraders.com/options/

Chris Vermeulen

Until recently, the world has forgotten about gold and gold futures prices it would seem. A few years ago, all we heard about was gold and silver futures making new highs on the back of the Federal Reserve’s constant money printing schemes. However, after a dramatic selloff the world of precious metals it became very quiet.

Gold prices have been in a giant basing or consolidation pattern for more than one year. As can clearly be seen below, gold futures prices have traded in a range between roughly 1,175 and 1,430 since June of 2013.

Chart1

The past few weeks we have heard more about gold prices as we have seen a five week rally since late May. I would also draw your attention to the fact that gold futures also made a slightly higher low which is typically a bullish signal.

At this point in time, it appears quite likely that a possible test of the upper end of the channel is possible in the next few weeks / months. If price can push above 1,430 on the spot gold futures price a breakout could transpire that could see $150 or more added to the spot gold price.

Clearly there are a variety of ways that a trader could consider higher prices in gold futures. However, a basic option strategy can pay handsome rewards that will profit from a continued consolidation. The trade strategy is profitable as long as price stays within a range for a specified period of time. Ultimately this type of trade strategy involves the use of options and capitalizes on the passage of time.

The strategy is called an Iron Condor Strategy, however in order to make this trade worth while we would consider widening out the strikes to increase our profitability while simultaneously increasing our overall risk per spread. Consider the chart of GLD below which has highlighted the price range that would be profitable to the August monthly option expiration on August 15th.

Chart2

As long as price stays in the range shown above, the GLD August Iron Condor Spread would be profitable. Clearly this strategy involves patience and the expectation that gold prices will continue to consolidate. This trade has the profit potential of $37 per spread, or a total potential return based on maximum possible risk of 13.62%. The probability based on today’s implied volatility in GLD options for this spread to be profitable at expiration (August 15) is roughly 80%.

Our new option service specializes in identifying these types of consolidation setups and helps investors capitalize on consolidating chart patterns, volatility collapse, and profiting from the passage of time. And if you Advanced options trades are not your thing, we also provide Simple options where  we buy either a call or put option based on the SP500 and VIX. The nice thing about buying calls and puts is that you can trade with an account as little as $2,500.

If You Want Daily Options Trades, Join Technical Traders Options Alerts: www.TheTechnicalTraders.com/options

Chris Vermeulen